


The U.S. oil and gas industry saw a slight decline in drilling activity this week, with the total rig count dropping by one to 543, according to the latest data from Baker Hughes.
This continues a trend of subdued rig additions amid fluctuating commodity prices and market uncertainties. Meanwhile, U.S. crude oil production also edged lower, falling by 58,000 barrels per day (bpd) to 13,753 thousand bpd for the week ending January 9, 2026, based on the Energy Information Administration’s (EIA) weekly estimates.
Natural gas production remains robust but shows signs of stabilization at elevated levels, with recent monthly figures around 107-110 billion cubic feet per day (Bcf/d).
This article breaks down the rig counts by type, state, and basin, while also examining trends in oil and natural gas production. Charts are included to visualize key trends.Rig Count Breakdown by Type (Oil vs. Gas)The total rig count of 543 represents a decrease of 1 from the previous week and is down 37 rigs compared to the same time last year.
Here’s the split:
Oil Rigs: 410, up 1 from last week but down significantly year-over-year (from around 480 in early 2025).
Gas Rigs: 122, down 2 from last week, reflecting ongoing softness in natural gas drilling amid ample supply.
Miscellaneous Rigs: 11, unchanged.
Oil rigs continue to dominate, accounting for about 76% of the total, while gas rigs make up 22%, and miscellaneous rigs the remaining 2%.
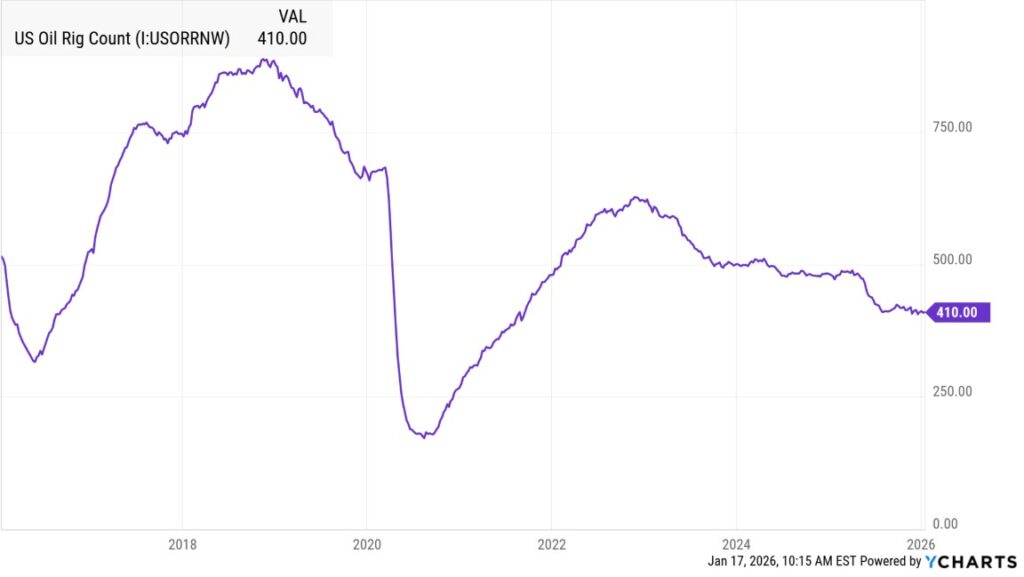
This chart illustrates the recent trajectory of U.S. oil rig counts, highlighting the gradual decline over the past year.
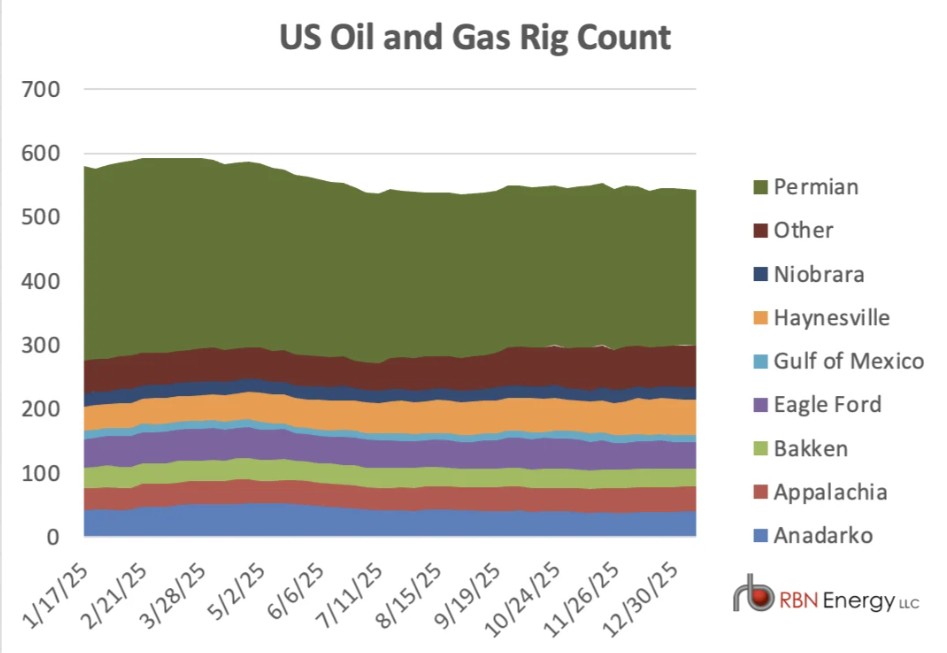
Similarly, this visualization shows the combined oil and gas rig count trends as of early 2026.
Rig Count by State
Drilling activity varies widely by state, with Texas remaining the epicenter. Based on the most recent available breakdowns (noting minor weekly adjustments), key states include:
|
State
|
Rig Count
|
Weekly Change
|
Year-Over-Year Change
|
|---|---|---|---|
|
Texas
|
231
|
-1
|
-52
|
|
New Mexico
|
~90
|
~0
|
-15
|
|
North Dakota
|
~30
|
-1
|
-10
|
|
Oklahoma
|
~40
|
0
|
-12
|
|
Louisiana
|
~35
|
-1
|
-8
|
|
Pennsylvania
|
~20
|
-1
|
-5
|
|
Colorado
|
~15
|
+1
|
-3
|
Texas accounts for roughly 43% of the national total, driven by the prolific Permian Basin. States like Pennsylvania and Louisiana, more gas-focused, saw small declines aligned with the drop in gas rigs.
Rig Count by Basin
Major basins drive the majority of U.S. drilling. The Permian Basin remains the leader, with no change this week:
|
Basin
|
Rig Count
|
Weekly Change
|
Year-Over-Year Change
|
|---|---|---|---|
|
Permian
|
244
|
0
|
-60
|
|
Eagle Ford
|
~50
|
0
|
-10
|
|
Williston (Bakken)
|
~30
|
-1
|
-10
|
|
Haynesville
|
~40
|
-1
|
-8
|
|
Marcellus/Utica
|
~25
|
-1
|
-6
|
|
Anadarko
|
~35
|
0
|
-12
|
|
DJ-Niobrara
|
~15
|
+1
|
-3
|
The Permian Basin, spanning Texas and New Mexico, hosts about 45% of all U.S. rigs and focuses heavily on oil. Gas-oriented basins like the Haynesville and Marcellus saw the bulk of this week’s declines, consistent with the drop in gas rigs.
Oil and Gas Production Trends
Crude Oil Production
U.S. crude oil production dipped this week, aligning with the modest rig count adjustment. The EIA reports field production at 13,753 thousand bpd for the week ending January 9, down from 13,811 thousand bpd the prior week—a decrease of about 0.4%.
This follows a re-benchmarking by the EIA, which slightly lowered estimates.
Regionally, production remains concentrated in the Lower 48 states, with Texas and the Gulf of Mexico leading. Annual forecasts from the EIA’s Short-Term Energy Outlook suggest 2026 production will average around 13.6 million bpd, a slight decline from 2025’s record 13.6 million bpd, due to lower prices curbing drilling enthusiasm.
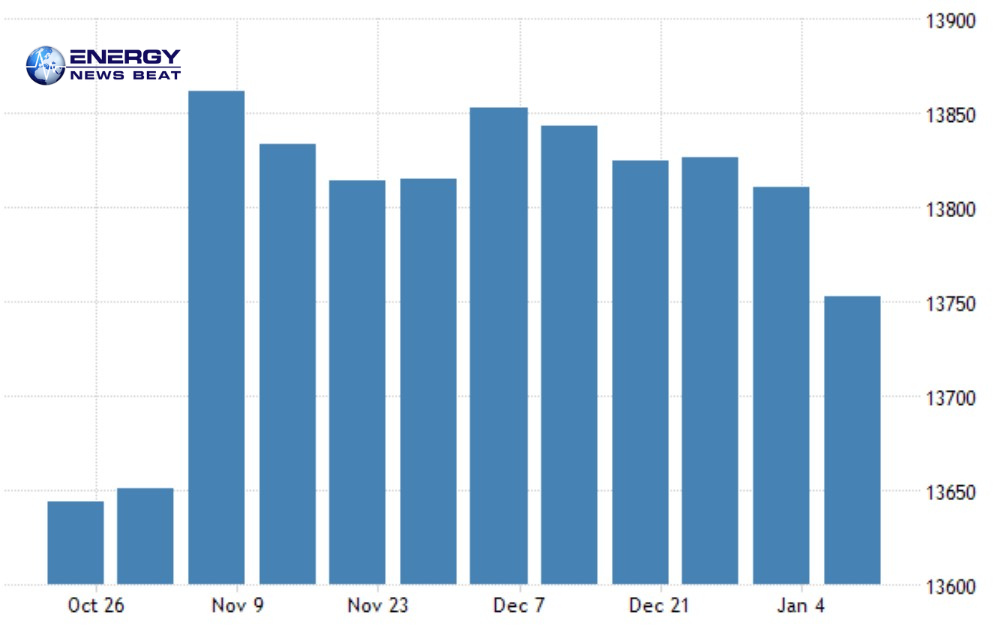
This weekly crude oil production chart shows the recent dip amid broader high output levels.
Natural Gas ProductionNatural gas production data is reported monthly by the EIA, with the latest figures for October 2025 showing dry natural gas production at 107.2 Bcf/d, up 4.2% year-over-year.
Recent estimates indicate Lower 48 production holding steady at 108-110 Bcf/d, supported by resilient output despite the rig drop.
The EIA forecasts annual dry gas production to rise to 108.8 Bcf/d in 2026 from 107.4 Bcf/d in 2025, driven by demand from LNG exports and power generation.
However, with gas rigs declining, future growth may moderate if prices remain low.
This chart depicts monthly natural gas production trends, underscoring the steady upward trajectory.
Outlook and Implications
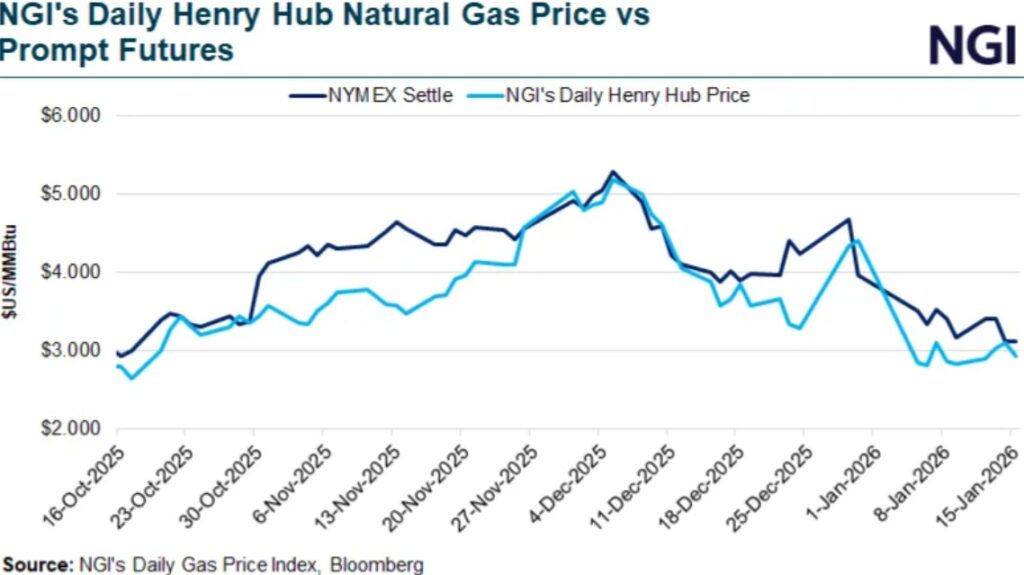
The minor rig count decline and oil production dip reflect cautious operator sentiment amid WTI prices hovering around $50-60 per barrel and natural gas at the Henry Hub near $3.10/MMBtu.
With global demand uncertainties and ample inventories, the industry may see continued consolidation in key basins like the Permian.
For more insights on energy markets, tune into the Energy News Beat podcast. Follow us on X @STUARTTURLEY16
for real-time updates.
Data sourced from Baker Hughes and EIA as of January 17, 2026.
Sources: aogr.com, oilgasleads.com, X, Grok, eia.gov, tradingeconomics.com


Be the first to comment