

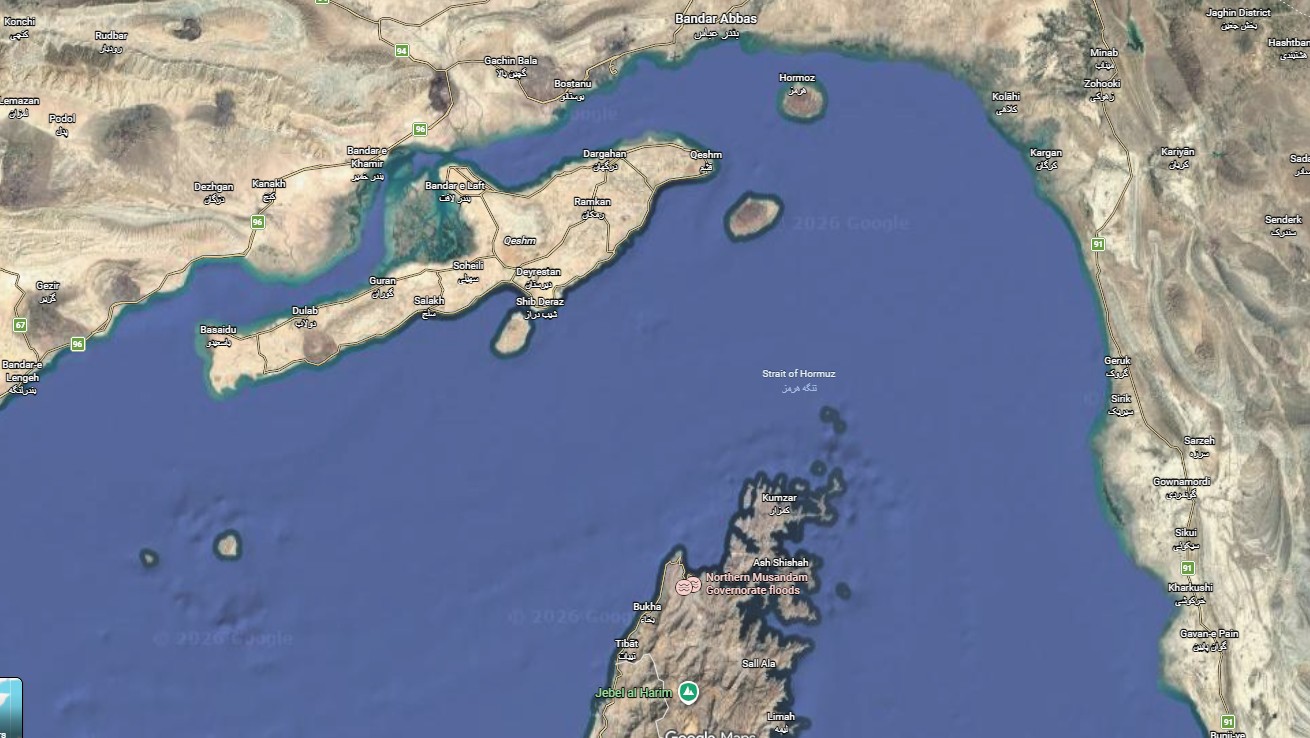
The Strait of Hormuz, one of the world’s most critical energy chokepoints, saw dramatically reduced maritime traffic in March 2026 amid ongoing regional tensions following U.S.-Israeli strikes on Iran and subsequent Iranian restrictions on shipping. According to data shared by MarineTraffic and analytics firm Kpler, a total of just 220 vessels transited the strait during the month across dry bulk, liquids, LPG, and other segments. This figure represents a historic low compared to pre-conflict norms and underscores the severe disruption to global oil and gas flows.
Vessel Breakdown: Who Transited and What Types Dominated?
Liquid tankers led the traffic, accounting for 111 crossings (51% of the total). These were primarily crude oil and petroleum product carriers. Dry bulk vessels followed with 82 transits (37%), while 27 LPG carriers (12%) also made the passage. Notably, zero LNG carriers were recorded, reflecting the halt in Qatar’s massive liquefied natural gas exports that normally flow through the strait.
Traffic was heavily skewed west-to-east (outbound from the Gulf), with 149 crossings (68%) heading toward Asian markets. East-to-west (inbound) movements totaled only 71 crossings (32%). Vessel tracking visuals from MarineTraffic (a timelapse covering early to late March) showed sparse activity, with clusters of vessels loitering near ports such as Ras Al Khaimah, Umm Al Quwain, and inside the Gulf, alongside limited transits hugging Iranian territorial waters in some cases.
Specific vessel details from Kpler and related tracking indicate that many of the tankers and bulk carriers were linked to Iranian, Chinese, Indian, or limited UAE/Saudi operations. Examples include Indian-flagged LPG tankers and China-bound carriers carrying methanol or other products. A significant portion of the limited oil traffic involved Iranian exports, often via ship-to-ship (STS) transfers in the Gulf before heading east. Bulk carriers and some LPG vessels reportedly used unusual routes through Iranian waters. Overall, the traffic was dominated by “shadow fleet” or sanctioned-tolerant operators, with compliant international tankers largely absent due to insurance, war-risk premiums, and security concerns.
Where Did the Products Go?
Outbound cargoes (the majority) were predominantly destined for Asia, consistent with historical patterns but at a fraction of volume. China remained a key buyer of Iranian crude and other products, with vessels routing toward Chinese ports or conducting STS transfers off Malaysia/Singapore before final delivery. India and other Southeast Asian buyers also featured in limited LPG and product shipments. Inbound traffic (east-to-west) was minimal and likely involved supplies or empty returns into the Gulf.
The cargoes carried far less than normal volumes: pre-conflict, the strait handled roughly 20 million barrels per day (mbpd) of crude oil, condensate, and petroleum products (about 20-21% of global petroleum liquids consumption), plus significant LNG. March’s 220 vessels moved a tiny fraction of that, contributing to global supply tightness and rerouting of tankers from other regions (e.g., U.S. Gulf Coast diesel heading to Australia and Singapore).
Comparison to Normal Traffic
Under normal conditions, the Strait of Hormuz sees approximately 100-138 commercial vessels per day (roughly 3,000–4,140 per month), including tankers, bulk carriers, containers, and gas carriers. This supports about one-fifth of the global oil and LNG trade. In March 2026, the 220 total transits equated to an average of roughly 7 vessels per day—a 95%+ drop from peacetime levels. Early March saw single-digit daily figures (often 1-6), with a modest pickup later in the month (averaging 9-11 vessels/day in the final week). The disruption began sharply after February 28, with widespread U-turns, idling, and diversions.
This collapse has forced a massive rerouting of global tanker fleets and highlighted the vulnerability of Gulf exports.
Saudi Arabia and UAE Pipeline Bypass Volumes
Gulf producers have maximized alternative pipelines to circumvent the strait:
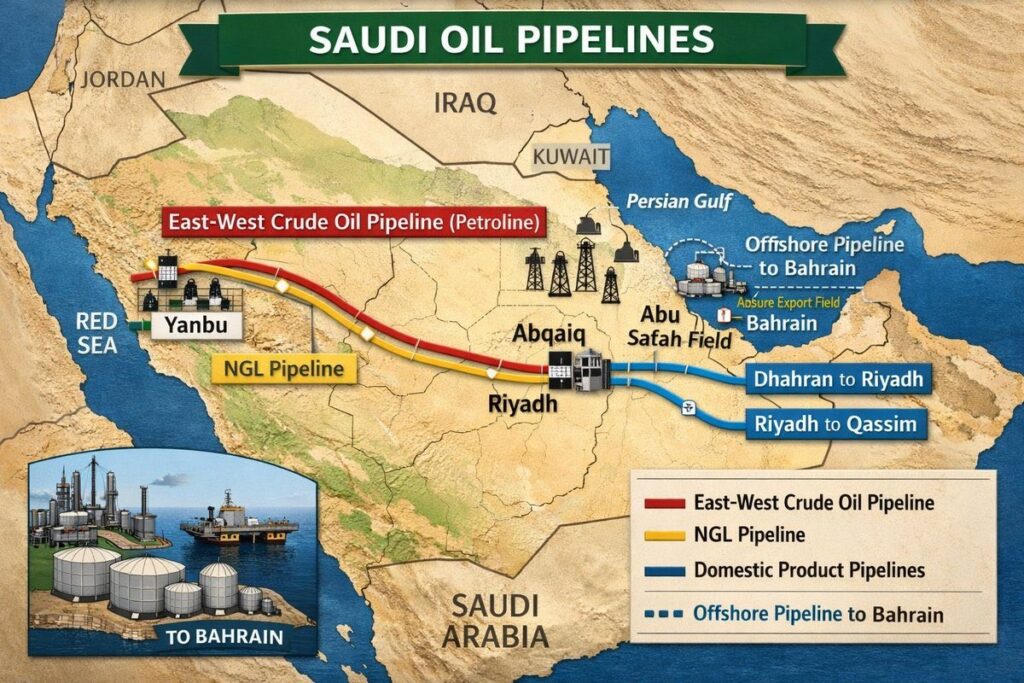
Saudi Arabia’s East-West Pipeline (Petroline): This 745-mile line, with a capacity now at 7 million bpd, has been running at full capacity in recent weeks. Approximately 5 million bpd of crude is exported via the Red Sea port of Yanbu, with an additional 700,000–900,000 bpd of refined products. Around 2 million bpd supplies domestic refineries on the western coast. Pre-conflict flows through the pipeline were far lower (averaging ~770,000 bpd in January-February 2026). Yanbu crude exports have surged to 4-5 million bpd, positioning Saudi Arabia as a more resilient supplier.
UAE’s Habshan-Fujairah Pipeline (ADCOP): With a nameplate capacity of 1.5 million bpd (surge capability up to 1.8 mbpd), flows have ramped up significantly. Fujairah crude loadings averaged **1.9 million bpd** in late March (up ~57% from 2025 averages), with March overall around 1.6-1.7 million bpd of crude and products. This bypasses the strait entirely, delivering to the Gulf of Oman for export.
Combined, these pipelines provide ~6.5-7 million bpd of bypass capacity (Saudi + UAE), but they fall well short of replacing the full ~20 mbpd normally transiting Hormuz and cannot fully offset refined product or LNG flows.
Countries Imposing Bans or Restrictions on Diesel, Gasoline, and Jet Fuel Exports
The Hormuz disruption has triggered global refined product shortages and price spikes, prompting several nations to restrict exports to protect domestic supplies:China: Banned exports of diesel, gasoline, and jet fuel effective March 12 (extended into April with minor exemptions for select Southeast Asian countries like Bangladesh, Myanmar, Vietnam, etc.). Jet fuel for international refueling/bunkering is exempt.
Russia: Imposed a ban on gasoline exports for producers until the end of July 2026 to stabilize domestic prices amid refinery issues.
Thailand: Banned most refined fuel exports.
Kazakhstan: Extended its ban on gasoline, diesel, and certain petroleum products exports (by road/rail) until May 20, 2026.
South Korea: Capped refined product exports at last year’s levels and is considering further curbs.
India: Imposed export taxes on diesel/jet fuel while removing domestic excise duties on diesel.
Additional measures are under discussion in the EU and elsewhere to manage diesel/jet fuel availability. These actions reflect a broader scramble to secure supplies as Asian buyers (heavily reliant on Chinese exports and Gulf feedstocks) face shortages.
Outlook
March’s 220 transits highlight the ongoing fragility of energy security in the Gulf. While Saudi and UAE pipelines have mitigated some crude losses, the absence of LNG, reduced product flows, and resulting export bans are tightening global markets. Watch for April data—any sustained reopening or further escalation will shape oil prices, tanker rates, and refined product availability for the rest of 2026.
- MarineTraffic X post (original data): https://x.com/MarineTraffic/status/2040006349312979412
- Kpler/MarineTraffic analysis and related reports (via web searches on Hormuz traffic).
- EIA historical data on Hormuz (pre-2026 baseline): https://www.eia.gov/todayinenergy/detail.php?id=61002
- Argus Media, Reuters, Bloomberg, Al Jazeera, and World Oil reports on Saudi/UAE pipelines (March 2026 updates).
- Reuters on China/Russia/Thailand export bans and restrictions.
- Additional tracking from Windward, Lloyd’s List Intelligence, and IMF PortWatch.
Energy News Beat will continue monitoring real-time developments. Stay tuned for updates.