

J.P. Morgan has issued a stark warning to energy markets: oil prices could spike to $120–$130 per barrel in the near term, with a real risk of surging above $150 per barrel if supply disruptions through the Strait of Hormuz persist into mid-May. In comments to The Times, JPMorgan’s global head of economics, Bruce Kasman, added that a de facto blockade lasting another full month would be consistent with Brent crude climbing toward $150 and forcing constraints on industrial energy users.
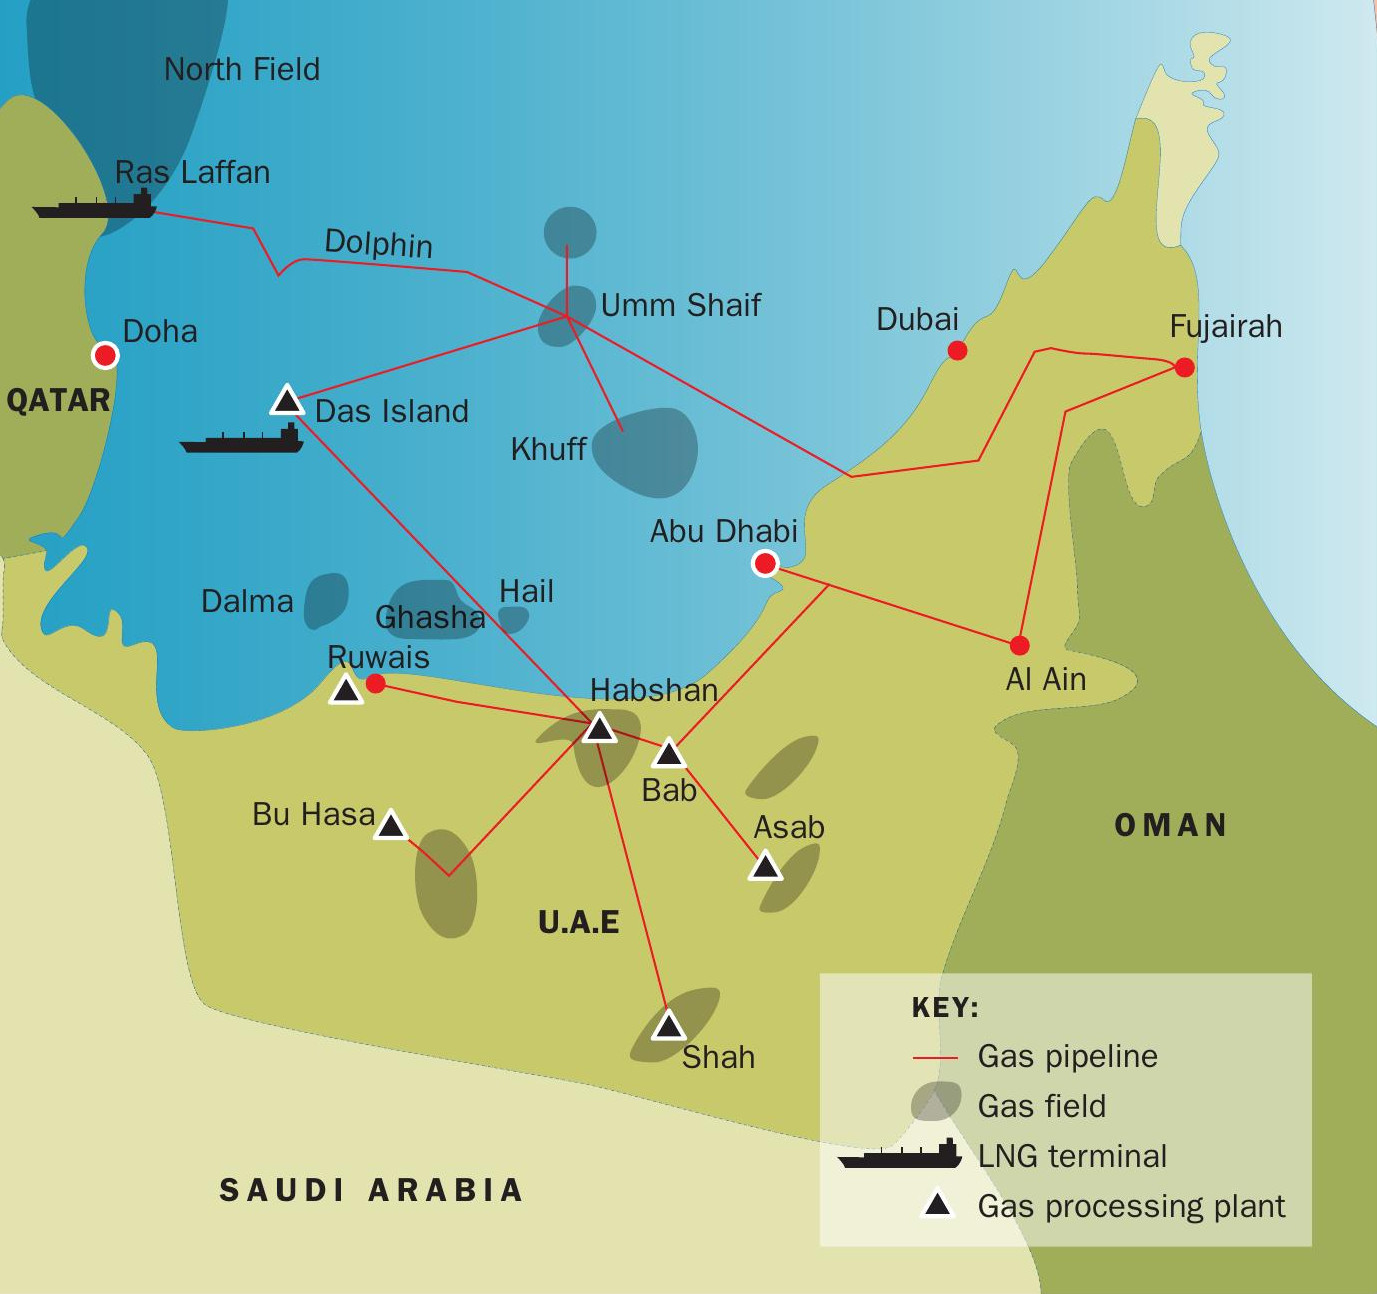
The warning comes as the Strait of Hormuz — the world’s most critical oil chokepoint, normally carrying roughly 20–21 million barrels per day (mbpd) of crude and petroleum products, or about 20–25% of global maritime oil trade — remains effectively closed or reduced to a trickle since late February/early March 2026 amid the ongoing U.S.-Israel-Iran conflict. Gulf producers have already cut output by at least 10 mbpd, with JP Morgan previously estimating supply cuts approaching 12 mbpd as tanker traffic halts and storage fills.
Running the Numbers: Supply Shock and Price Scenarios
Normal baseline: ~20 mbpd through Hormuz (EIA/IEA historical data pre-conflict).
Current reality: Flows plunged to near-zero for most exporters; limited bypass pipelines (e.g., Saudi Red Sea route ~5–7 mbpd max, but now at risk from broader regional tensions).
Effective shortfall: Analysts estimate 10–16+ mbpd trapped or shut-in initially, far larger than any prior crisis (1970s embargoes or 1990 Gulf War). Strategic reserves can only offset ~1.2–1.4 mbpd temporarily — covering just 7–10% of the gap.
Inventory runway: Gulf storage is limited; analysts note that roughly 25 days before forced further production cuts accelerate.
JP Morgan base-case scenario (as of their April 2 note): The disruption resolves through negotiations after a period of strain and global inventory drawdowns. Prices stay elevated above $100/bbl through Q2 2026 before retracing in H2 as flows partially reopen and inventories normalize.
Upside risk ($150+): Prolonged closure into mid-May triggers physical scarcity that forces demand destruction via high prices, potentially tipping regions into recession. Physical market signals already show this stress (see analysis below).
Brent vs. WTI: Diverging ExposuresBrent (global seaborne benchmark): More directly exposed to Middle East supply risk. It has rallied sharply but remains the “canary” for Hormuz shocks. Recent trading: ~$109/bbl (April 2 close), with intra-day spikes above $110–112. Brent is the one JP Morgan and Kasman reference for the $150 scenario.
WTI (U.S. domestic benchmark): Less directly tied to seaborne Gulf crude but pulled higher by global sentiment. Recent trading: ~$111.50/bbl (May contract), occasionally trading at a premium to Brent amid U.S. shale dynamics and basis shifts. The spread has narrowed or inverted at times as U.S. prices reflect broader inflation fears rather than pure import exposure.
In short, Brent carries the bigger geopolitical risk premium, while WTI benefits from domestic supply resilience but still follows the global rally.
Delivered (Physical) Cost vs. Paper (Futures) Market: The Real Disconnect
This is where the crisis looks far more severe than headline futures suggest. “Paper” prices (Brent/WTI futures) reflect financial trading and expectations of eventual resolution. “Physical” or “delivered” prices reflect what refiners actually pay for real barrels today — including logistics, insurance, and scarcity premiums.
Recent market data shows a massive $30–$40+ gap:Dated Brent (physical benchmark) has traded as high as $141 while futures hovered near $107.
Middle East physical grades (Oman, Dubai, Murban) have topped $162 in some reports, with Dubai physical up dramatically more than paper equivalents (one analysis showed Dubai physical at ~$126+ vs. lower futures).
Asian buyers (the primary destination for Gulf crude) are paying the steepest delivered premiums due to rerouting and war-risk insurance.
This physical/paper dislocation signals real scarcity working its way through the supply chain — cargoes already en route are drying up, forcing refiners to bid aggressively for remaining barrels or alternatives. JP Morgan and other analysts note Asia is feeling the squeeze first, with shortages spreading westward through April.
Outlook and Risks
If the Strait reopens soon via negotiations, the base-case retracement could bring relief by late 2026. But every extra week of closure compounds inventory draws, forces deeper production cuts, and raises the odds of $150+ Brent — and the accompanying demand destruction and economic pain.
Energy News Beat will continue monitoring tanker flows, physical differentials, and official updates from OPEC+, the IEA, and the U.S. Energy Information Administration. The physical market is already flashing red; futures may soon have no choice but to catch up.
Appendix: Sources and Links
All links accessed/verified as of April 3, 2026.
- Reuters – “J.P. Morgan warns oil could top $150 if disruptions persist into mid-May” (April 2, 2026): https://www.reuters.com/business/energy/jp-morgan-warns-oil-could-top-150-if-disruptions-persist-into-midmay-2026-04-02/
- The Times – Kasman comments on $150 scenario: https://www.thetimes.com/business/companies-markets/article/oil-150-a-barrel-strait-of-hormuz-iran-war-dtl7xwb8h
- OilPrice.com – “JP Morgan Sees $150 Oil if Hormuz Remains Closed Through Mid-May”: https://oilprice.com/Latest-Energy-News/World-News/JP-Morgan-Sees-150-Oil-if-Hormuz-Remains-Closed-Through-Mid-May.html
- IEA Oil Market Report – March 2026 (Hormuz flow data): https://www.iea.org/reports/oil-market-report-march-2026
- EIA data on Strait of Hormuz volumes (historical baseline): Referenced via multiple reports including Britannica and Forbes analyses.
- Physical vs. paper premium reporting: Various analyst notes and Reuters columns (e.g., Dubai/Oman premiums $34–$40+ over futures).
- Current price snapshots (April 2–3, 2026): Barchart, CME Group, Trading Economics, OilPrice.com futures data.
Energy News Beat – Independent. Fact-based. No hype. Stay tuned for updates.