


Europe stands at a crossroads in its energy landscape, grappling with soaring electricity costs, ambitious net-zero targets, and the harsh realities of deindustrialization. Once the cradle of the Industrial Revolution, the continent now faces an energy crisis that threatens to undermine its economic foundations. High energy prices, driven by volatile fossil fuel markets, the war in Ukraine, and a rushed transition to renewables, have accelerated factory closures, job losses, and sluggish GDP growth. This article examines seven key nations—Germany, France, Italy, Spain, Poland, the Netherlands, and the United Kingdom—focusing on their electricity costs, energy mixes, net zero policies, signs of deindustrialization, and GDP trends over the past five years (2021-2025, based on available data up to 2025 estimates).
The Energy Realities Team will be covering this on Monday Morning. Irina Slav, Tammy Nemeth, David Blackmon and Stu Turley. The Live YouTube link is below.
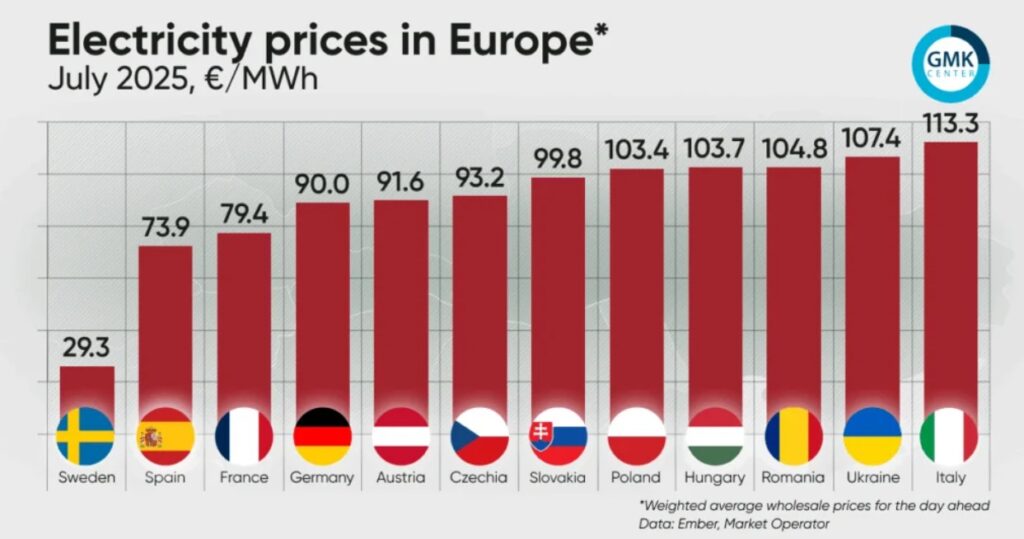
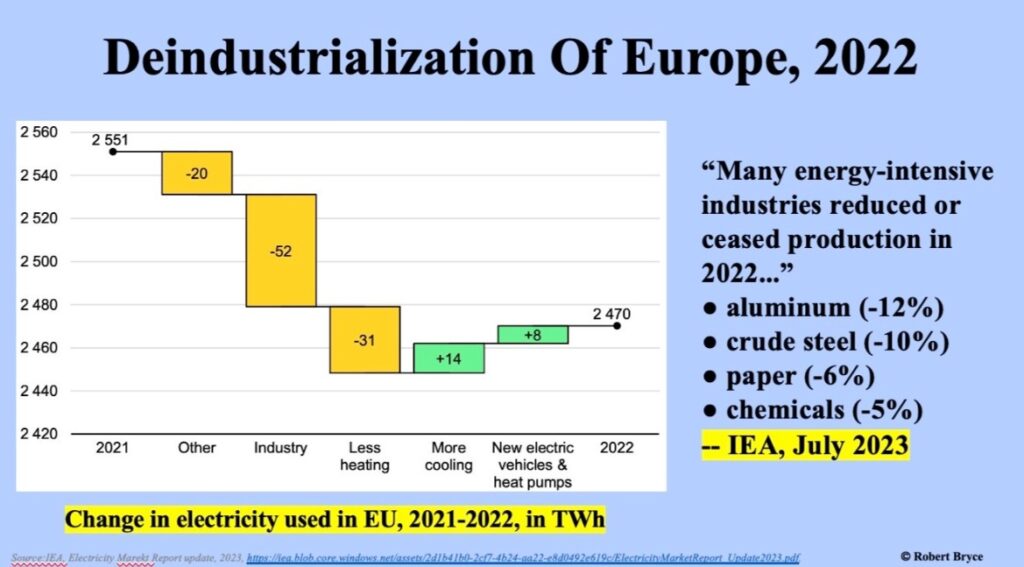
While renewables have surged, providing nearly half of Europe’s electricity in 2025, the intermittent nature of wind and solar has led to price volatility and reliance on expensive imports. Negative electricity prices occurred in 3.3% of hours in 2025, yet spikes above €150/MWh hit 9.3% of hours. This instability, coupled with decarbonization mandates, has fueled deindustrialization, with industrial output plummeting 5.8% in the year ending November 2023. Europe’s share of global industry is projected to drop from 12.2% in 2023 to just over 10% by 2050, as production shifts to Asia and the US.
Germany: The Sick Man of Europe
Germany, Europe’s largest economy, exemplifies the energy crunch. Household electricity prices averaged €0.3835 per kWh in the first half of 2025, the highest in the EU, driven by the Energiewende’s focus on renewables and nuclear phase-out.Energy Mix: In 2025, renewables accounted for about 50% of electricity (wind 17%, solar 13%), with gas at 16%, coal at 10%, and nuclear phased out entirely by 2023. Overall primary energy production relies on imports for 70% of needs.
Net Zero Policies: Committed to EU’s 2050 net zero target, with a national goal of 2045. Policies include phasing out coal by 2030 and heavy subsidies for renewables, but critics argue they’ve increased costs without sufficient baseload power.
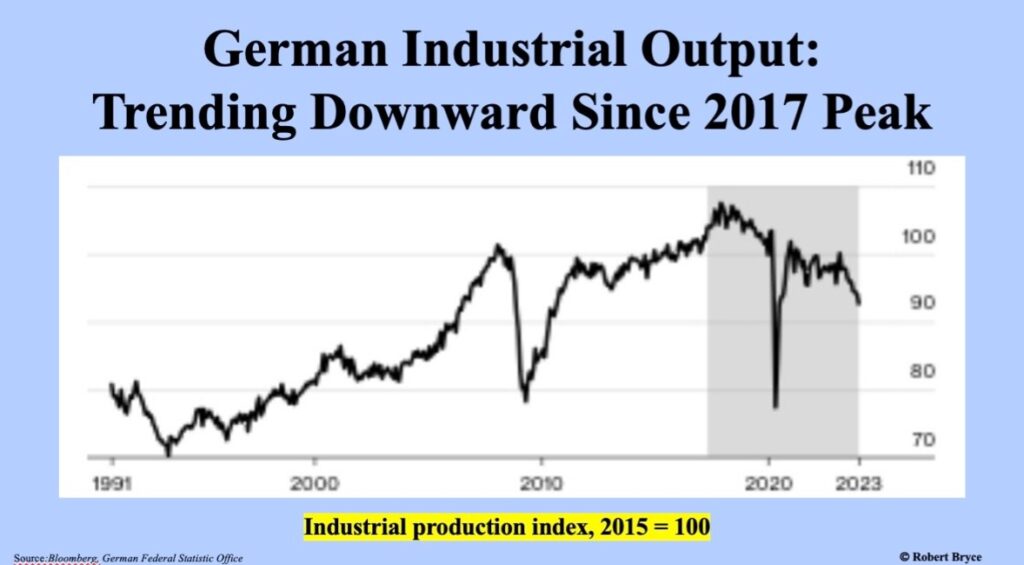
Deindustrialization: Manufacturing output has trended downward since 2017, with energy-intensive sectors like chemicals (-5%) and steel (-10%) hit hard. BASF and other firms have relocated production to the US and Asia due to costs 2-4 times higher than in America.
GDP Trends: Over the last five years, GDP growth slowed dramatically: 6.3% in 2021 (post-COVID rebound), 1.8% in 2022, -0.3% in 2023, 0.2% in 2024, and an estimated 0.3% in 2025. Cumulative growth: ~8%, lagging the EU average.
Italy: High Costs and Import Dependency
Italy’s household electricity prices hit €0.3291 per kWh in 2025, exacerbated by gas reliance amid reduced Russian supplies.
* Energy Mix: Gas dominates at 35% of primary energy, renewables at 20% (solar leading), hydro 10%. Electricity: 13% solar, 17% wind, 29% gas.
* Net Zero Policies: Aligned with EU 2050, targeting 55% emissions cut by 2030 via renewables expansion and efficiency measures.
* Deindustrialization: Industrial output down 8.7% in capital goods; paper and chemicals sectors contracted 6-5%. Relocations to lower-cost regions have accelerated.
* GDP Trends: 7% in 2021, 3.7% in 2022, 0.9% in 2023, 0.7% in 2024, ~0.9% in 2025. Cumulative: ~13%, but debt burdens amplify energy risks.
Spain: Renewable Leader with Volatility
Spain’s prices were €0.261 per kWh, below EU average, bolstered by solar growth.
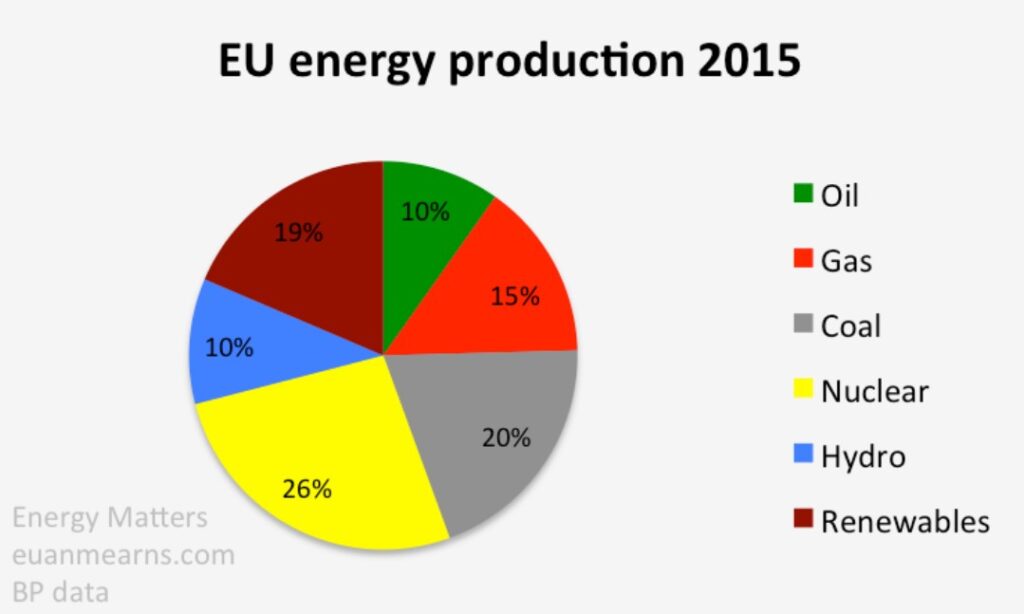
Energy Mix: Renewables 43% (solar 37% of RES), gas 20%, nuclear 10%. Primary: 37% oil, 20% gas, 19% renewables.
Net Zero Policies: EU 2050, with national 2030 target of 42% renewables in energy mix.
Deindustrialization: Negative prices doubled in 2025 due to solar surplus; aluminum and steel output fell 12-10%. Some recovery via green investments.
GDP Trends: 5.5% in 2021, 5.5% in 2022, 2.5% in 2023, 2.4% in 2024, ~2.5% in 2025. Cumulative: ~18%, strongest among peers.
Poland: Coal Legacy and Transition Pains
Prices at €0.104 per kWh (low due to subsidies), but industrial rates high.
Energy Mix: Coal 67% of production, renewables 19%, gas 15%. Electricity: Wind and solar rising to 30%.
Net Zero Policies: EU 2050, but resistant; aims for coal phase-out by 2049.
Deindustrialization: Coal decline led to job losses; chemicals and steel down 5-10%. Eastern regions hit hardest.
GDP Trends: 6.9% in 2021, 5.3% in 2022, 0.2% in 2023, 3.1% in 2024, ~3.5% in 2025. Cumulative: ~19%, driven by EU funds.
Netherlands: Gas Hub Turning Green
Prices €0.30 per kWh, impacted by Groningen field closure.
Energy Mix: Gas 41%, renewables 19%, oil 30%. Electricity: Wind 20%, solar 13%.
Net Zero Policies: EU 2050, national 2030 55% cut via offshore wind.
Deindustrialization: Chemicals (-5%), paper (-6%); Tata Steel cuts jobs.
GDP Trends: 4.9% in 2021, 4.3% in 2022, 0.1% in 2023, 0.6% in 2024, ~1.0% in 2025. Cumulative: ~11%.
United Kingdom: Post-Brexit Energy Woes
UK prices at ~€0.35 per kWh, highest industrial in Europe.
Energy Mix: Renewables 47% (wind 17%), gas 28%, nuclear 11%.
Net Zero Policies: Legally binding 2050 target, with 78% cut by 2035.
Deindustrialization: Tata Steel closures cost 2,800 jobs; output down 5.8%.
GDP Trends: 7.6% in 2021, 4.3% in 2022, 0.1% in 2023, 0.6% in 2024, ~1.3% in 2025. Cumulative: ~14%
Conclusion: Averting the Implosion
Europe’s energy policies have delivered renewable growth but at the cost of competitiveness. Deindustrialization risks millions of jobs and further GDP stagnation, with cumulative growth averaging 12-15% over five years across these nations—far below pre-crisis levels. To reverse this, balanced approaches integrating nuclear, gas, and grid upgrades are essential, lest the continent’s industrial heart fade.
We will update this article after the live podcast Monday Morning.
Get your CEO on the podcast: https://sandstoneassetmgmt.com/media/
Is oil and gas right for your portfolio? https://sandstoneassetmgmt.com/invest-in-oil-and-gas/


