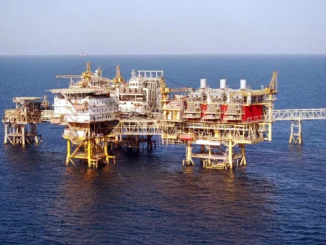
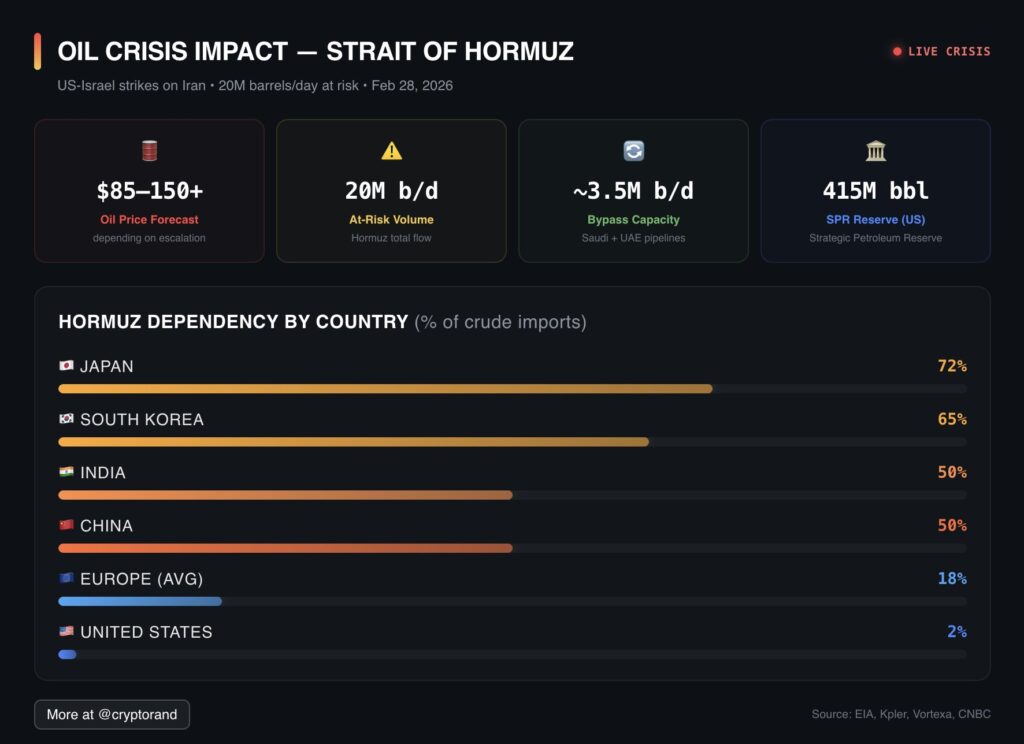
The Strait of Hormuz, a narrow waterway connecting the Persian Gulf to the Gulf of Oman, remains one of the world’s most vital energy arteries. In 2024, approximately 20 million barrels per day (b/d) of crude oil, condensate, and petroleum products transited this chokepoint, representing about 20% of global petroleum liquids consumption.
Additionally, around one-fifth of global liquefied natural gas (LNG) trade passed through it, primarily from Qatar and the United Arab Emirates (UAE).
With escalating geopolitical tensions in the region, including U.S.-Iran conflicts, the risk of disruptions—such as halted tanker insurance certificates—looms large. This article examines country-level dependencies on Hormuz for oil, oil products, and LNG imports, highlighting vulnerabilities and potential impacts from a prolonged closure exceeding a few weeks.
Oil Dependency by Country
The bulk of oil flowing through Hormuz originates from major producers like Saudi Arabia (38% of flows), Iraq, Kuwait, the UAE, Iran, and Qatar.
In 2024, an estimated 84% of crude oil and condensate transiting the strait headed to Asian markets.
China, India, Japan, and South Korea alone accounted for 69% of these flows, underscoring Asia’s heavy reliance.
The Japanese government has stated that they have 254 days of oil reserves.
If the Strait of Hormuz is closed for an extended period due to the ongoing war, it will be a very serious problem for Japan’s economy.pic.twitter.com/0zFq8epuU1 https://t.co/iriPGG3wQY— Jeffrey J. Hall 🇯🇵🇺🇸 (@mrjeffu) March 2, 2026
Here’s a breakdown of key countries’ import dependencies on oil transiting Hormuz (based on 2024-2025 data, as percentages of total crude oil imports):
|
Country
|
Dependency on Hormuz Oil (% of Imports)
|
Key Notes
|
|---|---|---|
|
Japan
|
~75%
|
Relies heavily on Middle East Gulf (MEG) suppliers like Saudi Arabia and UAE. aljazeera.com
|
|
South Korea
|
~60%
|
Significant imports from Iraq, Kuwait, and Saudi Arabia. aljazeera.com
|
|
India
|
~50%
|
Over half of crude imports pass through Hormuz, mainly from Iraq (21% of total imports), Saudi Arabia (5%), and UAE (4%). theprint.in
|
|
China
|
~45-50%
|
Nearly half of daily crude imports (about 5 million b/d) come via Hormuz from MEG producers. top-center.org
|
|
European Nations
|
~10-20% (varies by country)
|
Imports have shifted post-Russia sanctions, but still reliant on MEG for some volumes. wionews.com
|
|
United States
|
~7-8% (of total imports); 2% of consumption
|
Minimal overall; imports ~0.5 million b/d from Persian Gulf. eia.gov
|
These figures highlight Asia’s vulnerability: Four countries (China, India, Japan, South Korea) absorb 75% of Hormuz oil flows.
Alternatives like pipelines bypassing Hormuz (e.g., Saudi Arabia’s Yanbu line or UAE’s Fujairah) offer limited spare capacity—only about 2.6 million b/d regionally.
Oil Products Dependency by Country
Refined oil products (e.g., diesel, jet fuel, gasoline) also transit Hormuz, with the MEG accounting for 13.6% of global seaborne clean petroleum products (CPP) and 14.5% of dirty petroleum products (DPP).
Disruptions could affect petrochemical feedstocks, bunker fuels, and diesel supplies.
Key dependencies:
Asia (OECD and Southeast): Primary recipients of MEG CPP and DPP. China and India are major importers of NGLs (propane, butane) from Qatar, UAE, and Iran.
Jet fuel and diesel premiums have already spiked in Asia amid concerns.
Europe: Substitutes Russian diesel with MEG volumes; a cutoff would strain supplies to Italy, Belgium, and Poland.
United States: Imports some DPP as residues, replacing Russian supplies since 2022. However, overall dependency is low, at ~2-3% of product imports.
MEG also exports significant methanol (35% of global seaborne) to East Asia and Northwest Europe, amplifying risks for chemical industries.
LNG Dependency by Country
LNG flows through Hormuz totaled ~10 Bcf/d in 2024, with Qatar exporting 9.3 Bcf/d and the UAE 0.7 Bcf/d.
About 83% went to Asia.
Qatar dominates, supplying ~20% of global LNG trade via the strait.
Import dependencies (as % of total LNG imports):
|
Country
|
Dependency on Hormuz LNG (% of Imports)
|
Key Notes
|
|---|---|---|
|
China
|
~25-30%
|
Top destination; relies on Qatar for a quarter of imports. ainvest.com
|
|
India
|
~20-25%
|
Significant Qatari volumes; could face inflation spikes. ainvest.com
|
|
South Korea
|
~15-20%
|
Imports from Qatar and UAE. lngindustry.com
|
|
Japan
|
~10-15%
|
Diversified but still exposed to Qatari supplies. pemedianetwork.com
|
|
Europe (e.g., Italy, Belgium, Poland)
|
~10% overall; up to 60% for some
|
13% of 2024 EU LNG from Qatar/UAE; higher for specific countries. ieefa.org
|
|
United States
|
Negligible
|
Net exporter; minimal imports from MEG. zerocarbon-analytics.org
|
Asia accounts for 59% of Hormuz LNG flows, with China, India, and South Korea taking 52%.
Kuwait and Bahrain import ~60% of their LNG via Hormuz.
Who Gets Hurt the Most in a Prolonged Disruption?A closure lasting more than a few weeks, especially if tanker insurance certificates are halted, would cripple transit: Tankers would avoid the strait, leading to supply shortages and price surges.
Energy prices could “shoot up massively,” reminiscent of 1970s shocks.
Japan, China, and India: These nations would suffer the most. Japan’s 75% oil dependency and India’s 50% could trigger economic slowdowns, higher inflation, and energy rationing.
China’s 5 million b/d via Hormuz represents a massive vulnerability, potentially forcing a pivot to costlier alternatives like U.S. or Russian supplies.
LNG disruptions would exacerbate power and industrial shortfalls.
South Korea and Europe: High exposure (60% for SKorea oil) could strain manufacturing and heating; Europe might see 10% LNG cuts, hitting gas-dependent economies.
United States: Minimal impact overall, with only 2% of consumption tied to Hormuz.
However, this 2% disproportionately affects California. The state’s refineries import ~30% of crude from the Middle East (Iraq 21%, Saudi 5%, UAE 4%), geared for heavier MEG crudes.
A disruption could raise West Coast fuel prices, though U.S. shale production and Canadian imports provide buffers.
In summary, Asia bears the brunt of Hormuz risks, while the U.S. enjoys relative insulation—except for regional pockets like California. Diversification, stockpiles, and bypass infrastructure are critical, but a multi-week halt could reshape global energy dynamics for months. As tensions persist into 2026, monitoring insurance and shipping trends will be key for energy stakeholders.
Sources: energy.ca.gov, eia.gov, cnbc.com, bloomberg.com
Get your CEO on the #1 Energy Podcast in the United States: https://sandstoneassetmgmt.com/media/
Is oil and gas right for your portfolio? https://energynewsbeat.co/invest/