


Fewer quits and historically low layoffs & discharges mean fewer job openings, and less hiring to fill them. The massive pandemic churn slowed. But that’s only part of it.
By Wolf Richter for WOLF STREET.
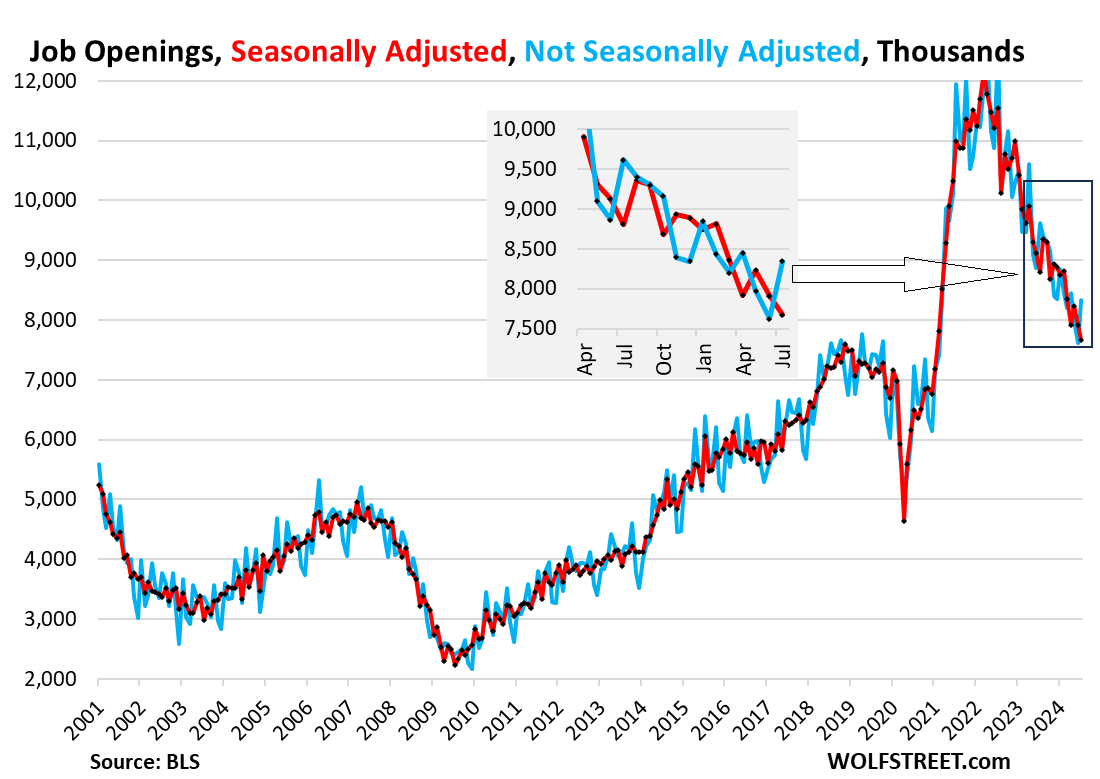
Not seasonally adjusted, the number of job openings in July jumped by 720,000 to 8.34 million, according to data released today by the Bureau of Labor Statistics. Job openings typically jump in July: Last year, they jumped by 750,000; in July 2019, they jumped by only 250,000; in July 2018, they jumped by only 414,000. So the July jump this year was fairly hefty compared to the last two prepandemic years (blue line in the chart below).
But seasonal adjustments that attempt to iron out this seasonality slashed the seasonally adjusted job openings by 668,000 to 7.67 million (red). The insert shows the details back to April 2023.
Beyond the month-to-month seasonality, we can see the trend: Job openings have come down from the crazy period of the labor shortages but remain well above the prepandemic levels in the data going back to 2001. So are job openings now normalizing? What even is normal? We’ll look at those questions in a moment.
This data is based on surveys of about 21,000 work sites, released today by the BLS as part of its Job Openings and Labor Turnover Survey (JOLTS).
What is normal?
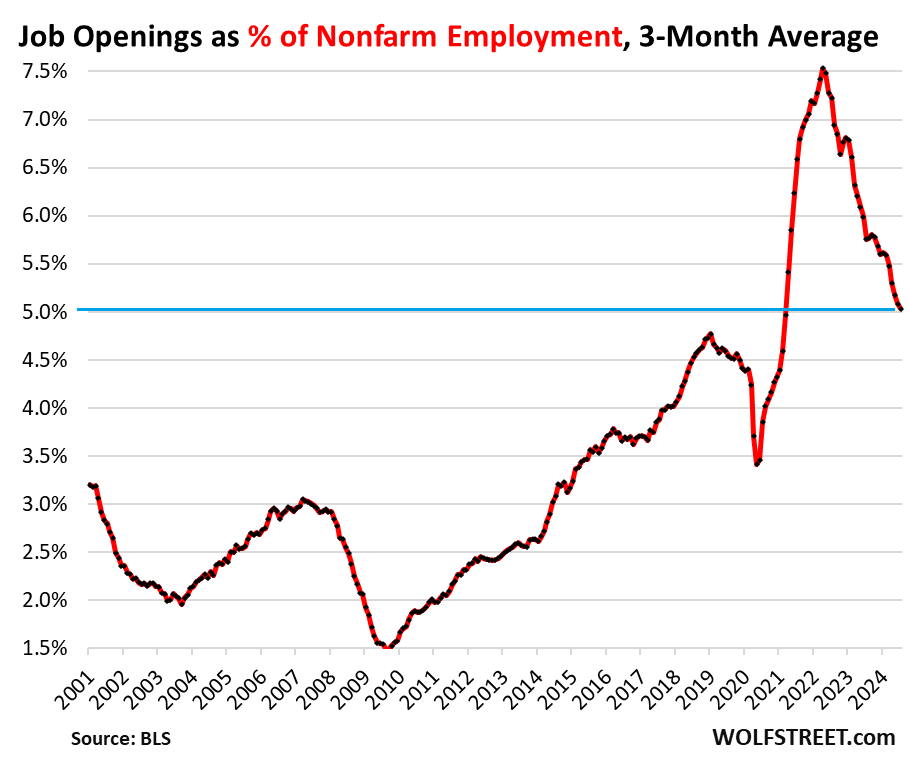
The ratio of job openings to nonfarm employment takes into account the growth of employment over the years. As the population, the labor force, and employment grow over the years, job openings should also grow with them. The ratio of job openings to nonfarm employment shows this relationship.
On a seasonally adjusted basis, job openings as a percentage of nonfarm employment dipped to 4.9%, which still higher than the highest point during the strong labor market in late 2018, and far higher than any period beyond that going back to 2001.
The three-month average, which irons out some of the month-to-month squiggles, dipped to 5.0%, well above all prepandemic levels. This perspective shows that the labor shortages are mostly gone, but that the labor market remains relatively tight compared to prepandemic normal:
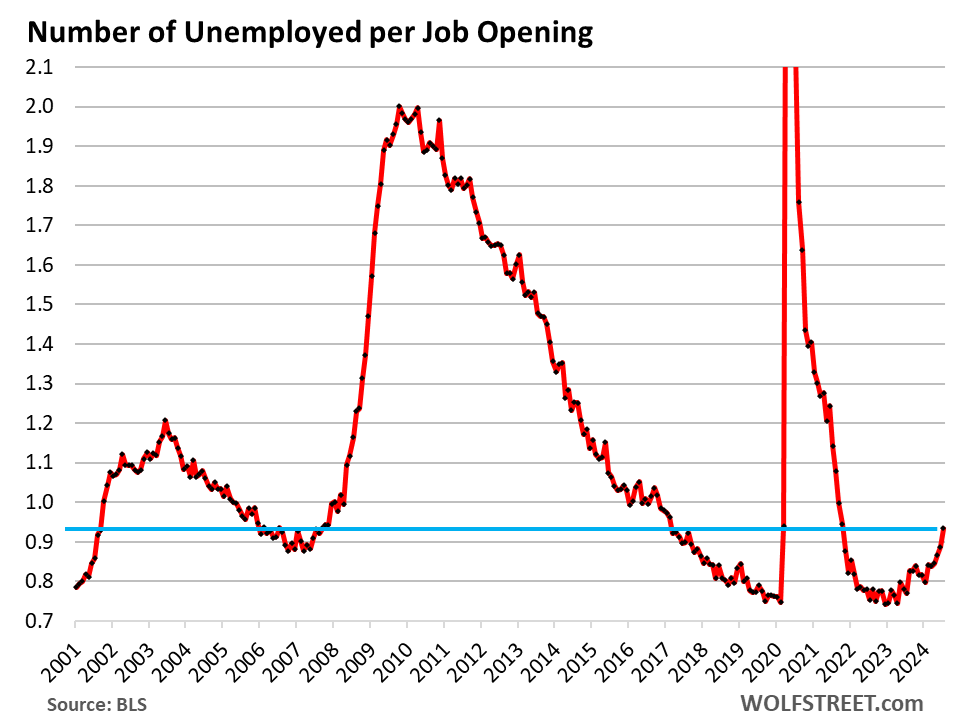
The number of unemployed persons per job opening is a ratio that Powell mentions a lot in his press conferences as one of the indicators of labor market tightness, meaning the supply of labor in relationship to jobs.
The number of unemployed persons includes the portion of the well over 6 million immigrants that came to the US in 2022 through 2024 (Congressional Budget Office data) that are looking for work but haven’t found work yet, and therefore count as unemployed.
This massive influx of immigrants has caused the number of unemployed to increase though layoffs and discharges remain historically low, as we’ll see in a moment.
In the jobs report for July, there were 7.16 million unemployed looking for work, while in today’s JOLTS data, there were 7.67 million job openings in July (both seasonally adjusted), so 0.93 unemployed persons looking for a job for each job opening.
From this perspective, which includes the large number of immigrants still looking for work, the labor market is looser (bigger supply of labor) than it had been during the relatively tight labor market in 2018 and 2019:
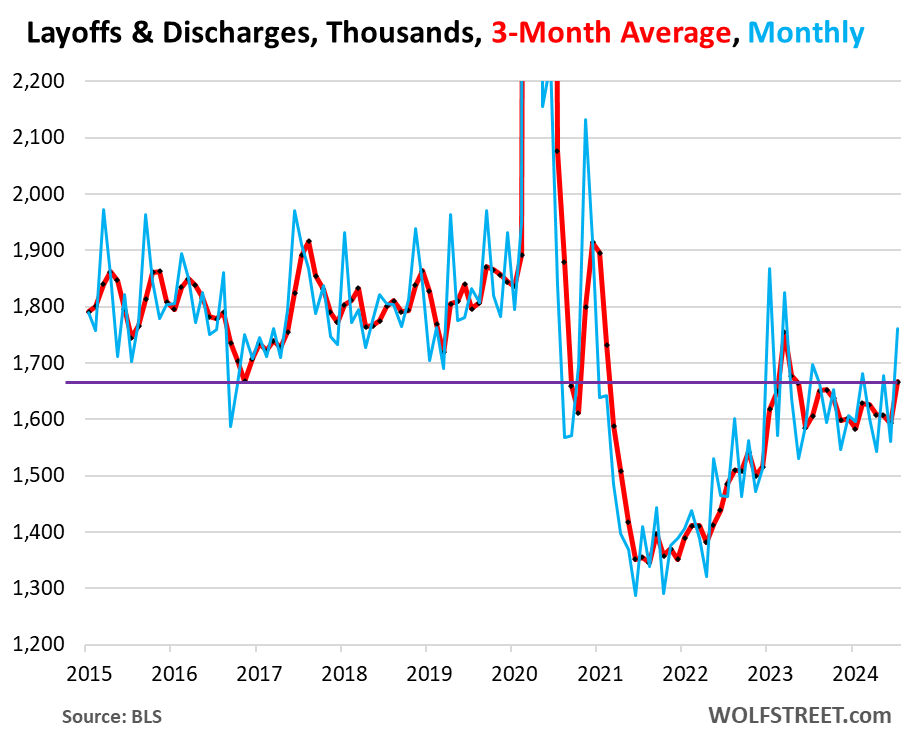
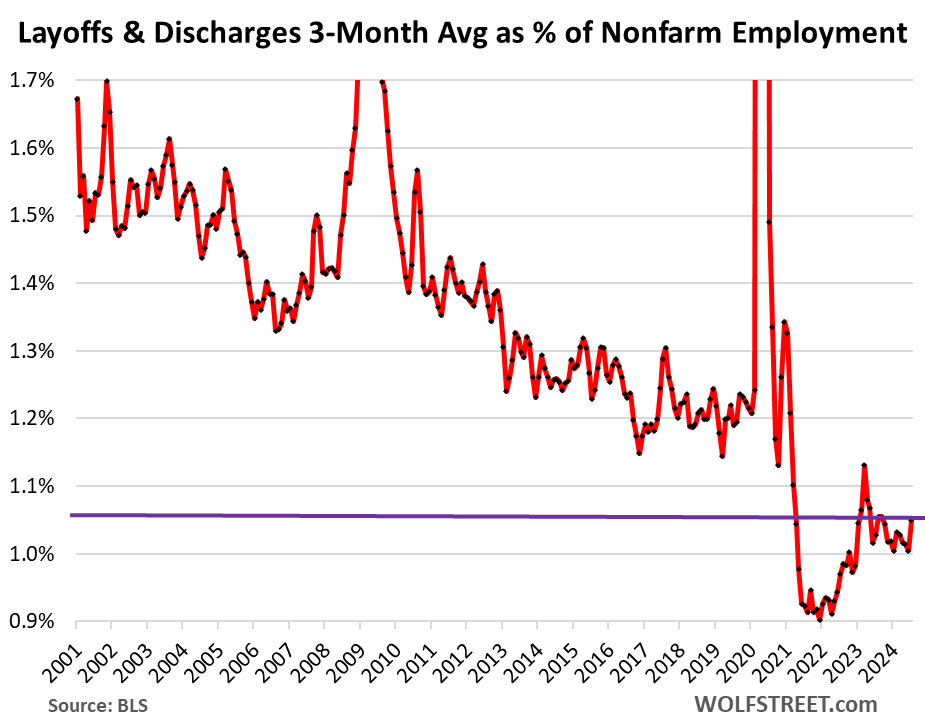
Layoffs and discharges jumped to 1.76 million in July after having dropped sharply in June. This is very volatile data with big month-to-month squiggles. The three-month average irons out some of the squiggles. It rose to 1.67 million, still in the same range it has been in since early 2023, and below the low points of the prepandemic years.
The initial unemployment insurance claims reported by the Labor Department have shown a similar situation: Despite some breathless headlines about layoff announcements globally, there have been fewer layoffs and discharges than during the Good Times before the pandemic.
Layoffs and discharges in relationship to nonfarm employment is a ratio that accounts for growing employment over the years.
From that perspective, layoffs and discharges are still far below normal (to iron out some of the big month-to-month squiggles, we use the three-month average of layoffs and discharges).
This is a sign that employers are hanging on to their workers. Some economists have speculated that employers are “hoarding” workers because they got burned with the labor shortages after their mass-layoffs during the pandemic when they couldn’t rehire the people that they’d let go. If true, that would be a good thing. Maybe employers learned something.
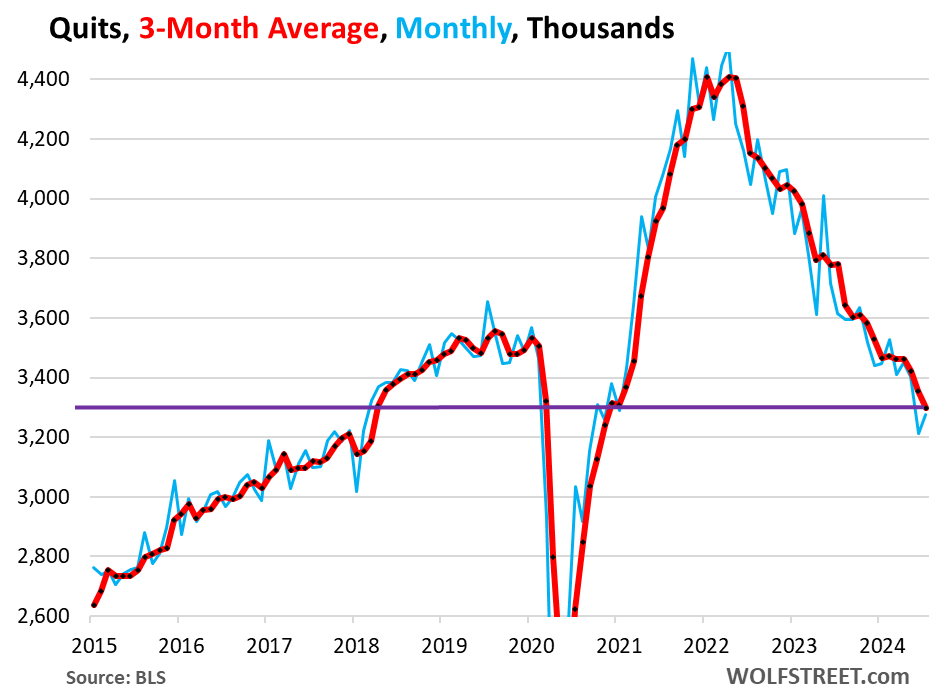
And workers quit quitting. Voluntary quits ticked up to 3.28 million in July. The three-month average dipped to 3.30 million, well below the levels of 2018 and 2019.
After the huge churn during the pandemic, when workers jumped jobs and industries to improve their pay and working conditions, it seems they have settled in.
Fewer voluntary quits and historically low layoffs and discharges mean fewer job openings to fill, which means less hiring, and less competition for labor. The massive churn during the pandemic is over, that’s for sure.
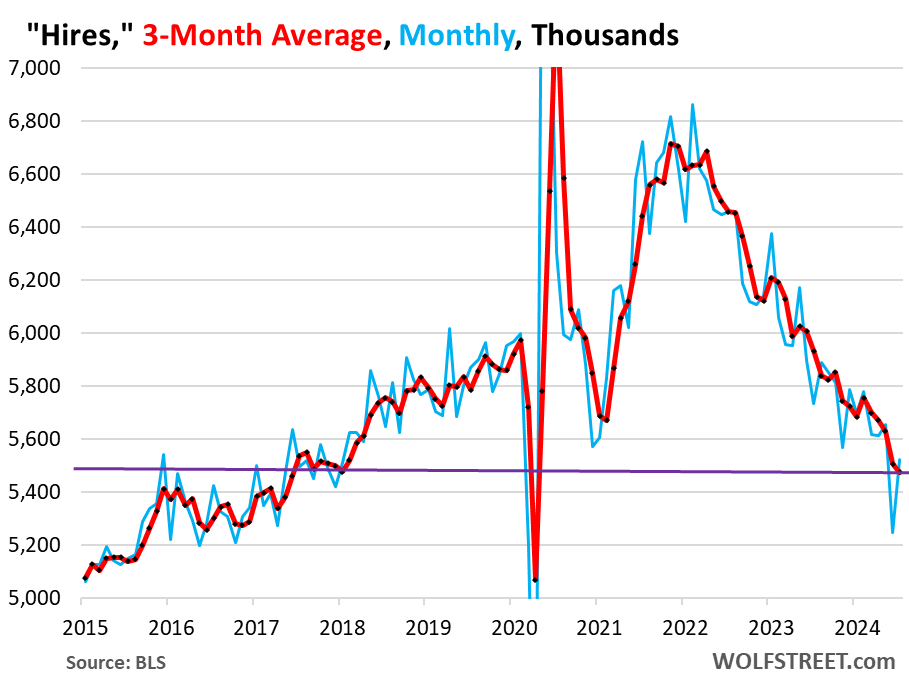
Hires jumped to 5.52 million in July, seasonally adjusted, after the drop in June. The three-month average inched down to 5.47 million.
So let’s repeat: Fewer voluntary quits and historically low layoffs and discharges – as employers cling to their workers – mean fewer job openings to fill, which means less hiring. And that’s part of what we’re seeing here.
The other part we’re seeing here is that the economy now creates jobs at a slower rate than in heady days of 2022 and 2023, and there are fewer new jobs to fill.
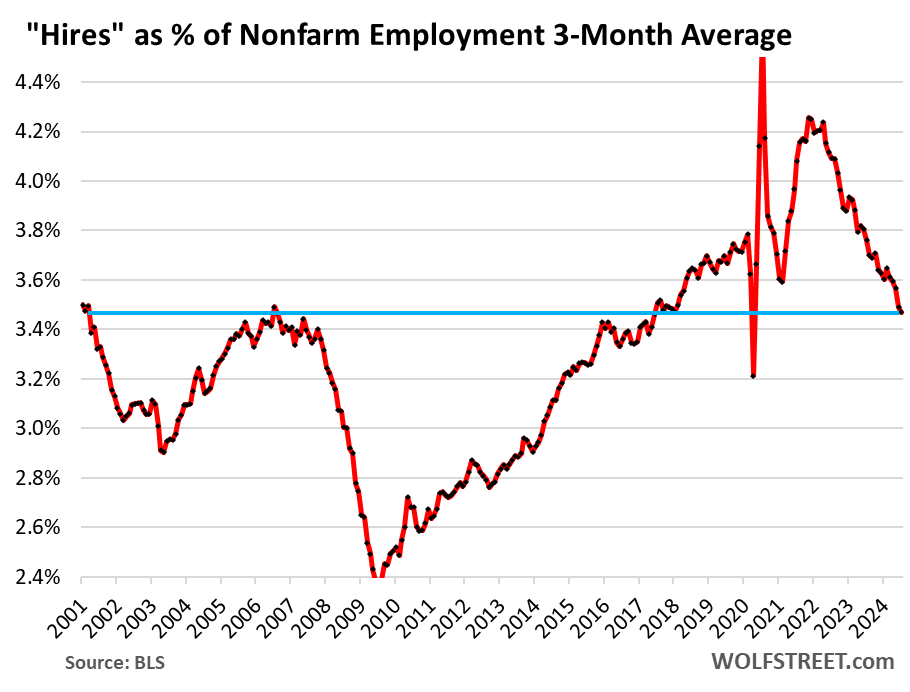
Hires in relationship to nonfarm payrolls has declined below 2018-2019 levels, which were considered tight labor market conditions, but remain well above nearly all months in the prior period going back to 2001. Is this level of hiring in relationship to payrolls historically “normal?” Maybe.
Take the Survey at https://survey.energynewsbeat.com/


