


In a resounding affirmation of the liquefied natural gas (LNG) market’s resilience and growth, global LNG shipments soared to a historic high of 34.59 million metric tons (Mt) in September 2025, marking a 3.7% increase year-over-year.
This surge underscores the sector’s pivotal role in meeting escalating energy demands, particularly as Europe ramps up winter preparations amid constrained pipeline supplies. Non-Gas Exporting Countries Forum (non-GECF) producers, led by the United States, drove much of the growth, offsetting declines from traditional heavyweights like Russia and Algeria.
As the world hurtles toward a projected 5.5% annual increase in LNG supply through 2025, September’s figures signal a bullish trajectory for the remainder of the year.
Top Exporters: U.S. Leads the Charge with Record Volumes
The United States cemented its position as the world’s premier LNG exporter in September, shipping a staggering 9.4 Mt—eclipsing the prior monthly record of 9.3 Mt set just a month earlier in August.
Louisiana terminals accounted for 61% of these outflows, highlighting the Gulf Coast’s dominance in the global supply chain.
This performance contributed to a quarterly total of 28.0 Mt for Q3 2025, far outpacing competitors and reflecting robust production from facilities like Cheniere’s Sabine Pass and Corpus Christi, as well as Venture Global’s Plaquemines LNG ramp-up. Globally, non-GECF exporters collectively dispatched 19.36 Mt in September, a 14% year-over-year leap that more than compensated for a 6.3% dip among GECF members (15.17 Mt total).
Australia’s volumes softened due to scheduled maintenance at key plants like APLNG and Ichthys, but the country still clocked 18.7 Mt for the quarter. Qatar bucked the GECF trend with a notable uptick, shipping 20.8 Mt across Q3.
Here’s a snapshot of the top LNG exporters based on Q3 2025 volumes, with September’s U.S. record providing context for monthly peaks:
|
Rank
|
Country
|
Q3 2025 Volume (Mt)
|
Key September Notes
|
|---|---|---|---|
|
1
|
United States
|
28.0
|
Record 9.4 Mt; 61% from Louisiana
|
|
2
|
Qatar
|
20.8
|
Strong growth offsetting GECF declines
|
|
3
|
Australia
|
18.7
|
Maintenance impacted monthly flows
|
|
4
|
Russia
|
7.2
|
Declines to EU amid sanctions
|
|
5
|
Malaysia
|
6.1
|
Steady Asian hub contributions
|
|
6
|
Nigeria
|
3.3
|
GECF volume drop year-over-year
|
|
7
|
Oman
|
3.0
|
Emerging Middle East player
|
|
8
|
Indonesia
|
4.4
|
Regional supply boost
|
|
9
|
Algeria
|
1.6
|
Sharp GECF decline
|
|
10
|
Trinidad & Tobago
|
2.5
|
Caribbean consistency
|
Data sourced from Seala AI Q3 analysis; U.S. September figure from EIA and industry reports.
These figures illustrate a shifting landscape: The U.S. now commands over 25% of global exports on a quarterly basis, while GECF nations grapple with geopolitical headwinds and maintenance cycles.
Top Purchasing Countries: Europe Surges, Asia Holds Steady
On the demand side, September’s record was propelled by a voracious European appetite, with the continent importing 8.95 Mt—a 40% year-over-year explosion.
This spike, equivalent to roughly 25% of global volumes, stems from diminished Russian pipeline gas flows and proactive storage refills ahead of winter. The EU and UK combined absorbed 24.6 Mt in Q3, with the Netherlands, France, and Spain leading sub-regional intakes. Asia remained the bedrock of LNG demand, with China accounting for 17.1 Mt in Q3 (nearing a quarter of global volumes for the year) and showing a 37% month-on-month surge in Russian LNG imports in September alone.
Japan and South Korea followed closely, prioritizing LNG for power generation amid nuclear phase-outs and seasonal needs. Emerging markets like India (5.4 Mt quarterly) added upward pressure, diversifying away from pricier spot purchases.
Top importers for Q3 2025, contextualized with September’s European surge:
|
Rank
|
Country/Region
|
Q3 2025 Volume (Mt)
|
Key September Notes
|
|---|---|---|---|
|
1
|
EU + UK (aggregate)
|
24.6
|
8.95 Mt surge; storage refill focus
|
|
2
|
China (mainland)
|
17.1
|
Russian imports up 37% m-o-m
|
|
3
|
Japan
|
15.6
|
Steady baseload demand
|
|
4
|
South Korea
|
11.8
|
Power sector reliance
|
|
5
|
India
|
5.4
|
Diversification from spot market
|
|
6
|
Taiwan
|
5.6
|
Tech/energy mix boost
|
|
7
|
Egypt
|
3.5
|
Regional re-export hub
|
|
8
|
Thailand
|
2.3
|
Southeast Asia growth
|
|
9
|
Bangladesh
|
2.1
|
Infrastructure-driven imports
|
|
10
|
Pakistan
|
1.9
|
Seasonal power needs
|
Midstream players echoed this optimism. Kinder Morgan (NYSE: KMI) posted Q3 adjusted EPS up 16% and EBITDA growth of 6%, attributing gains to natural gas expansions and LNG-linked acquisitions like Outrigger—positioning it for sustained fee-based revenues.
Energy Transfer (NYSE: ET) anticipates 3.85% EPS growth in Q3, accelerating to 25.58% in Q4, fueled by its vast pipeline network feeding Gulf Coast terminals.
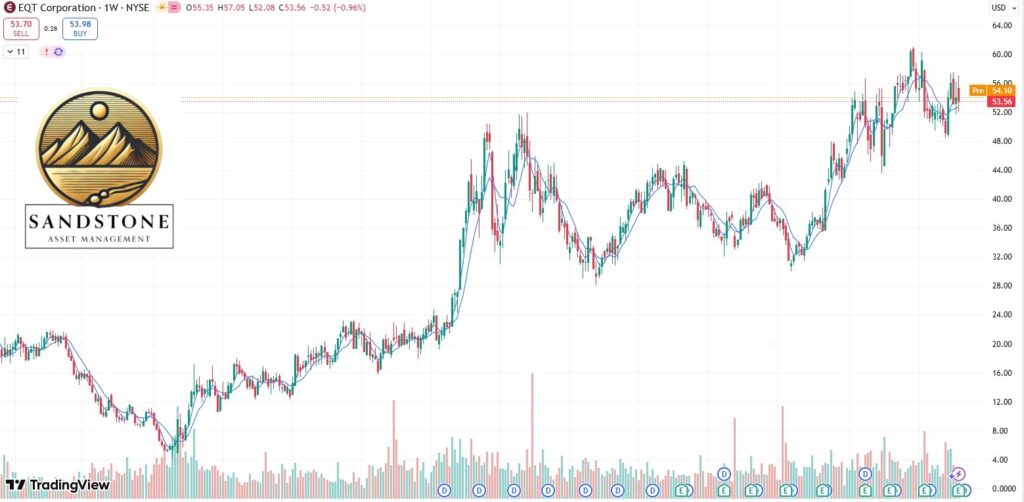
EQT Corporation (NYSE: EQT), a key upstream supplier, reported Q3 sales volumes of 634 Bcfe near guidance highs, signaling ample feedstock for exporters.
Looking to Q4, the outlook is incandescent. The U.S. Energy Information Administration (EIA) projects LNG exports averaging 14.7 billion cubic feet per day (Bcf/d) for full-year 2025—up from 11.9 Bcf/d in 2024—climbing further to 16.3 Bcf/d in 2026 as new capacity online.
A looming winter cold snap could propel Henry Hub prices to $3.70–$4.10/MMBtu, enhancing margins for exporters like Cheniere and boosting midstream throughput.
Permian production surges (9 Bcf/d growth through 2032) will further insulate supply chains against volatility.
For U.S. firms, September’s record isn’t an anomaly—it’s a harbinger. With Europe restocking and Asia’s thirst unquenched, Q4 could deliver blockbuster earnings, solidifying America’s LNG supremacy and rewarding shareholders with dividends and buybacks. As Cheniere’s expansions come online, the “Golden Age” of U.S. LNG shows no signs of cooling.
Energy News Beat: Powering insights for the energy addition.
Got Questions on investing in oil and gas? Or do you have a Tax Burden in 2025?
Crude Oil, LNG, Jet Fuel price quote
ENB Top News
ENB
Energy Dashboard
ENB Podcast
ENB Substack