


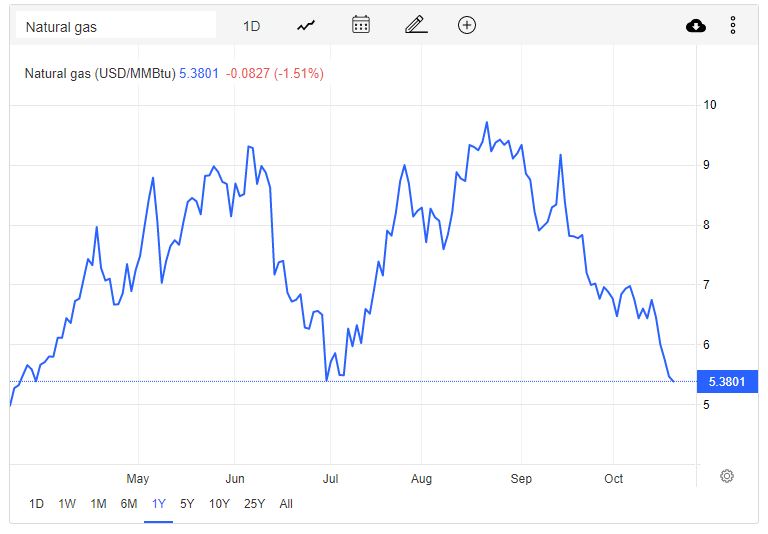
US natural gas futures dropped for the fifth straight session to $5.3/MMBtu, the lowest in seven months, after the latest EIA report showed another larger-than-usual storage build. US utilities added a more than expected 111 billion cubic feet (bcf) of natural gas to storage last week, well above a build of 91 bcf during the same week a year ago and a five-year (2017-2021) average increase of 73 bcf. Natural gas prices have been under pressure amid forecasts of lower weather-driven demand, record domestic production levels and reduced liquefied natural gas (LNG) exports, allowing utilities to inject more gas into storage. Average US gas demand, including exports, is expected to fall to 94.9 bcfd next week from 100.3 bcfd this week.
Natural gas
Natural gas accounts for almost a quarter of United States energy consumption. The NYMEX Division natural gas futures contract is widely used as a national benchmark price. The futures contract trades in units of 10,000 million British thermal units (mmBtu). The price is based on delivery at the Henry Hub in Louisiana, the nexus of 16 intra- and interstate natural gas pipeline systems that draw supplies from the region’s prolific gas deposits. The United States is the biggest natural gas producer followed by Russia. The Natural gas market prices displayed in Trading Economics are based on over-the-counter (OTC) and contract for difference (CFD) financial instruments. Our Natural gas market prices are intended to provide you with a reference only, rather than as a basis for making trading decisions. Trading Economics does not verify any data and disclaims any obligation to do so.
| Actual | Previous | Highest | Lowest | Dates | Unit | Frequency | ||
|---|---|---|---|---|---|---|---|---|
| 5.35 | 5.46 | 15.78 | 1.04 | 1990 – 2022 | USD/MMBtu | Daily |