The game of inflation Whack-A-Mole: price pressures shifted from housing to non-housing services and core goods.
By Wolf Richter for WOLF STREET.
Just briefly here because it’s an interesting twist by the New York Fed on Friday’s PCE inflation reading: it nixes the idea that year-over-year PCE inflation is cooling.
Back in April 2022, when the Fed’s favored inflation measure, the PCE price index, was surging towards its June 2022 high of 7.2% year-over-year, researchers at the New York Fed came out with a new inflation measure that’s based on the data in the PCE price index, but tries to show inflation’s “persistence.” They did this by aggregating the PCE components differently. And they called it Multivariate Core Trend inflation (MCT inflation).
The idea was perhaps to show that inflation wasn’t quite as bad beneath the surface, and that it was less persistent and on its way out, as for most of the time since its invention, MCT inflation has run well below the core and headline PCE price indices.
Today, they released the MCT for January. Oh boy! The PCE price index for January was released on Friday. What the media jumped on was that year-over-year inflation readings cooled a little. What I pointed out was that the month-to-month increase, the three-month increase, and the six-month increase all showed the worst inflation since the spring of 2024, after accelerating relentlessly for months, but that the massive base-effect in services cooled the year-over-year increases in services, and thereby in the core PCE price index and the headline PCE price index (my discussion of PCE inflation for January).
So now here is the MCT for January, which attempts to show “persistence” of inflation, using the same underlying data but dividing it up differently. “Persistence” has become a huge concept after “transitory” was retired by Powell himself.
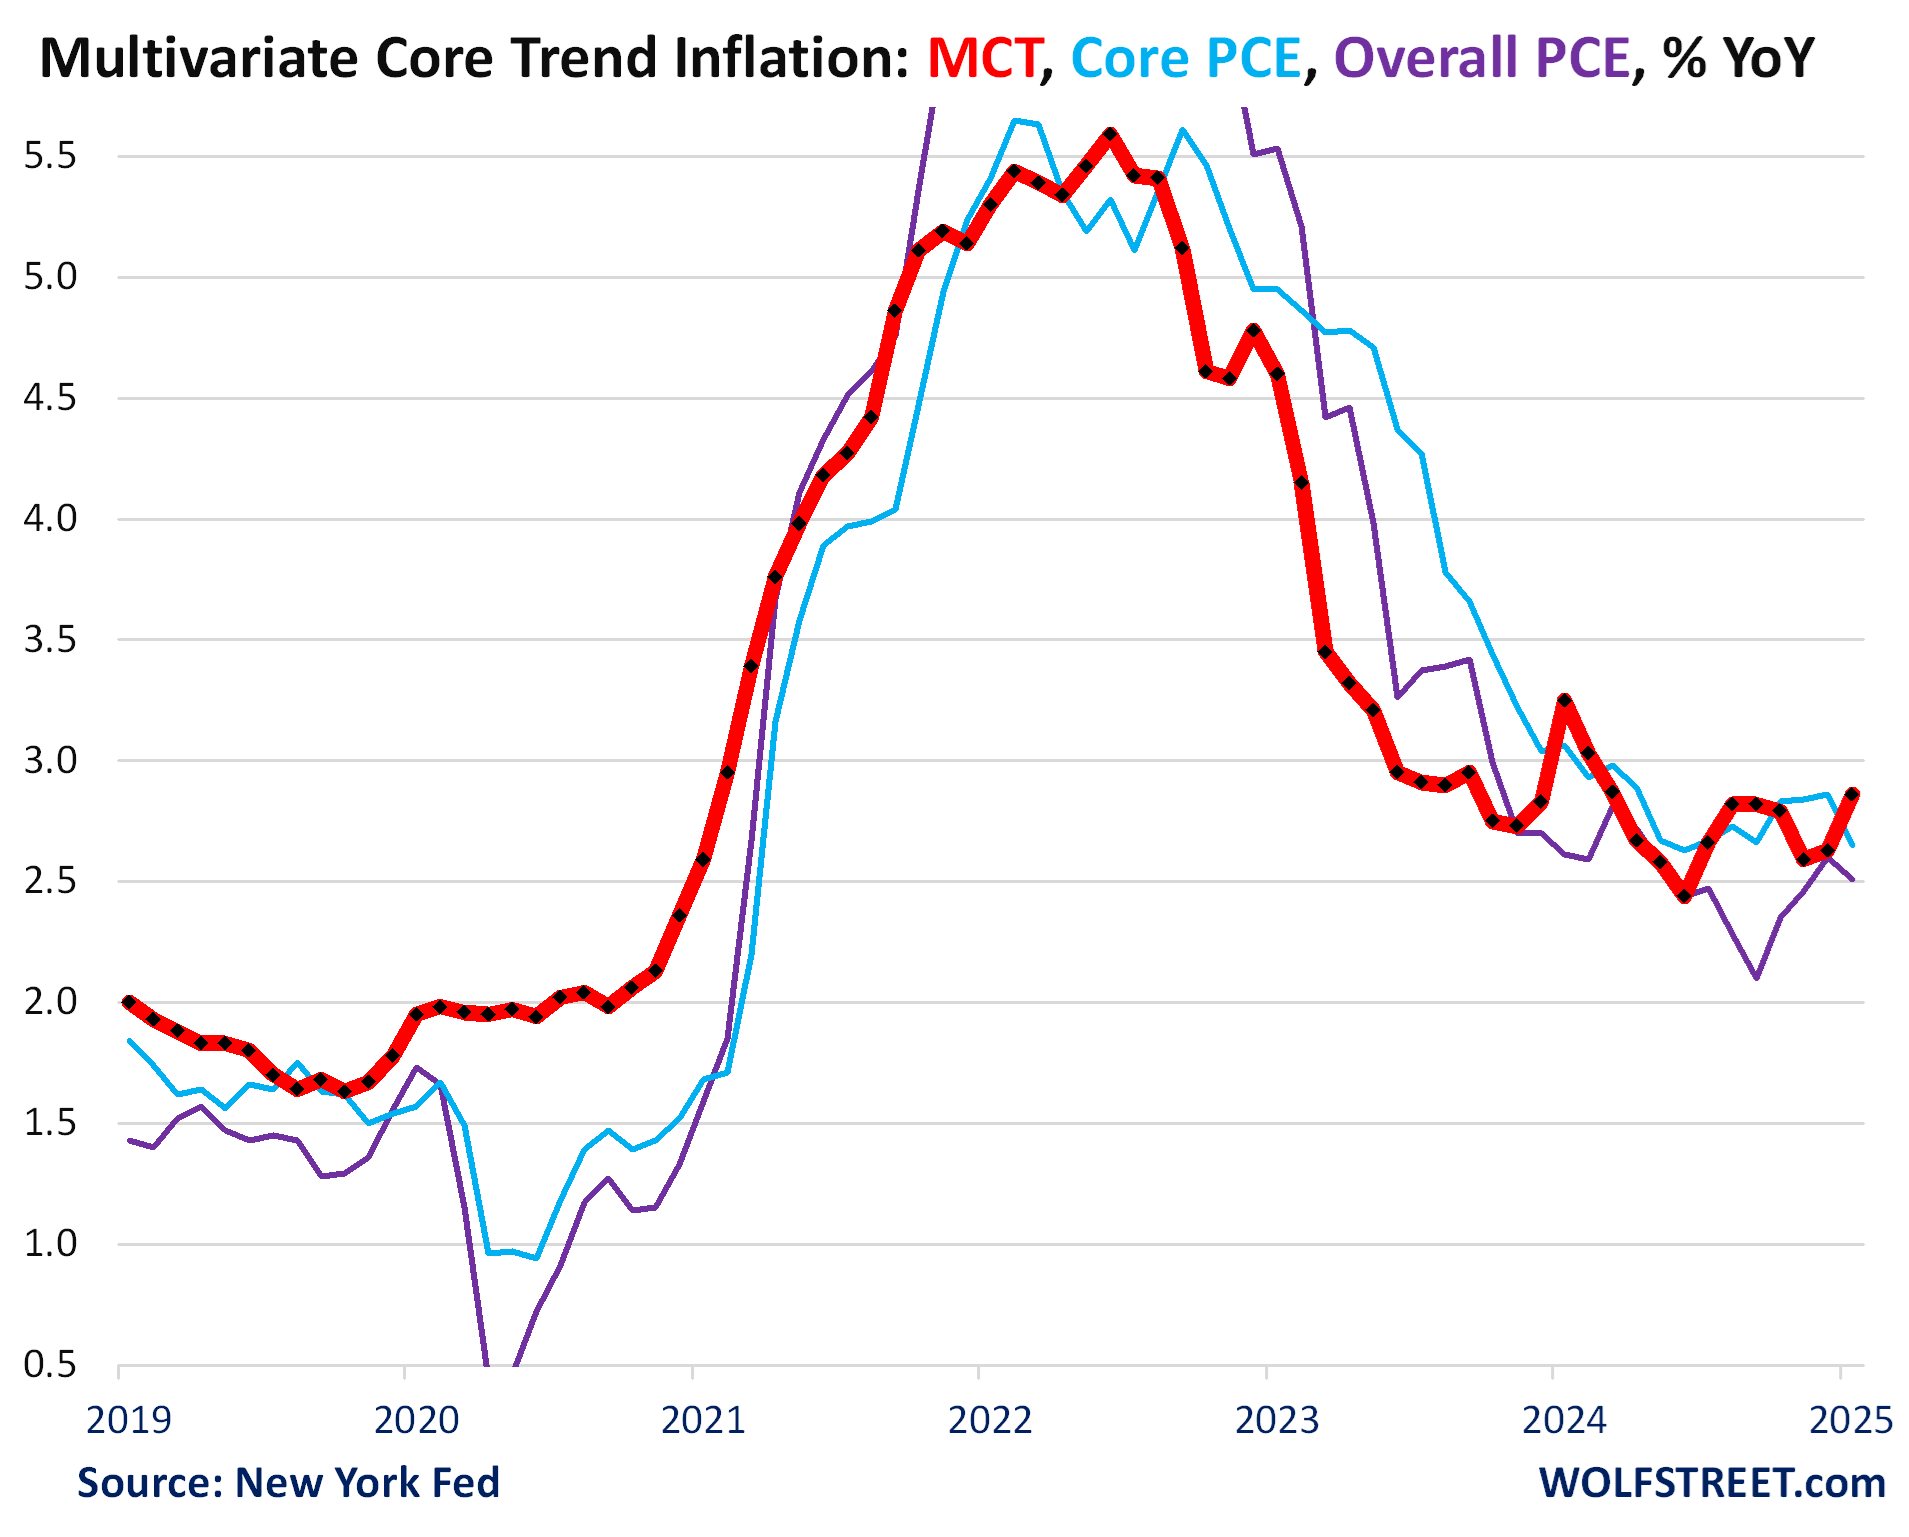
The year-over-year MCT accelerated to 2.86% in January, from 2.63% in December, the worst increase since March 2024 (red), driven largely by “services ex-housing” and to a lesser extent by “core goods” (excluding food and energy goods).
In other words, housing is no longer the driver of this inflation at the moment. In this game of inflation Whack-A-Mole, price pressures have shifted to non-housing services, and to core goods.
Also shown in the chart are Friday’s figures: The headline PCE price index decelerated to +2.51% (purple) and core PCE price index decelerated to 2.65% (light blue).
We give you energy news and help invest in energy projects too, click here to learn more