


In the volatile world of global energy markets, OPEC+—the alliance of oil-producing nations led by Saudi Arabia and Russia—is pushing against its production boundaries. With spare capacity dwindling, the group finds itself in a precarious position where any major disruption could send crude prices soaring. As of October 2025, recent decisions to modestly increase output highlight the tightrope walk between stabilizing supply and avoiding a glut, all while geopolitical tensions simmer.
This vulnerability is amplified by ongoing conflicts and incidents that threaten energy infrastructure, raising alarms for consumers and economies worldwide.
Geopolitical Tensions Fueling Supply Risks
The energy sector is no stranger to geopolitical upheaval, but 2025 has seen an escalation that directly impacts oil supply chains. In the Russia-Ukraine conflict, both sides have targeted each other’s energy assets, creating ripple effects across global markets. Ukraine has intensified its drone strikes on Russian infrastructure, including a recent hit on the largest oil terminal in occupied Crimea, which sparked a massive fire and disrupted operations.
These attacks are accelerating, exacerbating Russia’s fuel crisis and potentially reducing its export capacity.
Conversely, Russia has bombarded Ukraine’s natural gas and power facilities, leaving thousands without electricity and threatening Europe’s energy security as winter approaches.
Closer to home, the United States faced its own shock with the massive explosion at Chevron’s El Segundo refinery in California on October 2, 2025. The blast, which originated in a jet fuel unit, led to a large fire that forced the facility offline.
This incident not only disrupted local fuel supplies but is expected to drive up gas prices in the region, underscoring how even domestic accidents can amplify global price pressures.
With refineries already operating near capacity, such events highlight the fragility of the supply chain. These disruptions come at a time when OPEC+ is already stretched thin. The group’s ability to ramp up production in response to crises is limited, potentially leaving markets exposed to sharp price spikes if demand surges or further supply issues arise.
OPEC+ Spare Capacity: Who’s Holding the Reserves?
Spare production capacity—the amount of oil that can be quickly brought online—is a critical buffer against market shocks. However, OPEC+’s collective spare capacity is shrinking rapidly, estimated at around 5.3 million barrels per day (mb/d) in recent assessments.
This buffer is disproportionately held by a few key members, with the bulk concentrated in the Middle East. Here’s a breakdown of the primary countries with meaningful spare capacity as of 2025:
|
Country
|
Estimated Spare Capacity (kb/d)
|
Notes
|
|---|---|---|
|
Saudi Arabia
|
3,100
|
Largest holder; can swing production significantly to stabilize markets. |
|
UAE
|
~1,000
|
Significant reserves, but focused on gradual unwinding of cuts. |
|
Iraq
|
~500
|
Limited but meaningful; ongoing compliance with quotas affects availability. oilprice.com
|
|
Kuwait
|
~300
|
Smaller share, part of Gulf concentration. energyintel.com
|
Other OPEC+ members, including Russia and smaller producers, have minimal to no spare capacity, meaning the alliance’s response to emergencies relies heavily on these few nations.
With OPEC+ planning modest output increases of 137,000 barrels per day in November, fears of an oversupply glut persist, but so does the risk of undersupply in a crisis.
Gold vs. Oil: A 10-Year ComparisonCommodities like gold and oil often move in tandem as hedges against inflation and geopolitical instability, but their ratio—the number of barrels of oil one ounce of gold can buy—provides insight into relative valuations. Over the last decade (2015-2025), the gold-to-oil ratio has shown significant volatility, reflecting oil price crashes, pandemics, and recent gold rallies.Historically, the ratio averages around 15-20, but the past 10 years have seen extremes.
In 2015-2016, amid an oil glut, the ratio climbed above 30 as oil prices plummeted below $30 per barrel while gold held steady around $1,200 per ounce.
The 2020 COVID-19 crisis pushed it to a peak over 100 briefly (due to negative oil prices), though annual averages hovered around 40-50.
Post-pandemic, the ratio dipped to lows near 10-15 in 2022 as oil rebounded above $100 per barrel amid the Ukraine invasion, making oil relatively expensive compared to gold.
By mid-2025, however, gold’s surge to over $4,000 per ounce—driven by inflation fears and safe-haven demand—has elevated the ratio to around 39.6, signaling that gold is historically overpriced relative to oil (currently near $102 per barrel).
This high ratio suggests potential for oil prices to catch up if supply tightens further.
|
Year Range
|
Approximate Average Ratio
|
Key Influences
|
|---|---|---|
|
2015-2017
|
25-35
|
Oil price crash; gold stable.
|
|
2018-2019
|
15-25
|
Oil recovery; trade tensions.
|
|
2020-2021
|
40-50
|
COVID oil plunge; gold rally.
|
|
2022-2023
|
10-20
|
Post-invasion oil spike.
|
|
2024-2025
|
30-40
|
Gold boom amid inflation; steady oil. |
From Josh Young at Bison Interests on X: @Josh_Young_1
We highly recommend following him on his Substack and X.
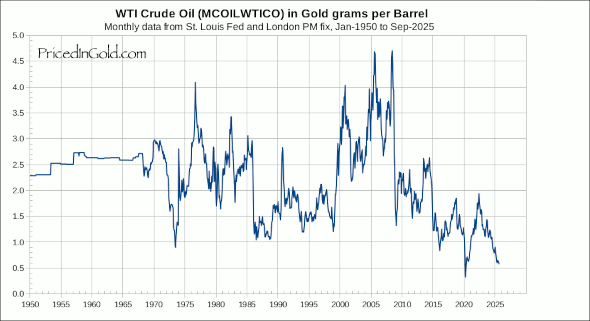

This comparison underscores oil’s sensitivity to supply disruptions, while gold acts as a longer-term store of value. As OPEC+ capacity tightens, watch for the ratio to shift if oil prices spike.
Outlook: A Precarious Balance
With OPEC+ nearing its limits and geopolitical flashpoints like the Russia-Ukraine war and U.S. refinery incidents in play, the stage is set for potential price volatility. Investors and policymakers should brace for scenarios where spare capacity proves insufficient, pushing crude higher. For now, the market’s fate hinges on these key players’ ability to navigate the storm.
Do you have a Tax Burden in 2025?
Crude Oil, LNG, Jet Fuel price quote
ENB Top News
ENB
Energy Dashboard
ENB Podcast
ENB Substack