

U.S. Rig Count Breakdown by Basin
The decline in U.S. rig activity is not uniform across all basins, with some regions holding steady while others see reductions. Here’s a detailed look at the week-on-week changes in key shale basins, as reported by Baker Hughes and industry sources:
- Permian Basin: The Permian, the most prolific oil-producing region in the U.S., remained unchanged at 265 active rigs. However, this figure is 40 rigs lower than the same time last year, signaling a cautious approach by operators amid price volatility.
- Eagle Ford: Drilling activity in the Eagle Ford also held steady at 41 active rigs, but this is seven rigs below last year’s count, reflecting a longer-term contraction in the basin.
- Williston Basin: The Williston Basin, encompassing the Bakken formation, reported no change at 30 active rigs. Specific year-over-year comparisons were not provided, but the basin’s stability suggests operators are maintaining minimal activity.
- Cana Woodford: This basin saw a notable decline, dropping three rigs to 17, indicating sensitivity to market conditions and reduced investment in less economically viable plays.
- DJ Niobrara: Activity remained flat at eight active rigs, with no significant shifts reported.
- Anadarko Basin: The Anadarko Basin lost one rig, contributing to the overall national decline.
- Other Basins: An additional rig was lost in unspecified basins, further dragging down the total count.
The split between oil and gas rigs also provides insight into the market dynamics. While the exact breakdown for this week was not detailed, earlier reports from June 27, 2025, indicated 432 oil rigs and 109 gas rigs nationally, with oil rigs down 47 year-over-year and gas rigs up 12. This suggests that while oil drilling is under pressure, gas drilling has seen some resilience, possibly due to export-driven demand for liquefied natural gas (LNG).
Global Rig Counts
Globally, rig counts reflect a mixed picture, with some regions increasing activity while others scale back, primarily driven by oil price trends and geopolitical factors. According to Baker Hughes’ international rig count data (as of June 2025, the latest comprehensive global figures available):
- Middle East: The region remains a stronghold for drilling, with countries like Saudi Arabia and the UAE maintaining high rig counts to support OPEC+ production strategies. Approximately 400 rigs were active, up slightly from last year due to efforts to regain market share.
- Latin America: Countries like Brazil and Colombia reported stable or slightly increased rig activity, with around 150 rigs active, driven by offshore and unconventional plays.
- Europe: Rig counts remained flat at roughly 100, with Norway and the UK focusing on offshore production but constrained by high costs and regulatory pressures.
- Asia-Pacific: Activity in China and India was steady at around 200 rigs combined, though tariff uncertainties could disrupt future investment.
- Africa: Rig counts hovered near 90, with Nigeria and Angola showing modest growth despite security and funding challenges.
The global rig count totaled approximately 1,800, a slight increase from 2024, reflecting OPEC+’s decision to ramp up production in 2025, which has put downward pressure on oil prices. However, the U.S. decline stands out against this backdrop, highlighting unique domestic challenges.
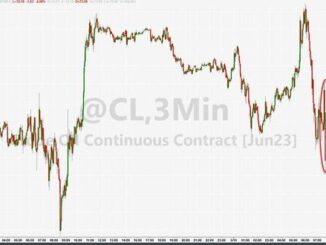
Oil Prices and Market ContextOn July 11, 2025, oil prices showed modest gains but remained volatile. The West Texas Intermediate (WTI) benchmark closed at $68.39 per barrel, up $1.82 (+2.73%) for the day, while Brent crude settled at $70.37, up $1.73 (+2.52%). Despite these daily increases, prices are well below the $70–$75 per barrel breakeven threshold for many Permian producers, as noted by the Dallas Fed Survey. This low-price environment, exacerbated by OPEC+’s surprise production hike in May 2025 and global economic slowdown fears, is a key driver of the U.S. rig count decline.
U.S. crude oil production also dipped for the second consecutive week, falling to 13.385 million barrels per day (bpd), down from a peak of 13.631 million bpd in December 2024. The Primary Vision Frac Spread Count, which tracks well completion crews, dropped to its lowest level in over four years, signaling reduced upstream activity.
Impact of a 500% Tariff on China and India
If the Tariff Is Imposed:
- Oil Price Collapse: A 500% tariff on two of the world’s largest oil importers would likely trigger a sharp decline in global oil demand. China, the world’s top crude oil importer, and India, a major refining hub, could face economic slowdowns, reducing their oil consumption. Previous tariff escalations in April 2025 led to a 15% drop in oil prices, with WTI briefly falling below $60 per barrel. A 500% tariff could push WTI to $50 or lower, a level at which nearly half of U.S. shale producers would significantly cut production, as per industry surveys.
- Global Market Turmoil: The tariffs would disrupt global supply chains, particularly for steel and aluminum used in drilling operations, raising costs for U.S. producers. China’s retaliatory tariffs (e.g., 34% on U.S. goods in April 2025) would further depress U.S. oil and LNG exports, undermining Trump’s “energy dominance” agenda. Global markets could see a sell-off in equities, with safe-haven assets like Treasury bonds gaining, as observed during earlier tariff shocks.
- U.S. Shale Industry Impact: With WTI prices potentially dropping below the $62–$65 breakeven for most shale producers, drilling activity would plummet further. The Permian Basin, already down 40 rigs year-over-year, could see additional rig losses, and smaller basins like the Eagle Ford and Cana Woodford might halt new projects entirely. Oilfield service companies would face consolidation or layoffs, as seen in prior price slumps.
- Geopolitical Repercussions: China and India might seek alternative oil suppliers, such as Russia or Middle Eastern producers, strengthening OPEC+’s market influence. This could exacerbate U.S. shale’s competitive disadvantage, especially as OPEC+ plans to add 411,000 bpd starting in May 2025.
If the Tariff Is Not Imposed:
- Price Stabilization: Avoiding the tariff would likely stabilize oil prices, with WTI potentially recovering to the $70–$75 range, closer to the breakeven for Permian producers. This would encourage modest rig count growth, particularly in the Permian, where operators have maintained activity despite recent declines.
- Market Confidence Boost: Global markets would likely rally, with reduced fears of a trade war-driven recession. U.S. oil exports to Asia, particularly LNG to India, would remain competitive, supporting production growth. Equity markets could see gains, and Treasury yields might rise as investors move away from safe-haven assets.
- U.S. Shale Resilience: Stable prices would allow U.S. shale producers to maintain or slightly increase drilling, potentially reversing the rig count decline in basins like the Eagle Ford or Williston. The industry’s focus on efficiency—producing more oil with fewer rigs—would continue to support record production levels, projected at 13.4 million bpd in 2025.
- Global Supply Dynamics: OPEC+’s production increase would still pressure prices, but without tariff-induced demand destruction, the market could absorb the additional supply. Middle East tensions, such as recent U.S. strikes on Iranian facilities, could further support prices if supply disruptions occur.
The Bottom Line
Sources: OilPrice.com, Baker Hughes, Energy Information Administration, Reuters, Newsweek, The New York Times, The Washington Post, ABC News, posts on X