


By Stuart Turley, Energy News Beat
January 31, 2026
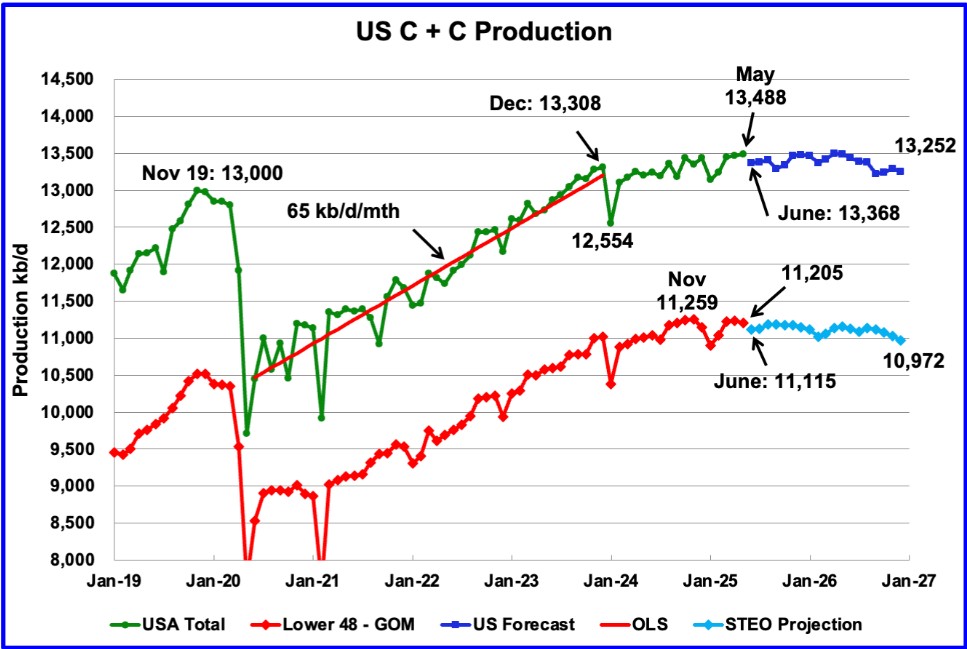
The latest Baker Hughes rig count report, released on January 30, 2026, shows a modest uptick in U.S. drilling activity with the total rig count climbing by 2 to 546. This marks a slight rebound from the previous week’s 544 rigs. However, the figure remains significantly lower year-over-year, down 36 rigs from the 582 active at the end of January 2025. This weekly gain comes amid fluctuating oil prices and ongoing market uncertainties, but the broader trend highlights a cautious approach by operators in response to economic signals and efficiency gains in shale plays.
Stu Turley and Michael Tanner will cover earnings for the key companies listed on the Energy News Beat Stand-Up. They will also review how the VectorVest analyst assesses their performance.
The breakdown by rig type reveals stability in oil-directed drilling, with oil rigs holding steady at 411. Gas rigs saw a gain of 3, reaching 125, while miscellaneous rigs dipped by 1 to 10. Oil rigs now account for about 75% of the total, gas for 23%, and miscellaneous for 2%. This distribution underscores the dominance of oil-focused activity, particularly in major shale basins, even as natural gas prices remain subdued.
Rig Count Breakdown by State
Drilling activity varies significantly across key producing states, with Texas continuing to lead despite recent fluctuations. Here’s a snapshot of the rig counts in major states based on the most recent data:
|
State
|
Rig Count (Jan 30, 2026)
|
Weekly Change
|
Year-Over-Year Change
|
|---|---|---|---|
|
Texas
|
229
|
+1
|
-48
|
|
New Mexico
|
102
|
0
|
0
|
|
Oklahoma
|
43
|
0
|
0
|
|
Louisiana
|
37
|
-2
|
+10
|
|
North Dakota
|
26
|
0
|
-6
|
|
Other States
|
109
|
+3
|
-2
|
Texas, home to the prolific Permian Basin, added a single rig but is down sharply from last year, reflecting consolidation and efficiency improvements among operators.
New Mexico held flat, while Louisiana saw a dip, possibly tied to seasonal factors in the Haynesville shale.
Rig Count by Major Oil Basins
The U.S. rig count is heavily concentrated in key shale basins, where technological advancements continue to drive productivity despite fewer rigs. The Permian Basin remains the epicenter of activity, but other regions show mixed trends:
|
Basin
|
Rig Count (Jan 30, 2026)
|
Weekly Change
|
Year-Over-Year Change
|
Primary Type
|
|---|---|---|---|---|
|
Permian
|
244
|
0
|
-60
|
Oil
|
|
Haynesville
|
42
|
0
|
+13
|
Gas
|
|
Eagle Ford
|
40
|
0
|
-4
|
Oil/Gas
|
|
Williston (Bakken)
|
28
|
0
|
-5
|
Oil
|
|
Marcellus
|
24
|
0
|
+1
|
Gas
|
|
Utica
|
15
|
0
|
N/A
|
Gas
|
|
DJ-Niobrara
|
7
|
-1
|
N/A
|
Oil/Gas
|
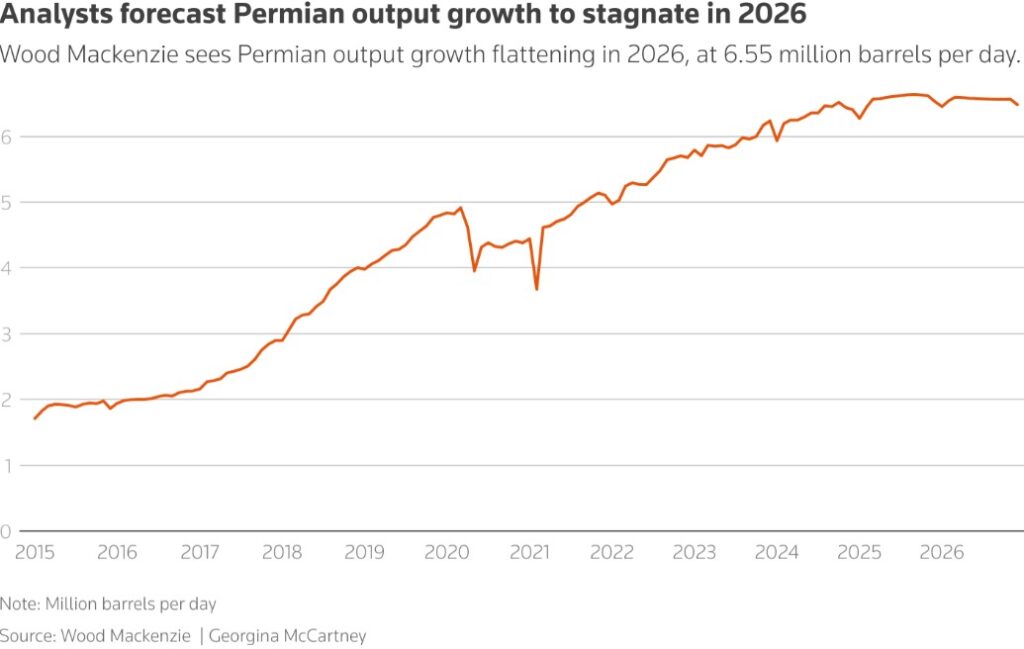
The Permian Basin, spanning Texas and New Mexico, accounts for nearly half of all U.S. rigs and is predominantly oil-focused.
Permian output is forecasted to stagnate around 6.55 million barrels per day in 2026, as shown in this chart:
Earnings Highlights from Oilfield Service and Exploration Companies This Week
Several key players in the oil and gas sector reported earnings this week, providing insights into operational performance amid higher oil prices. Here’s a list of notable companies with earnings calls between January 25-31, 2026, along with summaries:
Baker Hughes (Oilfield Services): Reported Q4 2025 results on January 26. The company achieved record full-year adjusted EBITDA of $4.825 billion, up 5% year-over-year, with margins expanding to 17.4%. Q4 revenue was $7.386 billion, flat year-over-year, but free cash flow hit a record $2.732 billion for the year. Strong orders in industrial and energy transition segments, including LNG and new energy, drove optimism. CEO Lorenzo Simonelli highlighted resilient margins despite macro headwinds.
National Fuel Gas (Exploration and Production): Q1 2026 earnings released January 28. GAAP earnings were $181.6 million ($1.98/share), with adjusted earnings of $187.7 million ($2.06/share), up 24% per share from last year. The beat was driven by higher production (up 10% to 104 Bcfe) and stronger realized prices. Reaffirmed fiscal 2026 adjusted EPS guidance of $7.60–$8.10, assuming $3.75/MMBtu NYMEX. The company noted robust Appalachian gas output and utility segment growth.
Murphy Oil (Exploration): Q4 2025 update and call on January 29. The company reported successful appraisal wells in Vietnam and discoveries in the Gulf of Mexico. Production averaged 185,000 BOE/d for the quarter, with onshore assets contributing 97,000 BOE/d. Adjusted net income was around $100 million, supported by higher oil realizations. CEO Roger Jenkins emphasized exploration momentum and debt reduction, targeting $1.3–$1.5 billion in capex for 2026.
ExxonMobil (Integrated Oil & Gas): Q4 2025 earnings on January 30. Revenue topped $90 billion, with adjusted EPS of $2.15, beating estimates. Upstream production hit 3.8 million BOE/d, driven by Permian growth. The company returned $8 billion to shareholders via dividends and buybacks. CEO Darren Woods cited strong refining margins and Guyana expansions as key drivers.
Chevron (Integrated Oil & Gas): Q4 2025 earnings on January 30. Adjusted EPS of $3.05 exceeded forecasts, with revenue at $50 billion. Production rose to 3.1 million BOE/d, bolstered by U.S. shale and international assets. Returned $7 billion to investors. CEO Mike Wirth highlighted cost efficiencies and the pending Hess acquisition, positioning for sustained growth.
Other mentions include SLB (Schlumberger), which reported on January 23 (just prior to this week) with Q4 revenue of $9.75 billion and a 25% dividend increase, committing over $4 billion in shareholder returns for 2026.
What Investors Should Look For Amid Higher Oil Prices
With WTI crude hovering around $75–$80 per barrel in early 2026—up from mid-2025 lows—investors should prioritize companies with low breakeven costs (under $50/bbl), strong free cash flow generation, and exposure to premium assets like the Permian. Focus on balance sheet strength to weather volatility, dividend yields (e.g., ExxonMobil’s 3.5%+), and ESG commitments, as regulatory pressures mount. Watch for M&A activity, as consolidation could unlock value. Upside risks include geopolitical tensions boosting prices, while downside includes recession fears capping demand.
🛢️ Oil just woke up in 2026#Brent is heading for its biggest monthly gain in years.
This isn’t random noise:
• strongest start-of-year rally since the post-COVID shock
• risk premium is back, not demand euphoria
• geopolitics > fundamentals, againMarkets are repricing… pic.twitter.com/GpxZV0jCge
— Jack Prandelli (@jackprandelli) January 31, 2026
Impact on Consumers
Higher oil prices translate to elevated gasoline costs, potentially averaging $3.50–$4.00 per gallon nationally, squeezing household budgets amid inflation. Home heating oil and natural gas bills could rise 5–10% year-over-year, particularly in the Northeast. Transportation and goods prices may increase, adding to cost-of-living pressures. However, efficiency gains and EV adoption could mitigate long-term impacts, while domestic production stability helps buffer import dependence.
Sources: theenergynewsbeat.substack.com,
Get your CEO on the podcast: https://sandstoneassetmgmt.com/media/
Is oil and gas right for your portfolio? https://sandstoneassetmgmt.com/invest-in-oil-and-gas/


Be the first to comment