


The US oil and gas sector is showing signs of resilience with a recent uptick in drilling activity, even as analysts sound alarms over an impending global oil surplus. According to the latest Baker Hughes data, the US rig count rose by five to 549 in the week ending December 5, 2025, marking the fourth increase in five weeks.
This modest rebound comes against a backdrop of warnings from major institutions about a “super glut” in 2026, potentially driving oil prices into the $50s or lower.
While higher rig counts signal optimism among producers, sluggish demand growth and surging non-OPEC supply could exacerbate oversupply pressures, creating a volatile environment for the energy market.
US Rig Count Breakdown
The increase in US rigs was driven primarily by oil-directed drilling, reflecting producers’ response to relatively stable crude prices around $58-62 per barrel in early December.
As of December 12, 2025, oil rigs climbed to 414, up from 413 the prior week, while gas rigs held steady or slightly declined to around 129.
Miscellaneous rigs remained at seven. Overall, the split shows oil rigs dominating at approximately 75%, gas at 24%, and miscellaneous at 1%.
By State
Drilling activity varies significantly across states, with some showing gains amid broader market caution:Louisiana: Added four rigs week-over-week, highlighting offshore and inland water activity.
New Mexico: Gained one rig, tied to Permian Basin operations.
Texas: Remains the epicenter but saw no recent net change; historically, it accounts for a large share of Permian rigs.
Oklahoma: Held steady, with no losses or gains reported in popular regions.
Other states: Minimal fluctuations, with North Dakota (DJ Basin) and Ohio (Utica) maintaining consistent levels.
These state-level shifts underscore a focus on high-productivity areas, even as total rigs are down 5% year-over-year from 2024 levels.
By Basin
|
Basin
|
Rig Count
|
Change (Week-over-Week)
|
Notes
|
|---|---|---|---|
|
Permian (West Texas/New Mexico)
|
251
|
Unchanged
|
Nation’s largest oil basin; down from earlier 2025 peaks but stable recently.
okenergytoday.com
|
|
Eagle Ford (Texas)
|
~50 (estimated based on trends)
|
-1
|
Focus on liquids-rich plays amid gas price weakness.
rigzone.com
|
|
Cana Woodford (Oklahoma)
|
17
|
Unchanged
|
Leading activity in the state.
|
|
Granite Wash (Oklahoma/Texas)
|
12
|
Unchanged
|
Steady gas-directed drilling.
|
|
DJ-Niobrara (Colorado/Wyoming)
|
9
|
Unchanged
|
Modest but consistent.
|
|
Utica (Ohio/Pennsylvania)
|
14
|
Unchanged
|
Primarily gas-focused.
|
|
Ardmore Woodford (Oklahoma)
|
3
|
Unchanged
|
Smaller play with limited activity.
|
|
Arkoma Woodford (Oklahoma)
|
2
|
Unchanged
|
Gas-oriented.
|
|
Mississippian (Oklahoma/Kansas)
|
1
|
Unchanged
|
Minimal rigs active.
|
Oil rigs are concentrated in oil-heavy basins like the Permian (mostly oil), while gas rigs dominate in areas like the Utica and Granite Wash. Land rigs total 527, offshore 19, and inland waters 3, with the uptick spread across categories.
Oil vs. Gas SplitOil Rigs: 414 (up 1 from mid-week estimates), representing the bulk of the increase as producers bet on sustained demand.
Gas Rigs: 129 (down 1 recently), pressured by low natural gas prices despite projections for a 56% spot price rise in 2025.
reuters.com
This split highlights a divergence: oil activity is buoyed by global demand expectations, while gas drilling lags due to ample inventories.
International Rig Count by Country
International rig counts, reported monthly by Baker Hughes, provide a global context. As of September 2025 (latest detailed available), the worldwide rig count stood at 1,812, excluding regions like Russia, Iran, and onshore China.
Activity remains robust in key producing nations, though specific December breakdowns are pending the next release. Based on trends:
Saudi Arabia: High activity, often leading the Middle East, with a focus on maintaining output.
Canada: 191 rigs (as of early December), up seasonally but down year-over-year.
Brazil and Guyana: Rising in Latin America due to offshore developments.
Norway and UK: Steady in Europe, with North Sea emphasis.
India and UAE: Active in Asia/Middle East, supporting OPEC+ strategies.
Global supply growth is projected at 3.1 million bpd in 2025, contributing to glut concerns.
The international count has been stable but could rise if prices recover.
Key Drillers and Publicly Traded Companies
Several major operators and service providers are driving US drilling. Key drillers include independents and integrated majors focusing on shale plays:ExxonMobil (XOM): Market cap ~$501B; leading Permian player with strong efficiency gains.
Chevron (CVX): ~$268B; active in Permian and Gulf; recent acquisitions boost scale.
ConocoPhillips (COP): ~$135B; diverse portfolio including Alaska and shale.
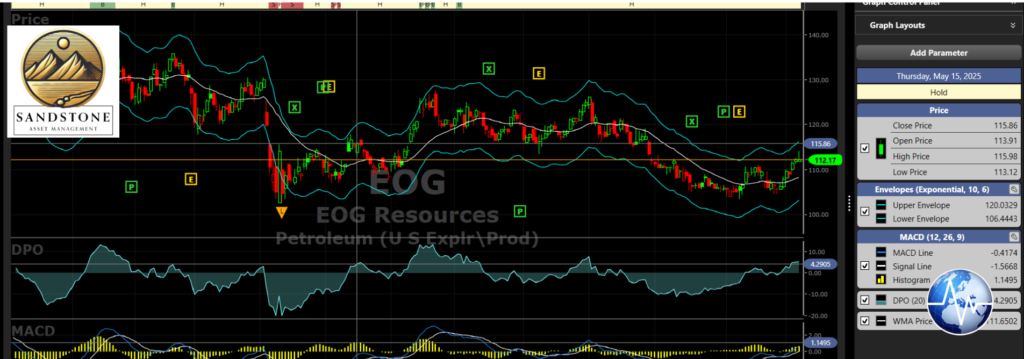
EOG Resources (EOG): ~$75B (estimated); top shale operator with high margins at 35%.
Diamondback Energy (FANG): Permian-focused; 42% operating margins; recently cut rigs amid price caution.
Devon Energy (DVN): 32% margins; multi-basin exposure.
APA Corp (APA): International and US assets; attractive for diversified investors.
Northern Oil and Gas (NOG): Non-operated model; high dividends.
CNX Resources (CNX): Gas-heavy; strong in Appalachia.
These companies are publicly traded on NYSE/Nasdaq, with many offering dividends (e.g., Vitesse Energy at top yields).
Investors should monitor quarterly reports for rig deployment and capex cuts, as firms like Diamondback plan reductions if prices fall further.
What Oil and Gas Investors Should Look For
In 2025, with rig counts as a leading indicator of production but tempered by record efficiencies (fewer rigs yielding more output), investors must navigate volatility.
Key factors include:Rig Count Trends: Rising counts signal production growth, but watch for basin-specific shifts; Permian efficiency means sustained output even with flat rigs.
Market Conditions: Expect Brent at $70-80/bbl, but glut risks could push to $50s.
Monitor OPEC+ decisions, US output hitting 13.6M bpd, and demand from China.
Company Metrics: Prioritize low breakeven costs (<$50/bbl), strong balance sheets, high dividends, and M&A activity for consolidation.
Geopolitical and Demand Risks: Escalations in the Middle East or Ukraine could spike prices in the short term, but oversupply dominates.
Long-Term Shifts: Transition to renewables may cap upside; look for diversified firms or those with natural gas exposure for LNG growth.
Investors should focus on resilient operators like EOG and FANG for upside in a glut scenario, while avoiding overleveraged drillers. As the IEA warns of a 4M bpd surplus, strategic positioning is key. There are still trillions of dollars needed for investment to meet normal decline curves, and some are questioning the glut narrative, much like the laddies on the Wendy’s commercial shouting, “Where’s the Beef?” The United States supply is close to five-year lows, and global supply is being absorbed; there is a significant question as to the ability of the OPEC+ countries to even meet their expected production.
Sources: tradingeconomics.com, discoveryalert.com.au, cyprusshippingnews.com, rigzone.com, okenergytoday.com, reuters.com, getzlerhenrich.com
Want to get your story in front of our massive audience? Get a media Kit Here. Please help us help you grow your business in Energy.

https://energynewsbeat.co/request-media-kit/


