


In the high-stakes world of energy markets, not all oil prices are created equal. “Paper oil” refers to benchmark futures contracts traded on exchanges like NYMEX (WTI) and ICE (Brent)—financial instruments where the vast majority of trading volume (often 95%+) never results in physical delivery. These are the headline numbers investors see on CNBC or in ETF quotes. In contrast, “delivered cost” is what refineries actually pay for physical barrels: the real crude loaded onto tankers, adjusted for quality differentials, transportation, insurance, and regional supply realities. This gap between paper benchmarks and physical delivered prices can create massive opportunities—or risks—for investors
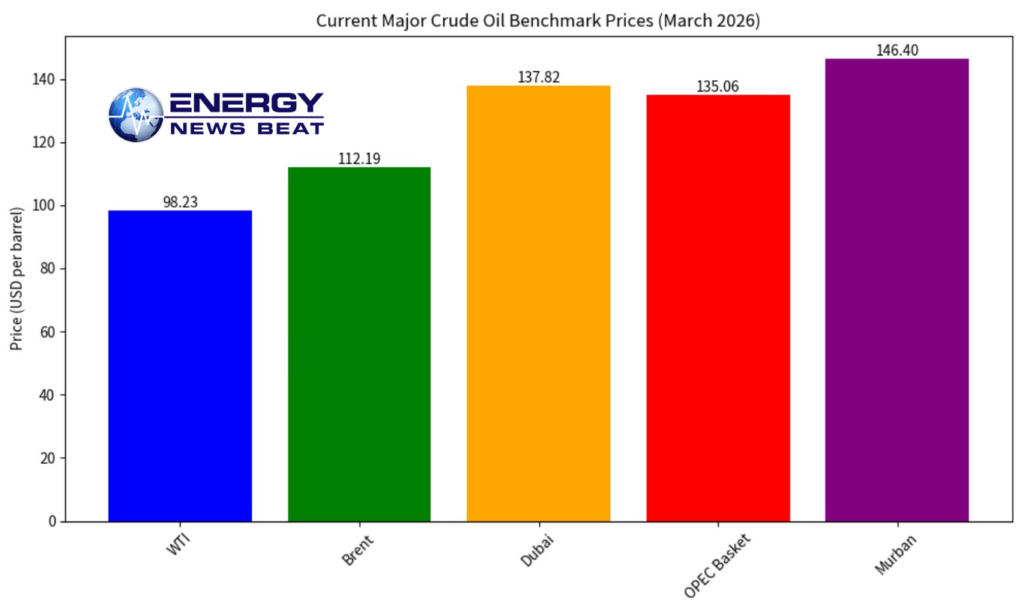
.As of March 20-21, 2026, the divergence has never been starker. Paper benchmarks show Brent at $112.19/bbl and WTI at $98.23/bbl. Yet physical benchmarks used by Asian refineries (the marginal global buyer) are trading far higher: Dubai at $137.82/bbl, OPEC Basket at $135.06/bbl, and Murban at $146.40/bbl. That’s a $25–$48 premium over Brent for delivered crude in key consuming regions.
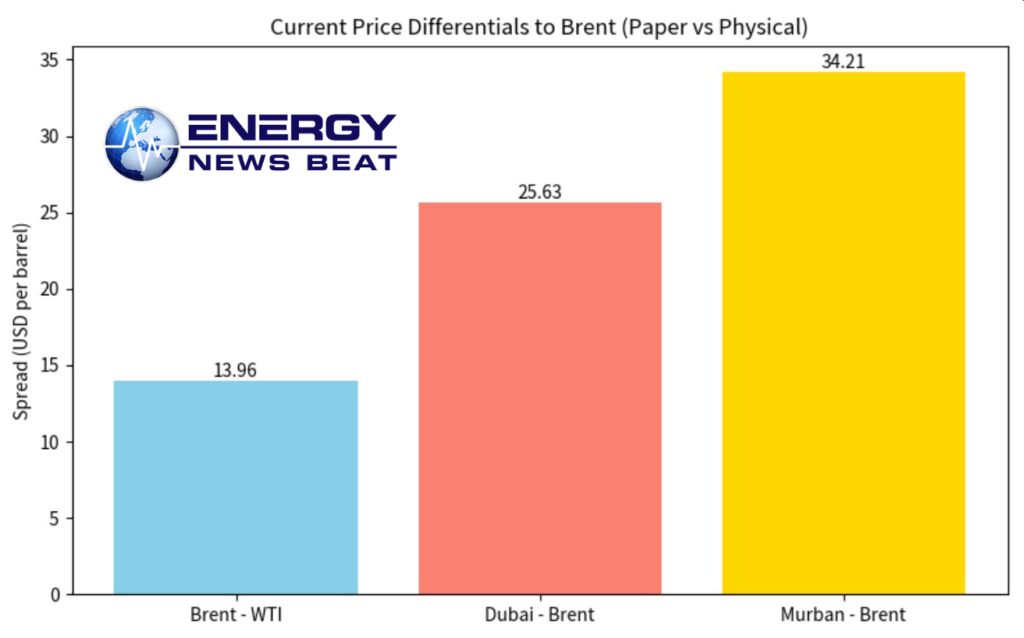
Calculated Differences (March 2026):
Brent vs. WTI (paper spread): +$14.00/bbl (Brent premium; widened dramatically from historical ~$4–7 norms).
Dubai vs. Brent (paper-to-physical Asia): +$25.63/bbl.
Murban vs. Brent: +$34.21/bbl.
OPEC Basket vs. Brent: +$22.87/bbl.
These are not minor quality tweaks—they reflect a broken market where physical supply constraints (especially in the Middle East) have sent real delivered costs soaring while paper futures lag. U.S. refiner acquisition costs (EIA composite) remain lower in lagged monthly data (~$61/bbl as of January 2026 pre-surge), but current spot physical deals for imported and domestic grades are rapidly converging toward higher delivered realities as arbitrage and exports adjust.
The “Snap” Potential: Why Paper Prices Could Surge Violently Upward
The current paper-physical disconnect is unsustainable. Physical markets lead during real supply stress because refineries must secure actual barrels or shut down. Paper markets, dominated by financial speculators and hedgers, can lag until forced to converge via arbitrage, rolling futures, or forced buying.A “snap” upward in paper prices (Brent/WTI futures jumping $20–$50+ in weeks) is highly plausible if the current drivers persist. Recent history shows exactly this dynamic: physical Dubai premiums exploded to $37–$50 over futures post-conflict escalation, with paper only partially catching up.
Triggers for a Huge Paper Price Spike:
Prolonged Strait of Hormuz disruption (20% of global oil flows)—Iran-related conflict has already choked shipping, driving physical premiums to record levels.
Escalating Middle East outages (Iran strikes, tanker insurance spikes, rerouting costs).
Asian demand surge or SPR releases failing to bridge the physical gap.
Speculative short-covering in futures as physical tightness forces refiners to bid up benchmarks.
If the Strait reopens quickly or massive SPR dumps succeed, the snap could reverse downward. But current signals point to upward risk for paper: European physicals and sour crudes are already at all-time highs, pulling futures along.
What This Means for Consumers
Refineries pass higher delivered costs straight into pump prices. Gasoline, diesel, and jet fuel crack spreads are widening rapidly. Expect U.S. average gasoline to climb toward $4–$5+/gallon (or higher regionally) if paper snaps up another $20–$30. Households, airlines, and trucking fleets face immediate pain—higher inflation, squeezed budgets, and potential supply shortages at the pump. The lag is short: physical costs hit refiners within days to weeks.
What This Means for Investors
This is a generational opportunity in energy. Investors in paper oil (futures, USO, BNO ETFs, or Brent-linked products) stand to capture explosive upside as benchmarks converge upward to physical reality. Oil majors (Exxon, Chevron), midstream, and refiners with locked-in physical margins could see windfall profits. Energy stocks and high-yield E&P plays may rerate sharply.
Conversely, those short paper or exposed to consumer-facing sectors (airlines, autos) face downside. The key: monitor physical differentials daily—when Dubai/Murban premiums compress back toward Brent, the snap is over. Position sizing, hedging with options, and watching Strait of Hormuz news flow are critical. In a snap scenario, paper oil could deliver 20–50%+ returns in months for leveraged or futures-based investors—far outpacing broad equities.
Source Appendix
All data and analysis drawn from real-time market sources as of March 20-21, 2026:
OilPrice.com Crude Oil Charts & Benchmarks: https://oilprice.com/oil-price-charts/
EIA U.S. Refiner Acquisition Cost: https://www.eia.gov/dnav/pet/pet_pri_rac2_dcu_nus_m.htm
Reuters/Iran War Oil Impact: https://www.reuters.com/business/energy/prices-oil-fuel-cargoes-smash-record-highs-iran-war-chokes-middle-east-supply-2026-03-19/
Physical vs Paper Analysis (Berkshire Edge): https://theberkshireedge.com/future-vs-physical-how-the-oil-market-broke-in-two/
Trading Economics & Investing.com for live futures: https://tradingeconomics.com/commodity/brent-crude-oil and https://www.investing.com/commodities/brent-oil
Additional context from S&P Global and market reports on differentials.
Energy News Beat will continue monitoring this divergence—the next move in paper oil could reshape portfolios overnight. Stay tuned for updates.
Check out the Energy News Beat Substack. https://theenergynewsbeat.substack.com/


Be the first to comment