The United States is making more gas than ever. This is a byproduct of historical highs in 2021 and 2022.
The rule of thumb in commodities is that high prices bring supply. That truth has never failed. In the case of energy production, that supply is often slow to come, but when it does, the market can easily get flooded, particularly, if demand isn’t strong enough to justify the sustainability of a lofty price. While this pattern persists perpetually among all commodities, it is more extreme in natural gas relative to most.
Unfortunately for gas bulls, warm weather dampened winter consumption, and despite a few head fakes, the Freeport LNG terminal hasn’t been able to get on its feet. The terminal has partially reopened after suffering from an explosion last year that put it out of commission, but the reopening process comes with a lot of red tape that acts as a crowbar in the wheels of progress. I’m not offering an opinion, just stating the reality.
Obviously, compliance rules ensuring the safety of workers and surrounding areas are crucial, but I think we can all agree efficiency is lacking. In any case, the terminal will reopen at some point, and when it does, the ability of the U.S. to export more gas abroad will provide a boost to gas prices.
Daily Chart
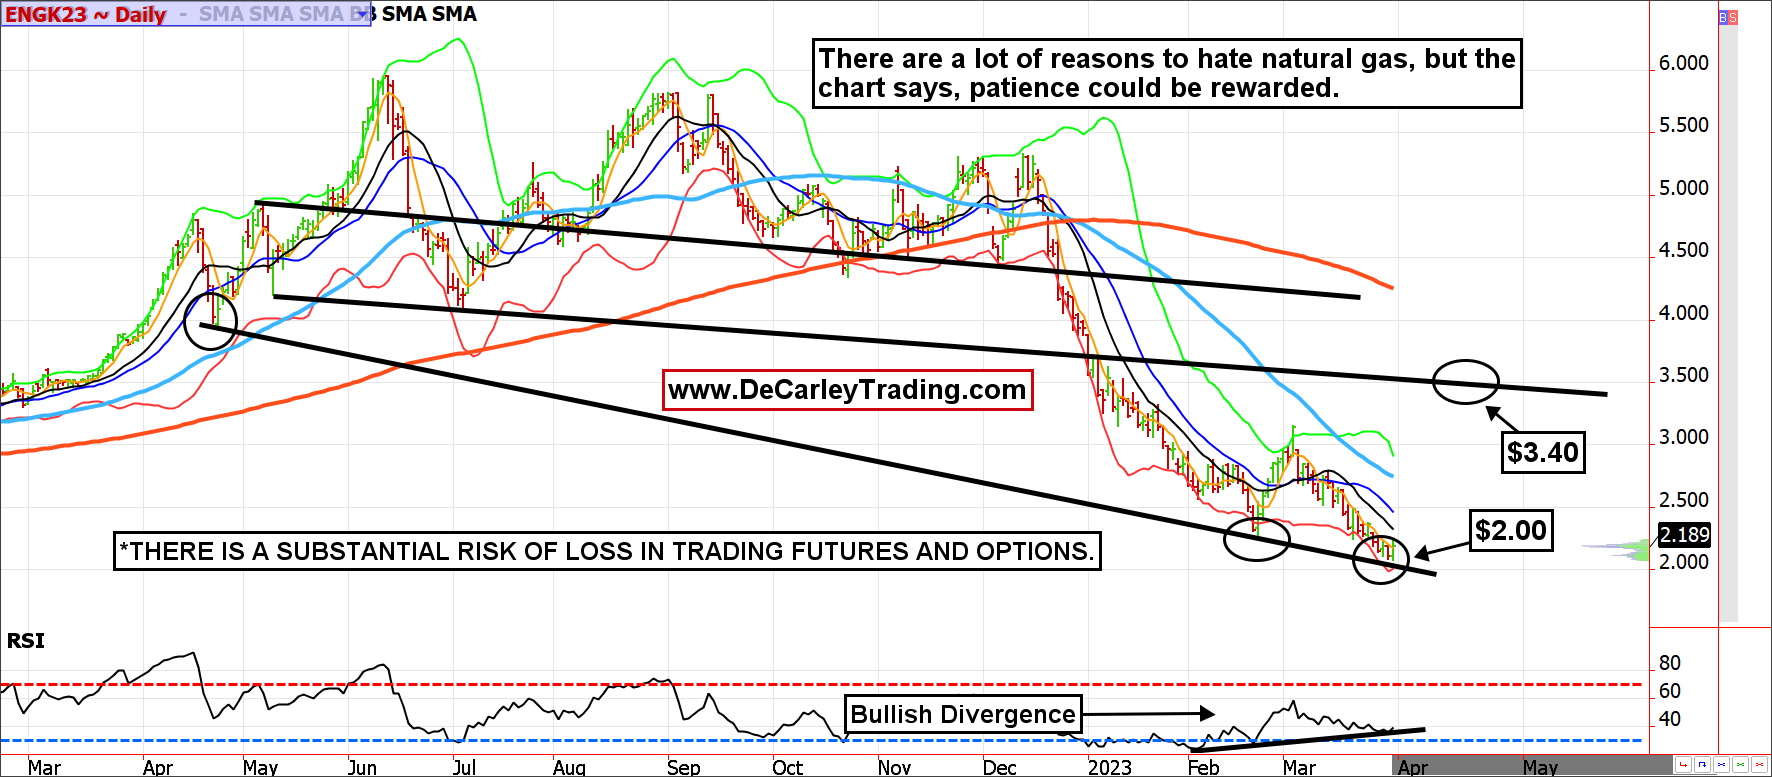
Chart Source: QST
If you are a chart watcher, like we are, there is a pivot line on the chart that should act as support.
If you draw a line in the front-month futures contract (May) from the April 2022 low through the February 2023 low, it comes back into play near $2.00. We believe this will be a pivotal area, but more importantly, supportive of prices and could provide a base for a double bottom.
COT Report
The Commitments of Traders Report, issued by the CFTC, suggests there is an overcrowded trade developing on the short side of natural gas futures.
In the past, the gas market hasn’t immediately bottomed out on lopsided positioning, but in the long run, the result is consistently a price reversal as the bulls run out of conviction and capitulate sell, and the bears have already expressed their opinion (sold).
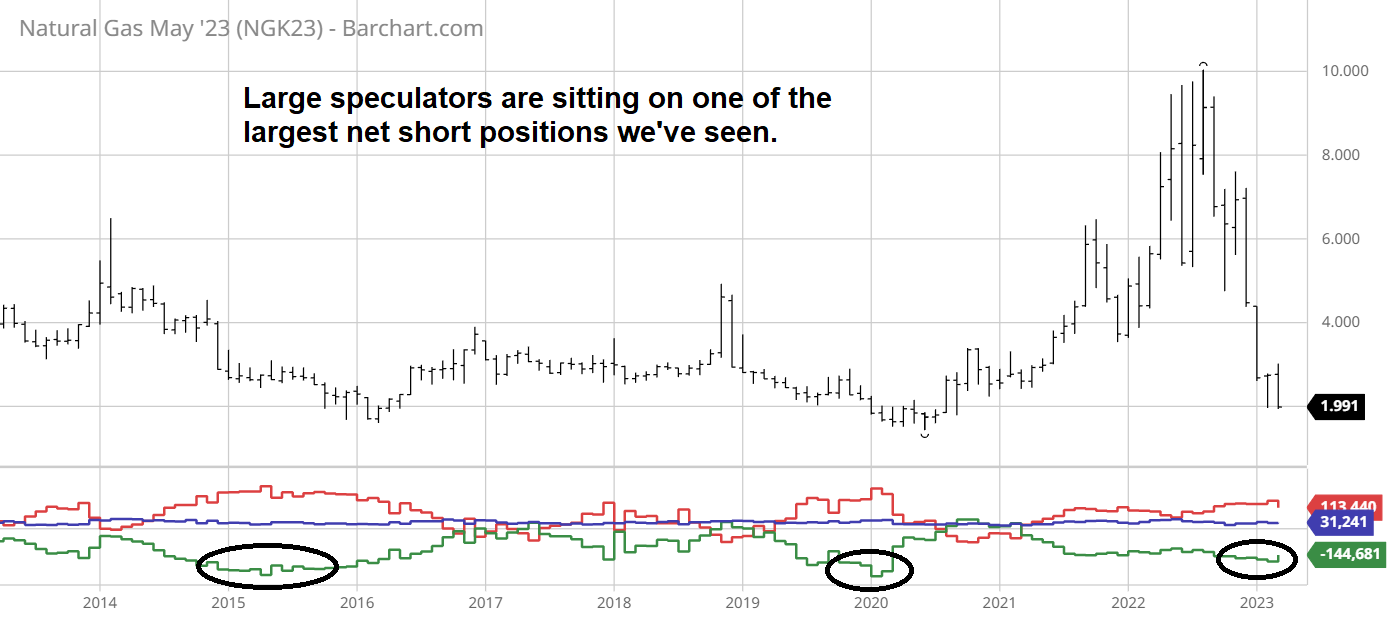
Chart Source: Barchart
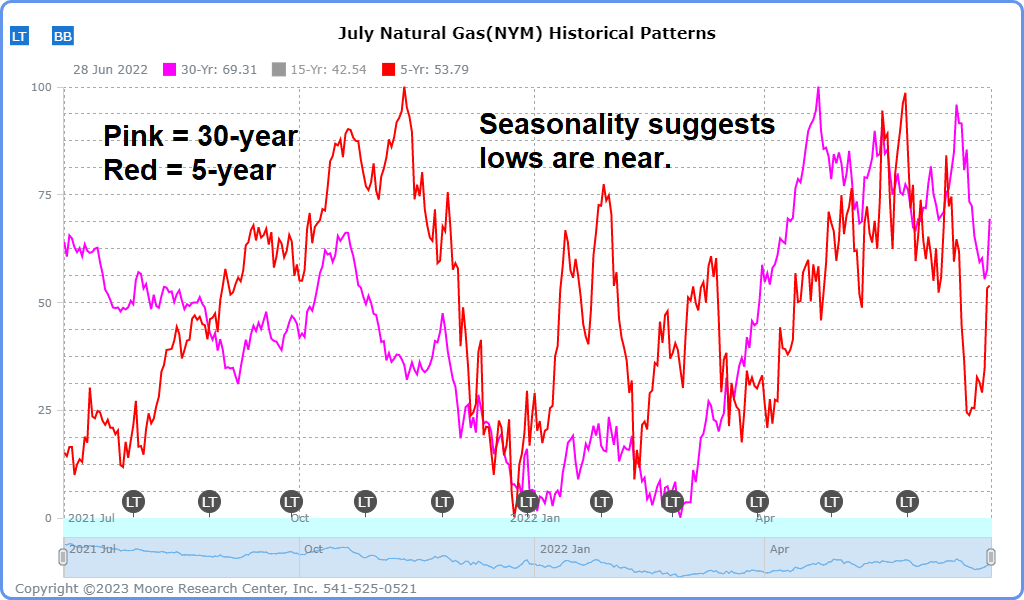
Seasonality
The seasonal tendency for natural gas over the last five years has been a triple-dip bottom early in the year, followed by an April and May rally.
Data that includes the last thirty years suggests something similar but with a less vicious double dip (not triple). However, both sets of data agree that April is generally a good time to be a natural gas bull.
Bottom Line
We believe that $2.00 natural gas is as unsustainable as $10.00 natural gas. Yet, it might take some time for the pessimism and the supply glut to work itself out. We can’t rule out the front month touching $1.60 as it did in 2016, but it isn’t likely. Also, we’ve noticed many of the same analysts that believed gas was heading to $15.00 or $20.00 last year are now calling for $1.50 gas. Perhaps they are right this time, but the aforementioned factors suggest they probably aren’t.
It is incredible how different commodity sentiments can swing. Still, in most circumstances, extreme positioning, sentiment, and pricing suggest the pendulum has swung too far to one side, and gravity will take hold.