


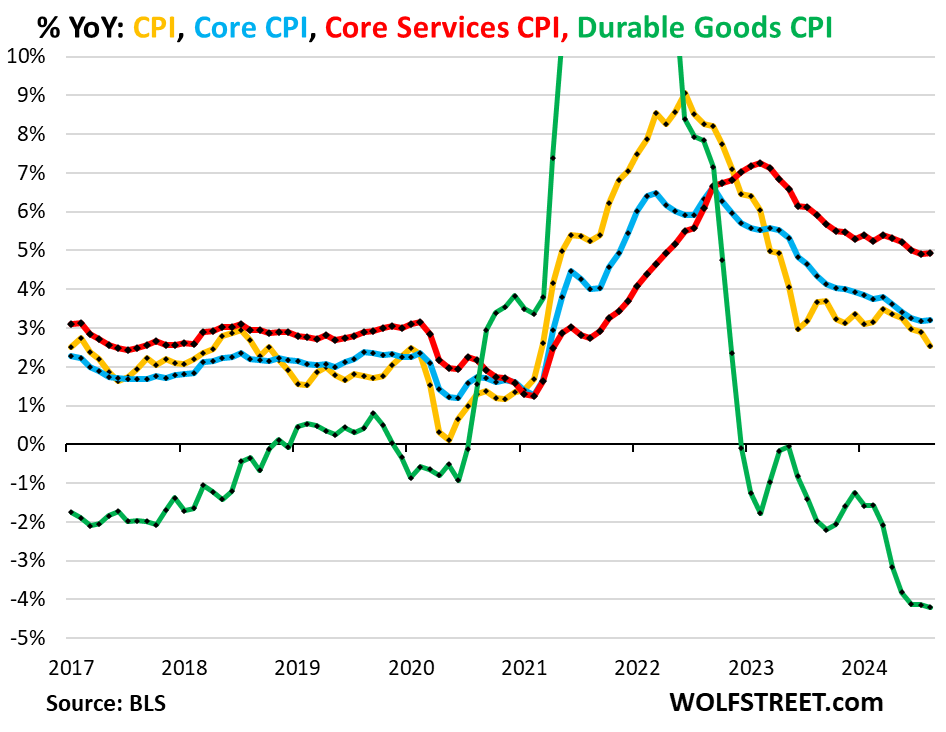
Second month-to-month acceleration in a row. Year-over-year, Core CPI and Core Services CPI show first acceleration since March.
By Wolf Richter for WOLF STREET.
On a month-to-month basis in a most unwelcome development, “core services” re-accelerated for the second month in a row in August, to 5.0% annualized, which fueled the re-acceleration of the overall Consumer Price Index (CPI) and Core CPI. Core Services make up about 65% of the Consumer Price Index and include housing, healthcare, and insurance.
On the positive side of the inflation ledger were durable goods (motor vehicles, furniture, electronics, etc.), where prices dropped even faster in August, and energy, where prices dropped across the board, while food prices remained roughly stable, according to the Bureau of Labor Statistics today.
On a month-to-month basis:
Overall CPI: +0.19% (+2.3% annualized), 2nd acceleration in a row.
Core CPI: +0.28% (+3.4% annualized), 2nd acceleration in a row.
Core Services CPI: +0.41% (+5.0% annualized), 2nd acceleration.
Durable goods CPI: -0.36% (-4.3% annualized), a faster drop.
Food at home CPI: unchanged.
Energy: -0.78%, after being unchanged in July.
On a year-over-year basis, in summary:
Core services CPI (red in the chart below) rose by 4.93% year-over-year in August, a slight acceleration from July (4.90%). It has been near the 5% line since December 2023. It includes all services except energy services.
Durable goods CPI (green) has been falling since mid-2022 as it unwinds the historic spike during the pandemic. Used-vehicle prices have plunged. In August, durable goods CPI fell by 4.2% year-over-year, a downward acceleration from July, and the biggest year-over-year drop since 2003.
Core CPI (blue), which excludes food and energy, rose by 3.20% year-over-year, a slight acceleration from July (3.17%), with services pushing it into one direction, and durable goods into the other.
Overall CPI (yellow) rose by 2.5% year-over-year, a deceleration from July, on a drop in energy prices and stability in food prices.
“Core” CPI, month-to-month.
Core CPI accelerated for the second month in a row, by 0.28% in August from July, or +3.4% annualized, the biggest increase since April (blue in the chart below).
The culprit for the re-acceleration was core services CPI, while the durable goods CPI continued to drop and pulled in the opposite direction.
The six-month core CPI, which irons out some of the month-to-month squiggles, rose by 2.7% annualized, as slight deceleration from July, as the high reading of February fell out of the six-month range.
“Core services” CPI bounced for the second month.
Core services CPI increased by 5.0% annualized in August from July (+0.41% not annualized), the second big bounce-back from the outlier in June and May (blue line).
The six-month core services CPI decelerated a tad to 4.1% annualized, the smallest increase since January 2022 (red).
The housing components of core services CPI.
Rent of Primary Residence CPI decelerated, increasing by 4.5% annualized in August from July. It has been in the same range all year (blue).
The three-month rate rose by 4.6%, a slight deceleration from the prior month. After cooling a lot in 2023, rent inflation hasn’t cooled much this year.
Rent CPI accounts for 7.6% of overall CPI. It is based on rents that tenants actually paid, not on asking rents of advertised vacant units for rent. The survey follows the same large group of rental houses and apartments over time and tracks the rents that the current tenants, who come and go, actually paid in these units.
The Owners’ Equivalent of Rent CPI bounced for the second month, rising by 6.1% annualized in August from July.
The three-month OER CPI accelerated to 4.6% annualized (red).
The OER index accounts for 26.8% of overall CPI. It estimates inflation of “shelter” as a service for homeowners – as a stand-in for the services that homeowners pay for, such as interest, homeowner’s insurance, HOA fees, maintenance, and property taxes. As an approximation, it is based on what a large group of homeowners estimates their home would rent for, the assumption being that a homeowner would want to recoup their cost increases by raising the rent.
“Asking rents…” The Zillow Observed Rent Index (ZORI) and other private-sector rent indices track “asking rents,” which are advertised rents of vacant units on the market. Because rentals don’t turn over that much, the ZORI’s spike in 2021 through mid-2022 never fully translated into the CPI indices because not many people actually ended up paying those high asking rents.
ZORI’s August data is not yet available. In July, it jumped by 0.44% month-to-month and by 3.4% year-over-year.
The chart shows the CPI Rent of Primary Residence (blue, left scale) as index value, not percentage change; and the ZORI in dollars (red, right scale). The left and right axes are set so that they both increase each by 55% from January 2017. The ZORI was up by 52% from January 2017, and the CPI Rent was up by 39% over the same period.
Rent inflation vs. home-price inflation: The red line in the chart below represents the CPI for Rent of Primary Residence as index value. The purple line represents the Case-Shiller 20-Cities Home Price Index. Both indexes are set to 100 for January 2000:
Motor-vehicle maintenance & repair inflation, after cooling for months, re-accelerated in August, jumping by 6.9% annualized from July. Year-over-year, it was up 4.1%.
Since January 2020, it has spiked by 36% as labor costs of auto-repair technicians have surged, and as prices of replacement parts have surged.
Motor vehicle insurance inflation continues to surge; it exploded in 2022 and 2023 because motor vehicle repair costs surged, and because used-vehicle prices (replacement values) had exploded in 2021 and 2022. And now it continues to surge because auto insurers are increasing their profit margins. For example, Buffett’s Berkshire Hathaway reported for Q2 that at GEICO, its auto insurance unit, big increases in premiums despite reduced costs of claims caused underwriting profits to more than triple!
In August from July from June: +6.9 annualized
Year-over-year: +16.5%
Since January 2022: +50%
Food away from Home CPI – often called food services – includes full-service and limited-service meals and snacks served away from home, food at cafeterias in schools and work sites, food served at stalls, etc.
In August from July annualized: +3.2%, an acceleration
Year-over-year: +4.0%, in the same range around 4% for the past five months.
Since January 2020: +28%.
Core services CPI has surge by 22% since January 2020. In a sign that services inflation has been very broad and went well beyond housing, Core Services excluding rent and OER have surged by 20%.
| Major Services ex. Energy Services | Weight in CPI | MoM | YoY |
| Core Services | 64% | 0.4% | 4.9% |
| Owner’s equivalent of rent | 26.8% | 0.5% | 5.4% |
| Rent of primary residence | 7.6% | 0.4% | 5.0% |
| Medical care services & insurance | 6.5% | -0.1% | 3.2% |
| Food services (food away from home) | 5.4% | 0.3% | 4.0% |
| Education and communication services | 5.0% | 0.2% | 2.3% |
| Motor vehicle insurance | 2.9% | 0.6% | 16.5% |
| Admission, movies, concerts, sports events, club memberships | 1.8% | -0.8% | 5.5% |
| Other personal services (dry-cleaning, haircuts, legal services…) | 1.5% | 0.2% | 4.6% |
| Lodging away from home, incl Hotels, motels | 1.3% | 1.8% | 1.8% |
| Motor vehicle maintenance & repair | 1.2% | 0.6% | 4.1% |
| Public transportation (airline fares, etc.) | 1.2% | 2.5% | -1.1% |
| Water, sewer, trash collection services | 1.1% | 0.2% | 4.2% |
| Video and audio services, cable, streaming | 0.9% | 0.1% | 2.0% |
| Pet services, including veterinary | 0.4% | 0.3% | 6.0% |
| Tenants’ & Household insurance | 0.4% | 0.8% | 3.6% |
| Car and truck rental | 0.1% | -1.5% | -8.4% |
| Postage & delivery services | 0.1% | 0.5% | 5.5% |
Durable goods CPI.
The durable goods CPI fell by 4.3% annualized (-0.36% not annualized) in August from July, and by 4.2% year-over-year, a downward acceleration from the prior month, and the biggest year-over-year drop since 2003.
New and used vehicles dominate this index. Other goods include information technology products (computers, smartphones, home network equipment, etc.), appliances, furniture, fixtures, etc. All categories have been experiencing price declines starting in late 2022, following the price spike during the pandemic.
From January 2020 to the peak in August 2022, durable goods prices spiked by 24%. Since then, they have unwound about one-third of the pandemic spike. Compared to January 2020, the index is still up 16%.
| Major durable goods categories | MoM | YoY |
| Durable goods overall | -0.4% | -4.2% |
| New vehicles | 0.0% | -1.2% |
| Used vehicles | -1.0% | -10.4% |
| Information technology (computers, smartphones, etc.) | -0.5% | -6.5% |
| Sporting goods (bicycles, equipment, etc.) | 0.0% | -1.9% |
| Household furnishings (furniture, appliances, floor coverings, tools) | -0.3% | -2.6% |
New vehicles CPI rose just a hair (+0.6% annualized) in August from July, after seven months in a row of small declines. Year-over-year, the index fell by 1.2%.
Prices of new vehicles have been sticky after the blistering spike from early 2021 into early 2023 – unlike used vehicle prices – and have only given up a little ground since the peak, despite the glut of new vehicles on many lots, and amid calls for big incentives and discounts to move the vehicles. The index is still up 19% from January 2020:
In the years before the pandemic, the new vehicle CPI zigzagged along a flat line, though vehicles were getting more expensive. This is the effect of “hedonic quality adjustments” applied to the CPIs for new and used vehicles and some other products (see our explanation of hedonic quality adjustments in the CPI).
Used vehicle CPI, seasonally adjusted, dropped in August from July by 11% annualized (-0.96% not annualized), and by 10.4% year-over-year, a slower decline than in the prior two months (red).
Not seasonally adjusted, used vehicle prices fell 8.9% annualized (-0.77% not annualized) in August from July (blue).
This decline may not last much longer. On the wholesale side, private-sector data from Manheim, the largest auto auction in the US, showed big price increases in August, as retail inventories have tightened and dealers tried to restock, amid strong sales. These higher wholesale prices will filter into retail prices and into CPI, which reflects retail prices, over the next few months.
Used vehicle CPI has now given up nearly 60% of the spike from January 2020 through January 2022, but is still 24% higher than in January 2020. Wholesale data indicates that this may be about as good as it gets going forward.
Food Inflation.
Inflation of “Food at home” – food purchased at stores and markets and eaten off premises – has essentially flattened out this year at a very high plateau.
| MoM | YoY | |
| Food at home | 0.0% | 0.9% |
| Cereals, breads, bakery products | -0.1% | -0.3% |
| Beef and veal | 0.3% | 4.2% |
| Pork | 0.1% | 1.8% |
| Poultry | 1.0% | 0.9% |
| Fish and seafood | 0.2% | -2.3% |
| Eggs | 4.8% | 28.1% |
| Dairy and related products | 0.5% | 0.4% |
| Fresh fruits | 0.7% | -0.6% |
| Fresh vegetables | -1.1% | -0.4% |
| Juices and nonalcoholic drinks | -0.5% | 1.8% |
| Coffee, tea, etc. | -2.2% | -2.1% |
| Fats and oils | -0.9% | 2.4% |
| Baby food & formula | -0.5% | 3.7% |
| Alcoholic beverages at home | 0.0% | 1.9% |
Apparel and footwear.
Apparel and footwear are components of nondurable goods, along with food, energy products, household supplies, and other stuff.
Month-to-month, the CPI for apparel and footwear rose by 0.29%. Year-over-year, the index was about flat. Note that prices trended lower in the years before the pandemic. That trend seems to have ended:
Energy.
| CPI for Energy, by Category | MoM | YoY |
| Overall Energy CPI | -0.8% | -4.0% |
| Gasoline | -0.6% | -10.3% |
| Electricity service | -0.7% | 3.9% |
| Utility natural gas to home | -1.9% | 0.1% |
| Heating oil, propane, kerosene, firewood | -1.5% | -7.0% |
The CPI for energy covers energy products and services that consumers buy and pay for directly:
Gasoline prices, which account for about half of the energy price index, are very seasonal. Seasonal adjustments are trying to iron out the seasonality. We’ll look at both.
Not seasonally adjusted, gasoline prices fell in August from July (blue). Seasonally adjusted, prices also dipped (red). Since the top of the spike in June 2022, gasoline prices have dropped 29% (seasonally adjusted):
Take the Survey at https://survey.energynewsbeat.com/