


Listing prices, YoY: Miami -11.7%, San Diego -9.1%, Kansas City -8.5%, San Francisco -7.7%, Austin -7.6%. Active listings explode in Tampa, San Diego, Miami, Seattle…
By Wolf Richter for WOLF STREET.
In August, “the housing market slowed considerably as both buyers and sellers patiently wait for a lower mortgage rate environment,” Realtor.com reported today, along with dropping listing prices, waves of price reductions, surging – or exploding – active listings, and rising days a property spent on the market before it was sold or pulled off the market.
While August home sales will be reported later, starting with pending sales later this month, we already know that pending sales in July plunged to the lowest level in the data going back to 2001. So based on what Realtor.com was saying today, August may yet be worse. Sales that closed in August – so deals that were done mostly in June, July, and August – were near the lowest levels of the Housing Bust.
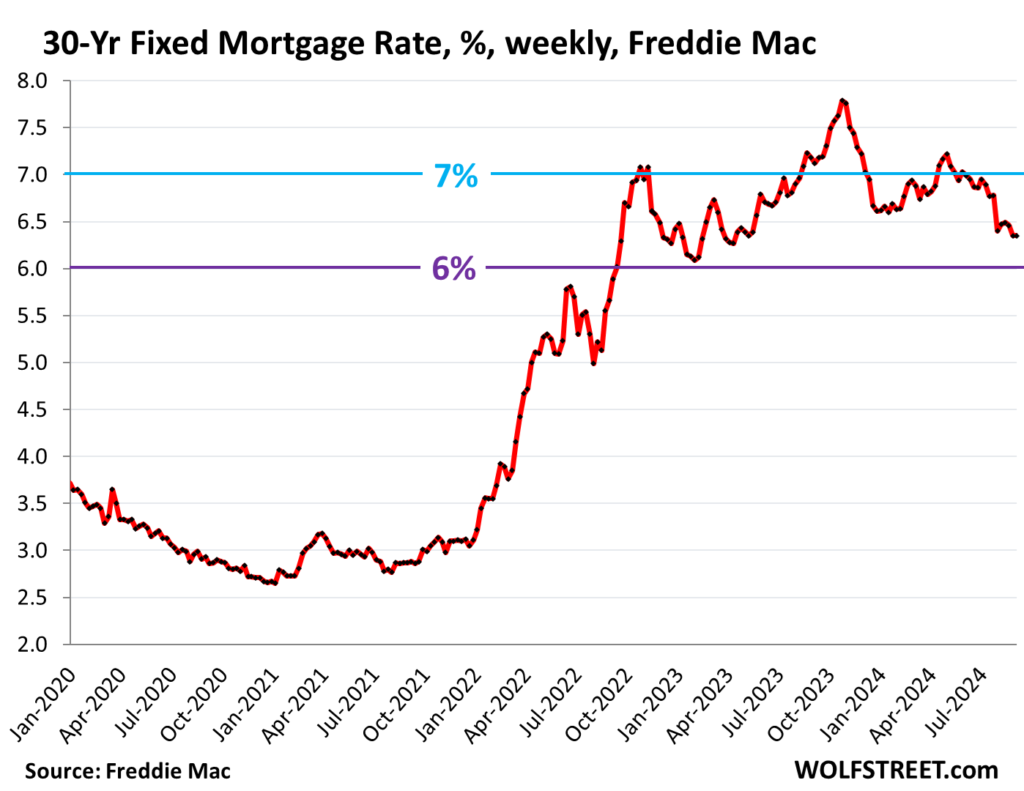
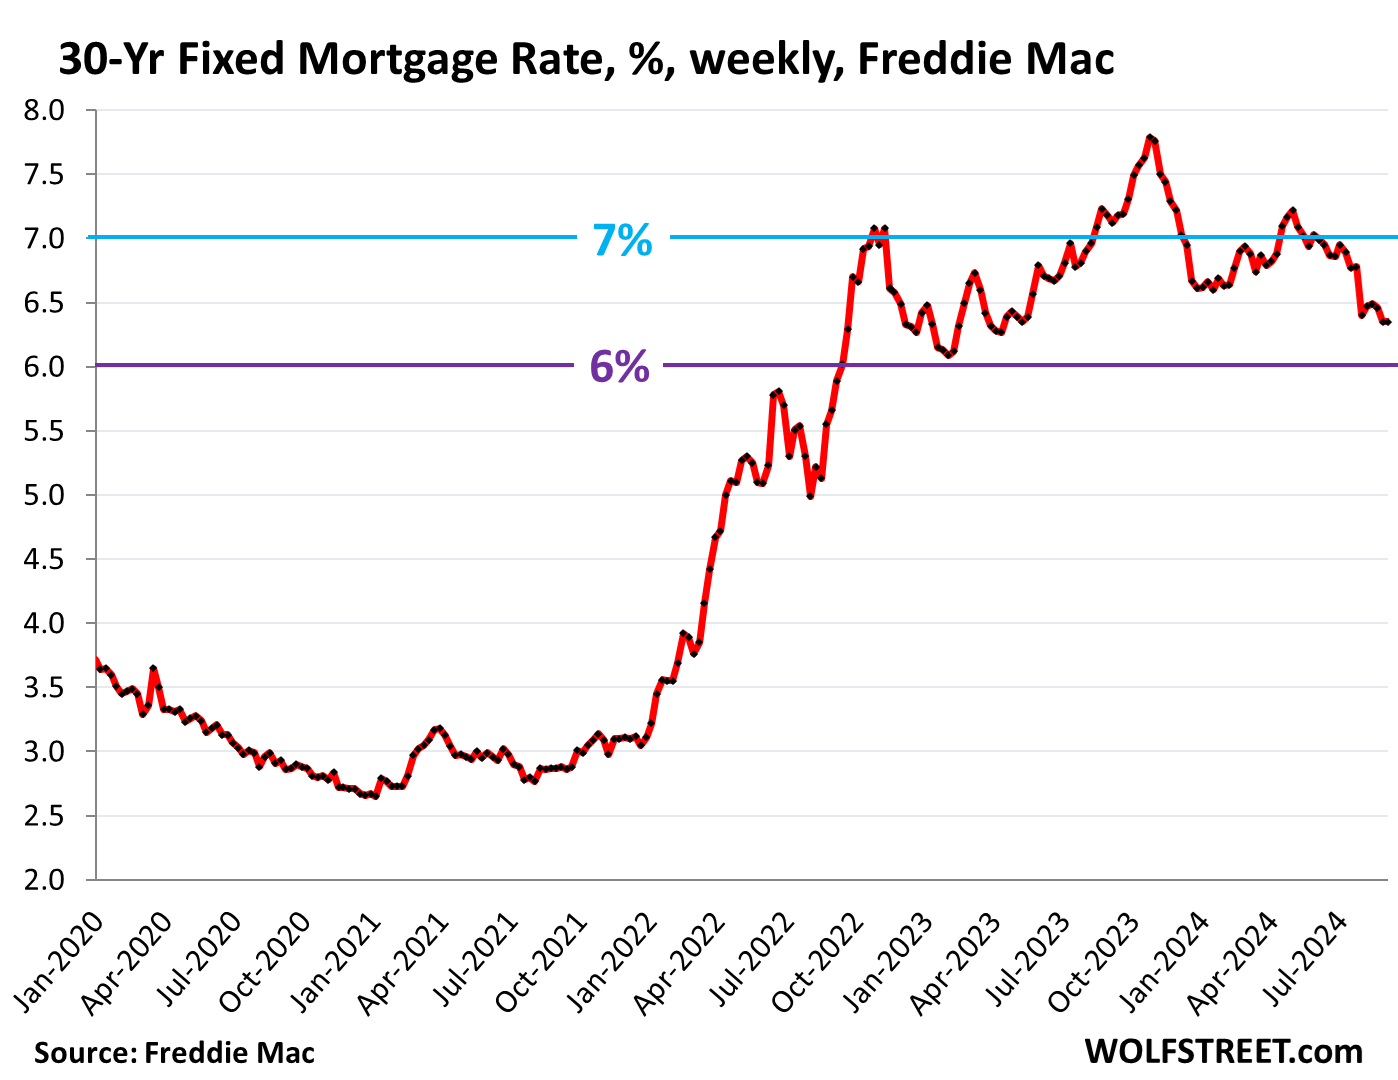
Turns out, prices are way too high, and potential buyers have gone on buyers’ strike even as mortgage rates have been zigzagging lower for the past 10 months. In the current reporting week, the average 30-year fixed mortgage rate was 6.35%, same as in the prior week, and down by 1.44 percentage points from the peak in late October 2023, according to Freddie Mac today. Six rate cuts have already been priced into mortgage rates, and yet sales continue to plunge.

The median listing price in August dropped for the second month in a row from the seasonal peak in June, which had been lower than the all-time peak in June 2022, and flat with June 2023. Year-over-year, the median listing price was down 1.3% (data via Realtor.com):
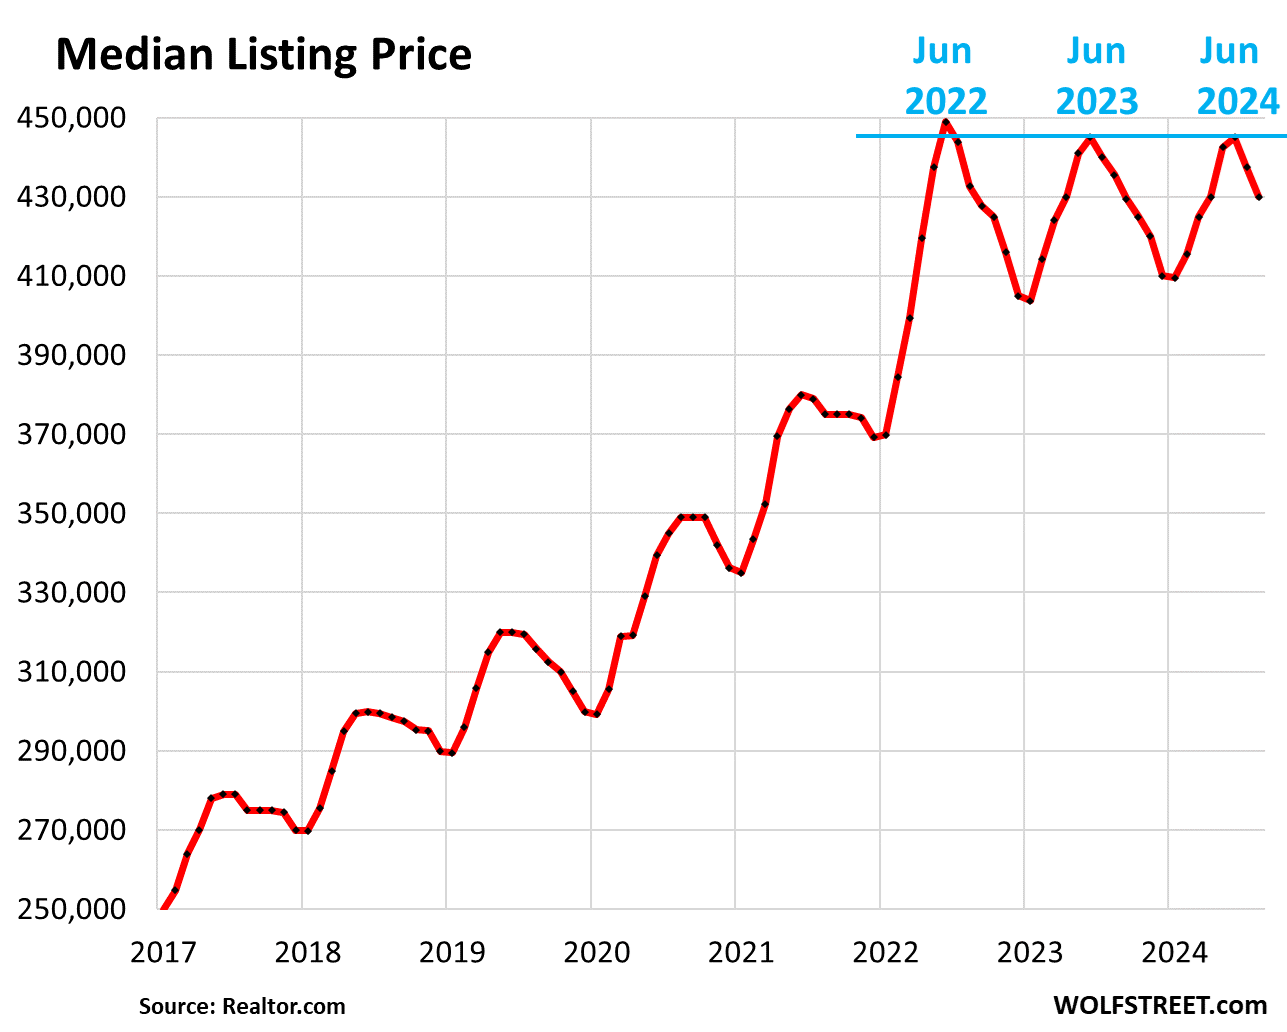

Even in metros where listing prices have dropped, they clearly haven’t dropped enough to make sales happen even at these lower mortgage rates, as sellers cling to their notion of what prices should be, while buyers have lost interest at those prices.
Here are the 29 metropolitan statistical areas of the biggest 50 with year-over-year drops in median listing prices, according to Realtor.com today, with Miami (-11.7%) and San Diego (-9.1%) on top:
| Metro Area, August 2024 | Median Listing Price | % YoY |
| Miami-Fort Lauderdale-Pompano Beach | $530,000 | -11.7% |
| San Diego-Chula Vista-Carlsbad | $999,000 | -9.1% |
| Kansas City, Mo.-Kan. | $398,050 | -8.5% |
| San Francisco-Oakland-Berkeley | $969,000 | -7.7% |
| Austin-Round Rock-Georgetown | $525,000 | -7.6% |
| Oklahoma City | $315,000 | -7.3% |
| Cincinnati, Ohio-Ky.-Ind. | $349,900 | -6.7% |
| Tampa-St. Petersburg-Clearwater | $415,000 | -6.2% |
| Denver-Aurora-Lakewood | $620,000 | -6.1% |
| Nashville-Davidson-Murfreesboro-Franklin | $550,000 | -5.7% |
| Orlando-Kissimmee-Sanford | $435,000 | -5.2% |
| San Jose-Sunnyvale-Santa Clara | $1,399,000 | -5.1% |
| Sacramento-Roseville-Folsom | $640,000 | -4.8% |
| Dallas-Fort Worth-Arlington | $444,990 | -4.3% |
| Phoenix-Mesa-Chandler | $515,000 | -4.3% |
| New Orleans-Metairie | $325,000 | -4.2% |
| San Antonio-New Braunfels | $342,500 | -4.1% |
| Jacksonville, Fla. | $409,850 | -4.1% |
| Portland-Vancouver-Hillsboro | $615,000 | -3.6% |
| Atlanta-Sandy Springs-Alpharetta | $415,000 | -3.5% |
| Seattle-Tacoma-Bellevue | $775,000 | -3.1% |
| Minneapolis-St. Paul-Bloomington | $439,990 | -2.8% |
| Washington-Arlington-Alexandria | $599,900 | -2.5% |
| Indianapolis-Carmel-Anderson | $330,000 | -2.2% |
| Raleigh-Cary | $454,900 | -2.2% |
| Pittsburgh | $245,000 | -2.0% |
| Baltimore-Columbia-Towson | $370,900 | -1.7% |
| Boston-Cambridge-Newton | $834,500 | -1.1% |
| Columbus | $384,900 | -0.3% |
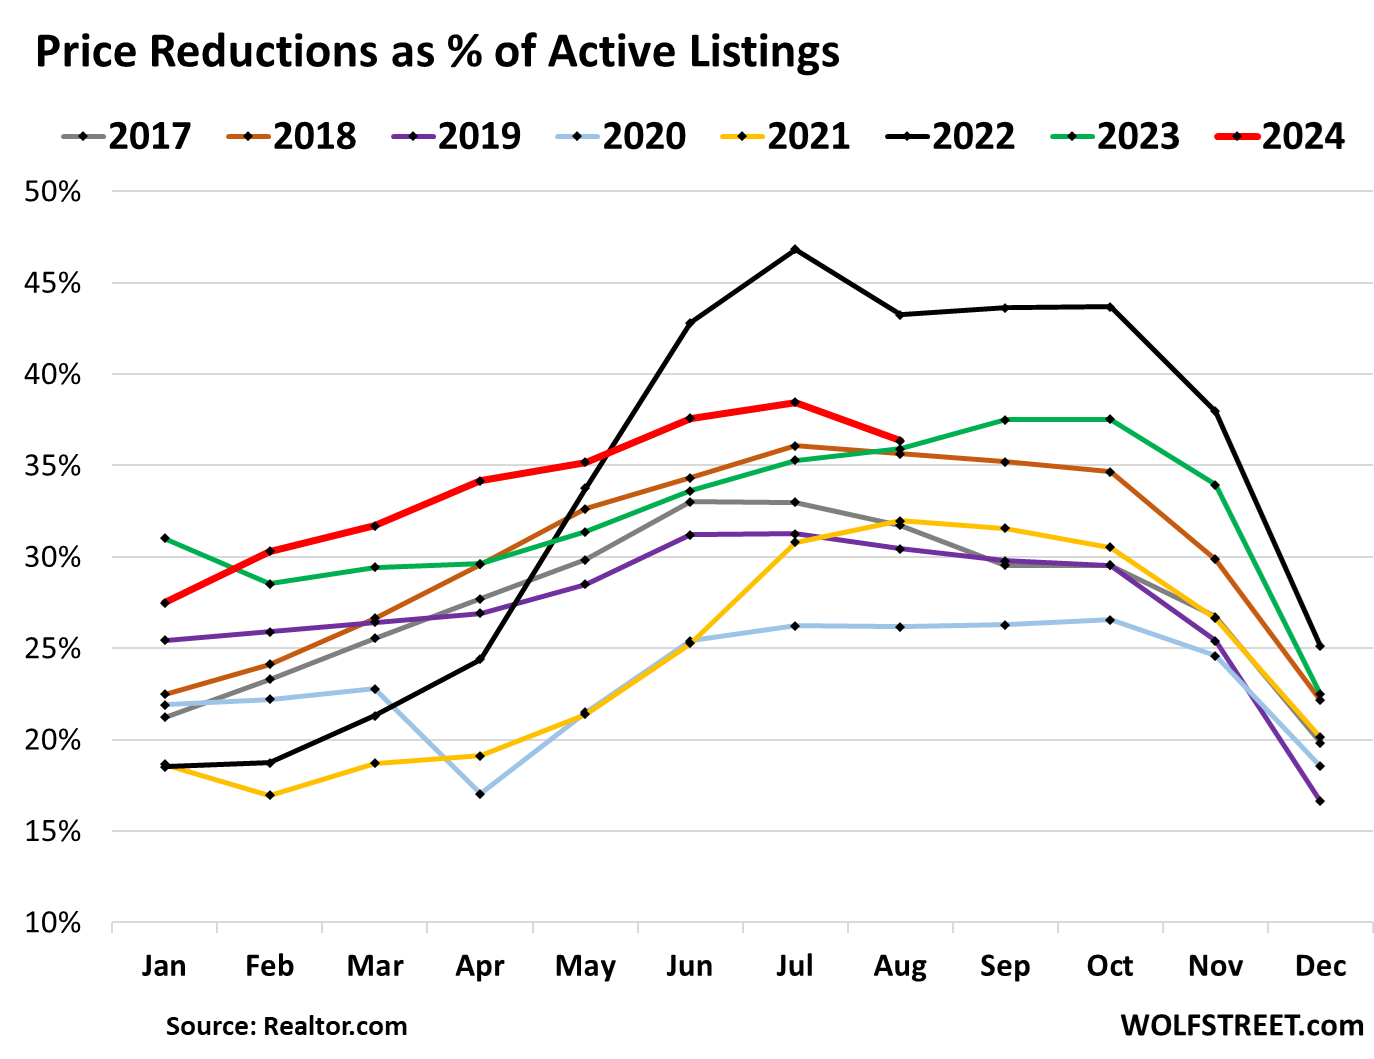
Price reductions: The share of active listings with price reductions in August of 36.3% was the highest rate for any August in the data going back to 2017, except for August 2022. But those price reductions clearly aren’t enough to bring potential buyers into the market (data via Realtor.com):

Active listings (total inventory minus listings with a pending sale) surged to 909,300 listings, the highest since May 2020, as sales have plunged and as inventory gets stale. There simply is no demand at these prices, they’re way too high, and it’s up to sellers to figure this out (data via Realtor.com):
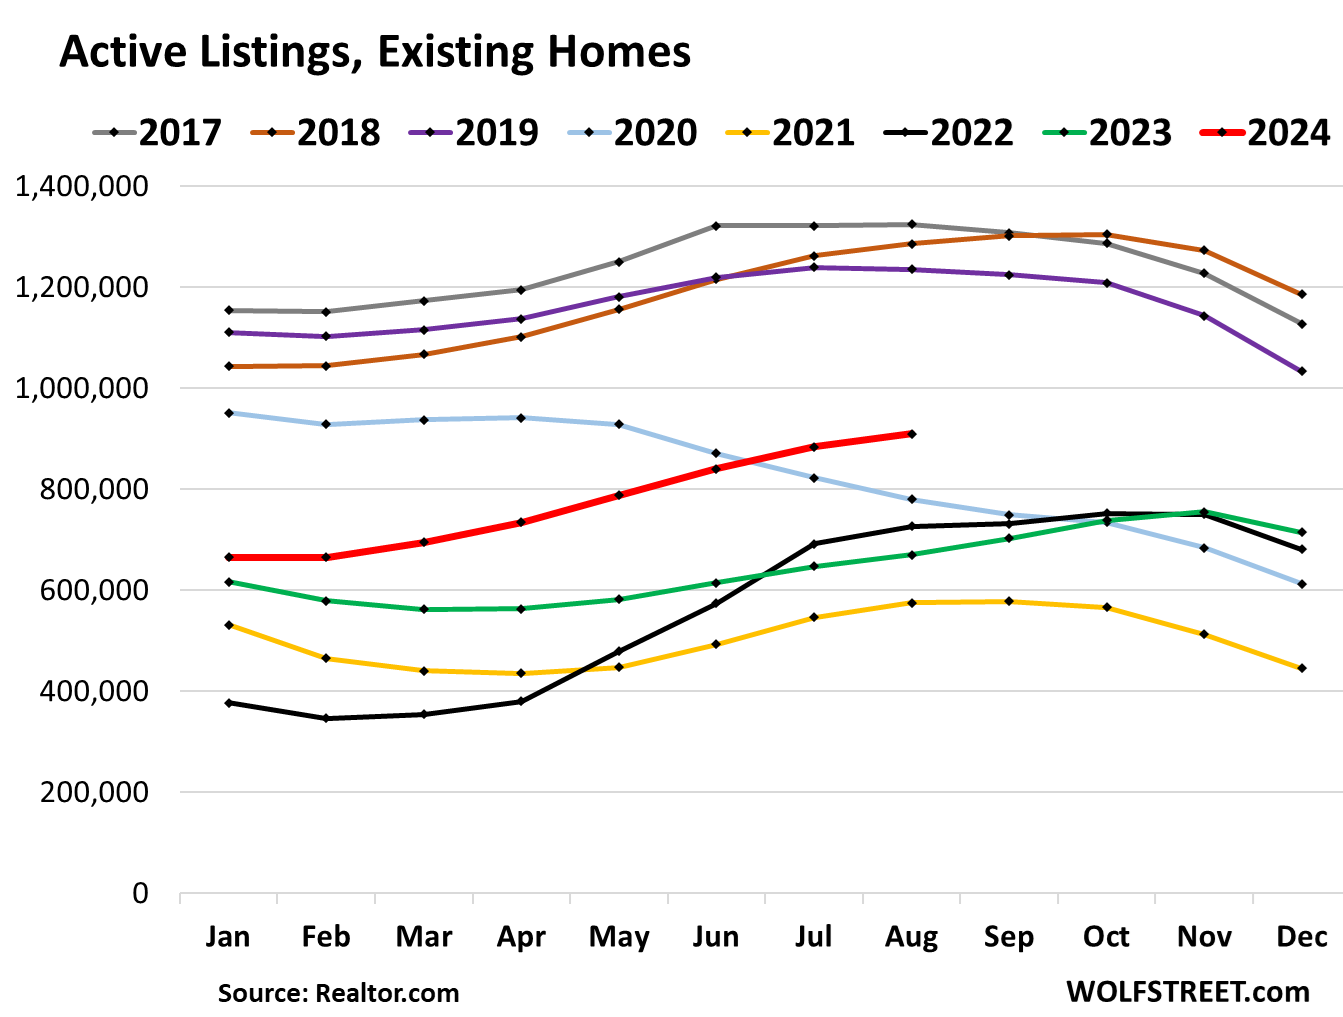

Active listings exploded year-over-year the most in Tampa (+90%) and San Diego (+80%).
Active listings have piled up largely because demand has collapsed at these prices, and homes are not selling. Sellers are piling properties into some markets, with new listings up 19% year-over-year in San Diego and 30% in Seattle, for example. But in other markets, sellers are trying to tell themselves that this too shall pass, and are hanging on to their vacant homes, waiting for better days.
These are the metros of the 50 biggest metros where active listings have surged the most. Changes in new listings in the right column; data for Las Vegas and Rochester metros not available (via Realtor.com):
| Metro Area, August 2024 | Active Listings
% YoY |
New Listings
% YoY |
| Tampa-St. Petersburg-Clearwater | 90% | -1% |
| San Diego-Chula Vista-Carlsbad | 80% | 19% |
| Orlando-Kissimmee-Sanford | 77% | 6% |
| Miami-Fort Lauderdale-Pompano Beach | 72% | 10% |
| Seattle-Tacoma-Bellevue | 69% | 30% |
| Jacksonville | 68% | -8% |
| Denver-Aurora-Lakewood | 67% | 5% |
| Charlotte-Concord-Gastonia | 62% | 9% |
| Atlanta-Sandy Springs-Alpharetta | 58% | 7% |
| Dallas-Fort Worth-Arlington | 51% | 12% |
| Phoenix-Mesa-Chandler | 50% | -36% |
| Raleigh-Cary | 49% | 0% |
| Sacramento-Roseville-Folsom | 49% | 11% |
| San Jose-Sunnyvale-Santa Clara | 45% | 5% |
| Memphis | 45% | -3% |
| Los Angeles-Long Beach-Anaheim | 42% | 16% |
| Cincinnati | 39% | 31% |
| San Antonio-New Braunfels | 38% | 2% |
| Riverside-San Bernardino-Ontario | 38% | 9% |
| Oklahoma City | 37% | 3% |
| New Orleans-Metairie | 36% | -5% |
| Columbus | 35% | 11% |
| Richmond | 34% | -6% |
| Louisville/Jefferson County | 33% | 7% |
| Houston-The Woodlands-Sugar Land | 32% | 11% |
| Birmingham-Hoover | 31% | 8% |
| San Francisco-Oakland-Berkeley | 31% | 10% |
| Indianapolis-Carmel-Anderson | 30% | -5% |
| Baltimore-Columbia-Towson | 29% | 4% |
| Portland-Vancouver-Hillsboro | 29% | -2% |
| Providence-Warwick | 27% | 1% |
| Boston-Cambridge-Newton | 26% | 5% |
| Austin-Round Rock-Georgetown | 26% | -13% |
| Minneapolis-St. Paul-Bloomington | 26% | -5% |
| Nashville-Davidson-Murfreesboro-Franklin | 25% | 23% |
| Pittsburgh | 24% | -1% |
| Washington-Arlington-Alexandria | 24% | 2% |
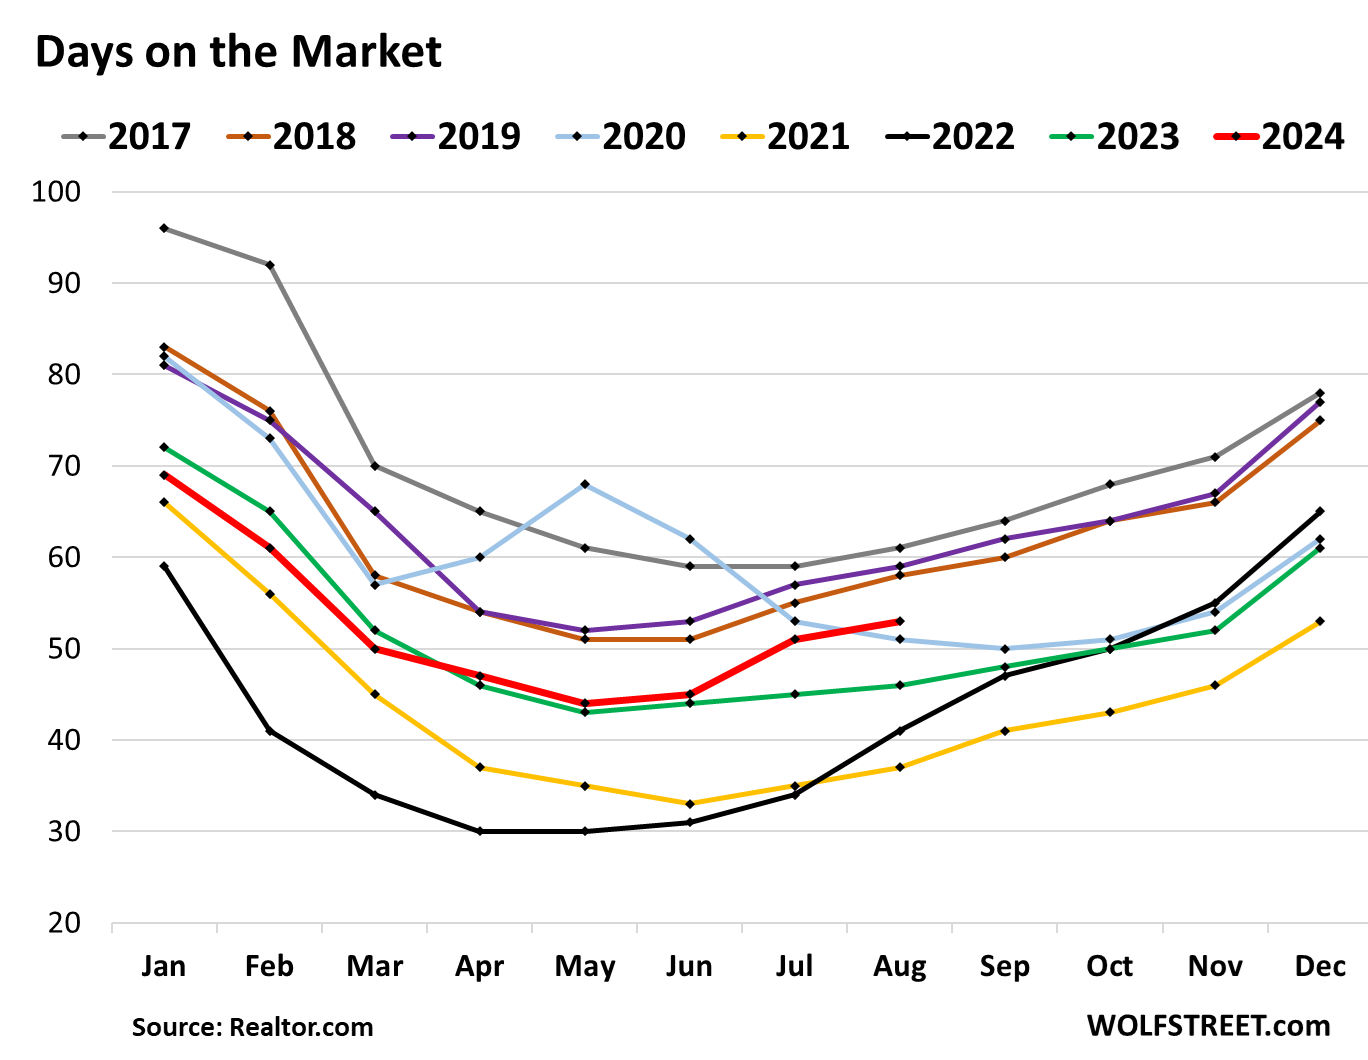
Median Days on the Market: The median number of days a property sits on the market for sale before it sells or before it is pulled off the market rose to 53 days, the highest for any August since 2019.
This number is kept down by sellers pulling their home off the market when it doesn’t sell after a few weeks, to then relist it later for sale at a lower price, or to try to rent it out, or turn it into a vacation rental (good luck on both), only to then relist it for sale.
So this metric doesn’t really show how long it takes to sell a property, but how aggressive sellers are in pulling their property off the market if it doesn’t sell. If sellers get more desperate to sell the property, they’ll leave it on the market and reduce prices until it sells.

Take the Survey at https://survey.energynewsbeat.com/