


Current Report
Oil and gas activity contracts slightly as uncertainty remains elevated

Special questions this quarter focus on changes to 2025 drilling plans, the impact of import tariffs on drilling plans and well costs, the expected impact of lower oil prices on oil production and service firm pricing and whether produced water management could constrain drilling and completion activity in the Permian Basin.
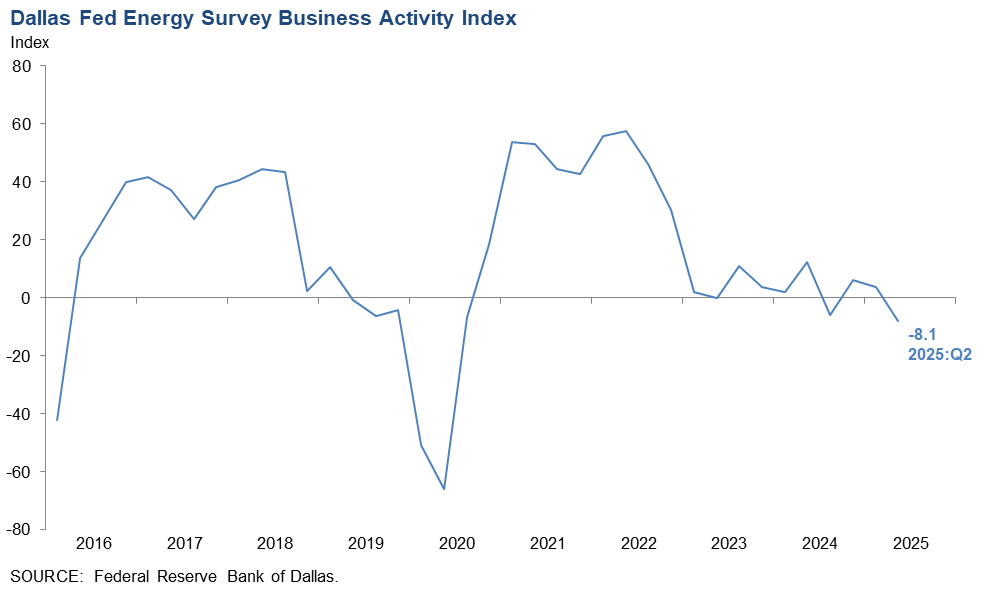
Activity in the oil and gas sector contracted slightly in the second quarter of 2025, according to oil and gas executives responding to the Dallas Fed Energy Survey. The business activity index, the survey’s broadest measure of the conditions energy firms face in the Eleventh District, turned negative, declining from 3.8 in the first quarter 2025 to -8.1 in the second.
Is Oil & Gas Right for Your Portfolio?
The company outlook index was little changed at -6.4, suggesting slight pessimism among firms. Meanwhile, the outlook uncertainty index increased 4 points to 47.1, indicating elevated uncertainty.
Oil and gas production decreased slightly in the second quarter, according to executives at exploration and production firms. The oil production index fell from 5.6 in the first quarter to -8.9 in the second quarter. Meanwhile, the natural gas production index also turned negative, declining from 4.8 to -4.5.
Among oilfield services firms, the input cost index increased from 30.9 to 40.0. This suggests input costs for oilfield services firms rose at a slightly faster pace than in the prior quarter. Among E&P firms, the finding and development costs index decreased slightly from 17.1 to 11.4. Also, the lease operating expenses index declined from 38.7 to 28.1. This suggests costs for E&P firms rose at a slower pace relative to the prior quarter.
Oilfield services firms reported modest deterioration in nearly all indicators. The equipment utilization index for oilfield services firms was relatively unchanged at -4.6. The operating margin index decreased from -21.5 to -33.4, indicating margins compressed at a faster rate. Meanwhile, the prices received for services index turned negative, falling from 7.1 to -17.7.
Overall, demand for employees fell slightly and those on the job tended to work fewer hours. The aggregate employment index declined from zero in the first quarter to -6.6 in the second. Additionally, the aggregate employee hours index decreased from 0.7 to -5.1. Meanwhile, the aggregate wages and benefits index remained positive but declined from 21.6 to 10.3.
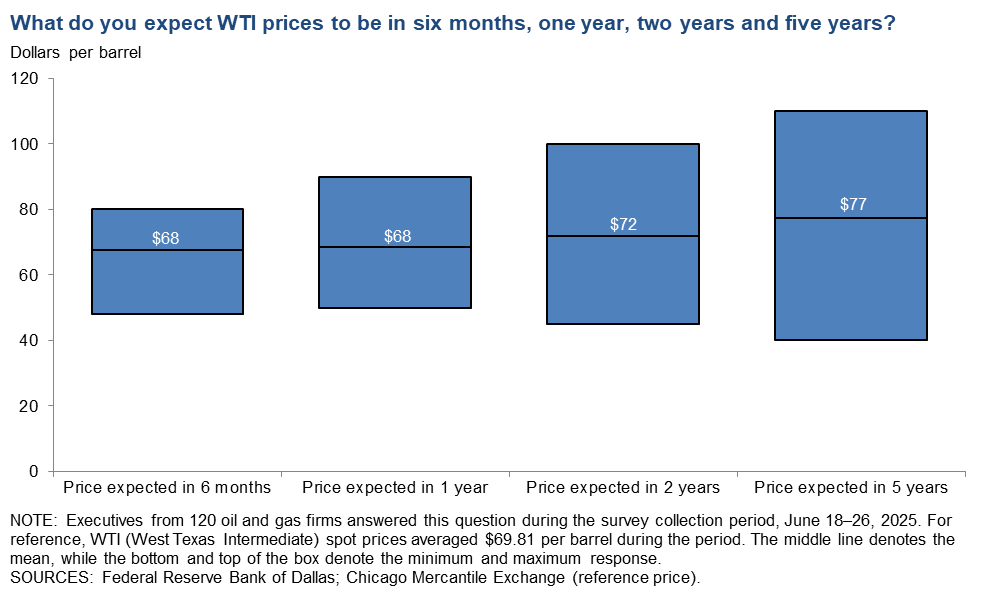
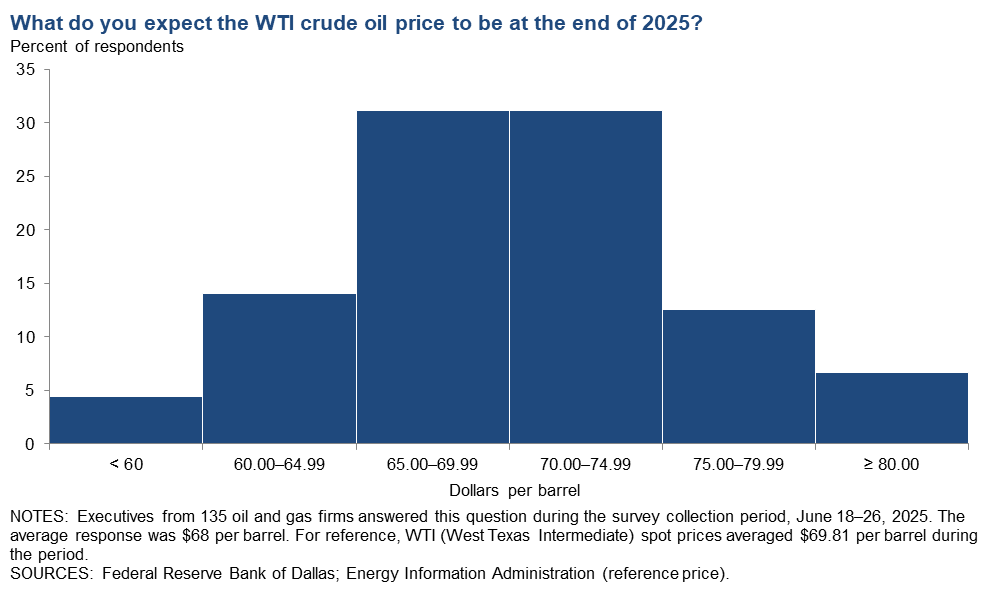
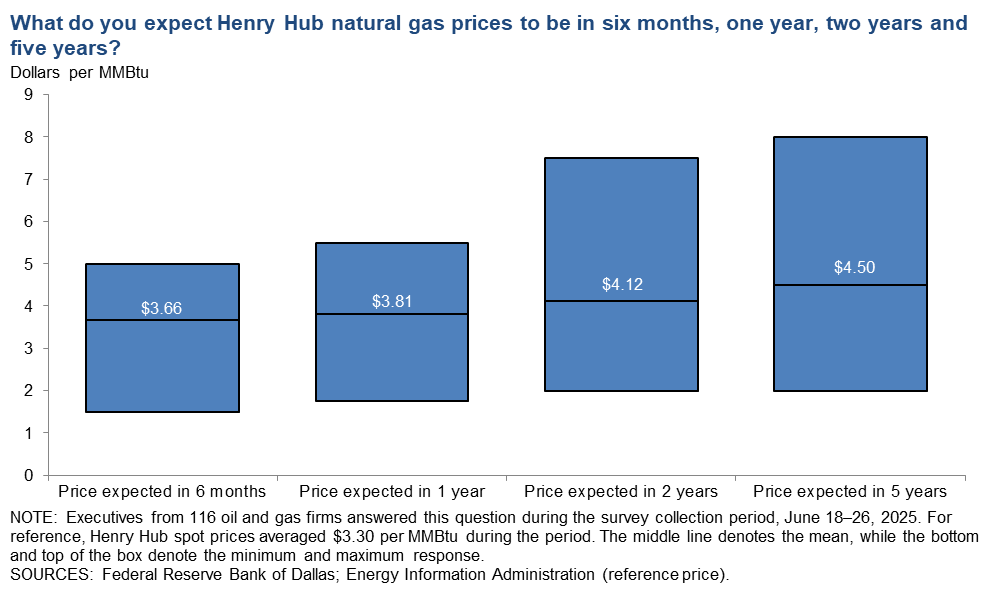
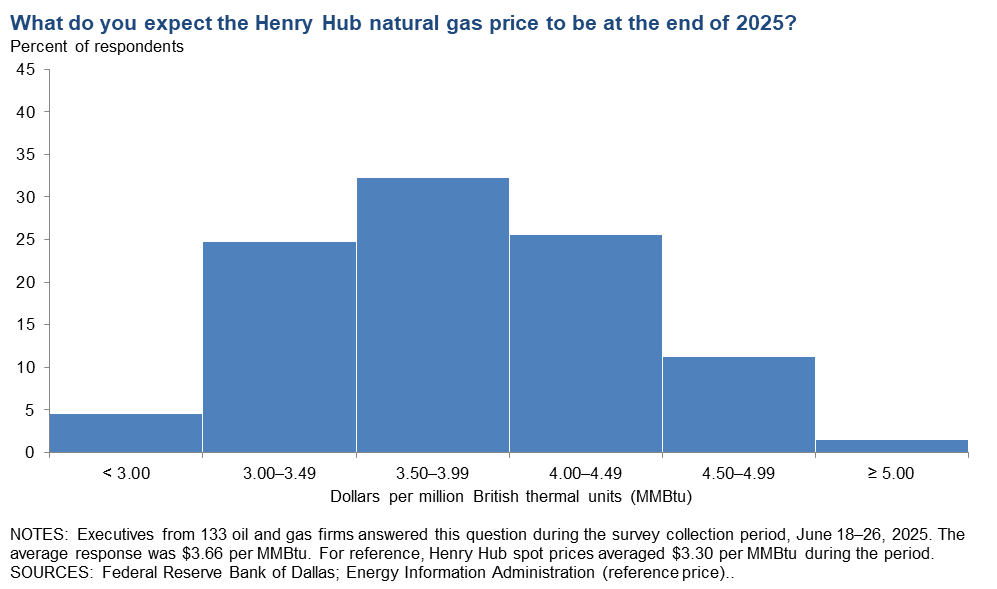
On average, respondents expect a West Texas Intermediate (WTI) oil price of $68 per barrel at year-end 2025; responses ranged from $50 to $85 per barrel. When asked about longer-term expectations, respondents on average said they expect a WTI oil price of $72 per barrel two years from now and $77 per barrel five years from now. Survey participants foresee a Henry Hub natural gas price of $3.66 per million British thermal units (MMBtu) at year-end 2025. When asked about longer-term expectations, respondents on average said they anticipate a Henry Hub gas price of $4.12 per MMBtu two years from now and $4.50 per MMBtu five years from now. For reference, WTI spot prices averaged $69.81 per barrel during the survey collection period, and Henry Hub spot prices averaged $3.30 per MMBtu.
Next release: September 24, 2025
Data were collected June 18–26, and 136 energy firms responded. Of the respondents, 91 were exploration and production firms and 45 were oilfield services firms.
TThe Dallas Fed conducts the Dallas Fed Energy Survey quarterly to obtain a timely assessment of energy activity among oil and gas firms located or headquartered in the Eleventh District. The Eleventh District encompasses Texas, northern Louisiana and southern New Mexico. Firms are asked whether business activity, employment, capital expenditures and other indicators increased, decreased or remained unchanged compared with the prior quarter and with the same quarter a year ago. Survey responses are used to calculate an index for each indicator. Each index is calculated by subtracting the percentage of respondents reporting a decrease from the percentage reporting an increase. When the share of firms reporting an increase exceeds the share reporting a decrease, the index will be greater than zero, suggesting the indicator has increased over the previous quarter. If the share of firms reporting a decrease exceeds the share reporting an increase, the index will be below zero, suggesting the indicator has decreased over the previous quarter.
Price Forecasts
West Texas Intermediate Crude

| West Texas Intermediate crude oil price, year-end 2025 | ||||
| Indicator | Survey Average | Low Forecast | High Forecast | Price During Survey |
| Current quarter | $68.18 | $50.00 | $85.00 | $69.81 |
| Prior quarter | $68.32 | $50.00 | $100.00 | $67.60 |
| NOTE: Price during survey is an average of daily spot prices during the survey collection period. SOURCES: Federal Reserve Bank of Dallas; Energy Information Administration. |
||||
Henry Hub Natural Gas
| Henry Hub natural gas price, year-end 2025 | ||||
| Indicator | Survey Average | Low Forecast | High Forecast | Price During Survey |
| Current quarter | $3.66 | $1.75 | $5.00 | $3.30 |
| Prior quarter | $3.78 | $2.00 | $5.25 | $4.10 |
| NOTE: Price during survey is an average of daily spot prices during the survey collection period. SOURCES: Federal Reserve Bank of Dallas; Energy Information Administration. |
||||
Special Questions
Data were collected June 18–26; 132 oil and gas firms responded to the special questions survey.
Exploration and production (E&P) firms
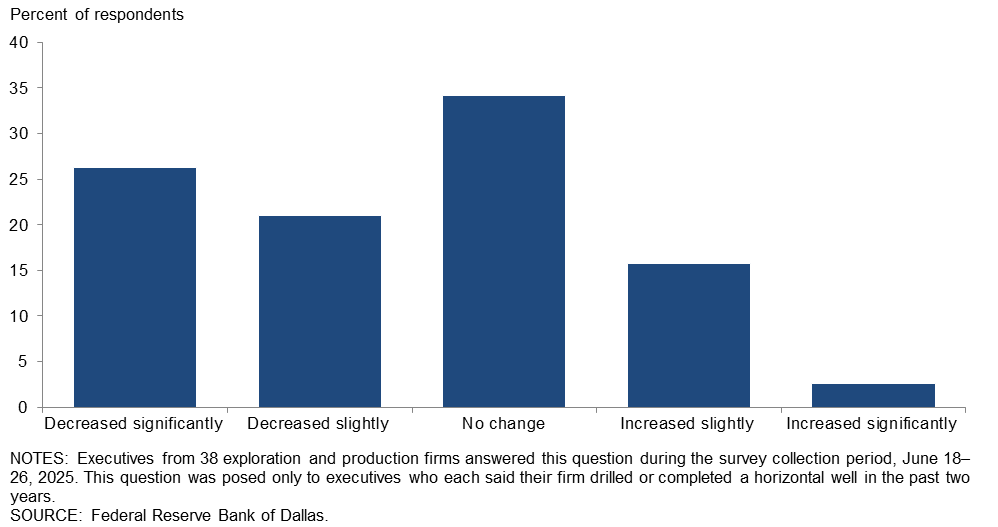
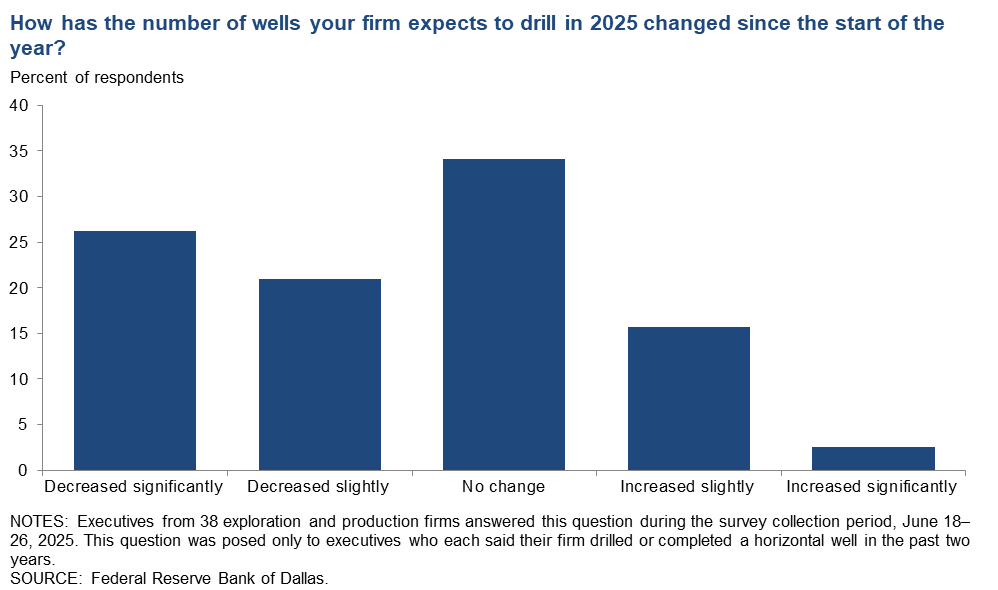
How has the number of wells your firm expects to drill in 2025 changed since the start of the year?
This question was posed only to E&P executives who each said their firm drilled or completed a horizontal well in the past two years. Firms were classified as “small” if they produced fewer than 10,000 barrels per day (b/d) and “large” if they produced 10,000 b/d or more. In the U.S., small E&P firms are greater in number, but large E&P firms represent the majority of production (more than 80 percent).
Almost half of executives surveyed expect to drill fewer wells in 2025 than they planned at the start of the year. Twenty-six percent said they expect the number of wells they drill to “decrease significantly,” and 21 percent said it would “decrease slightly.” Conversely, 16 percent said drilling expectations “increased slightly” and 3 percent said they “increased significantly.” Across all firms, 34 percent of executives said they anticipated “no change.”
The most selected response among large E&P firm executives was “decreased significantly,” while the most selected response among small E&P firm executives was “no change.” A breakdown of the data is shown below.

| Response | Percent of respondents (among each group) | ||
| All E&P | Large E&P | Small E&P | |
| Increased significantly | 3 | 0 | 4 |
| Increased slightly | 16 | 17 | 15 |
| No change | 34 | 8 | 46 |
| Decreased slightly | 21 | 33 | 15 |
| Decreased significantly | 26 | 42 | 19 |
| NOTES: Executives from 38 exploration and production firms answered this question during the survey collection period, June 18–26, 2025. Small E&P firms produced fewer than 10,000 barrels per day (b/d) in fourth quarter 2024, while large E&P firms produced 10,000 b/d or more. A total of 26 small firms and 12 large firms responded. This question was posed only to executives who each said their firm drilled or completed a horizontal well in the past two years. Percentages may not sum to 100 due to rounding. SOURCE: Federal Reserve Bank of Dallas. |
|||
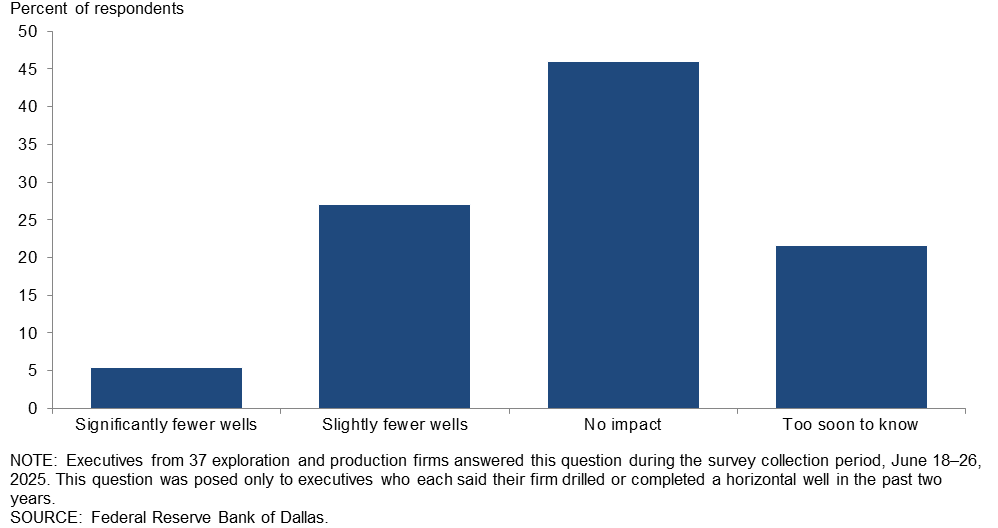
How will the recent increase in the steel import tariff from 25 percent to 50 percent affect the number of wells you expect your firm to drill over the second half of 2025?
Of those surveyed, 46 percent of executives expect the recent increase in the steel import tariff not to affect the number of wells their firms expect to drill over the second half of 2025. Twenty-seven percent expect to drill slightly fewer wells, and an additional 5 percent expect to drill significantly fewer wells due to the tariff increase. Twenty-two percent said it is too soon to know.
Executives at large E&P firms were more likely to select “no impact” relative to executives at small E&P firms.

| Response | Percent of respondents (among each group) | ||
| All E&P | Large E&P | Small E&P | |
| Significantly fewer wells | 5 | 0 | 8 |
| Slightly fewer wells | 27 | 25 | 28 |
| No impact | 46 | 50 | 44 |
| Too soon to know | 22 | 25 | 20 |
| NOTES: Executives from 37 exploration and production firms answered this question during the survey collection period, June 18–26, 2025. Small E&P firms produced fewer than 10,000 barrels per day (b/d) in fourth quarter 2024, while large E&P firms produced 10,000 b/d or more. Responses came from 25 small firms and 12 large firms. This question was posed only to executives who each said their firm drilled or completed a horizontal well in the past two years. SOURCE: Federal Reserve Bank of Dallas. |
|||
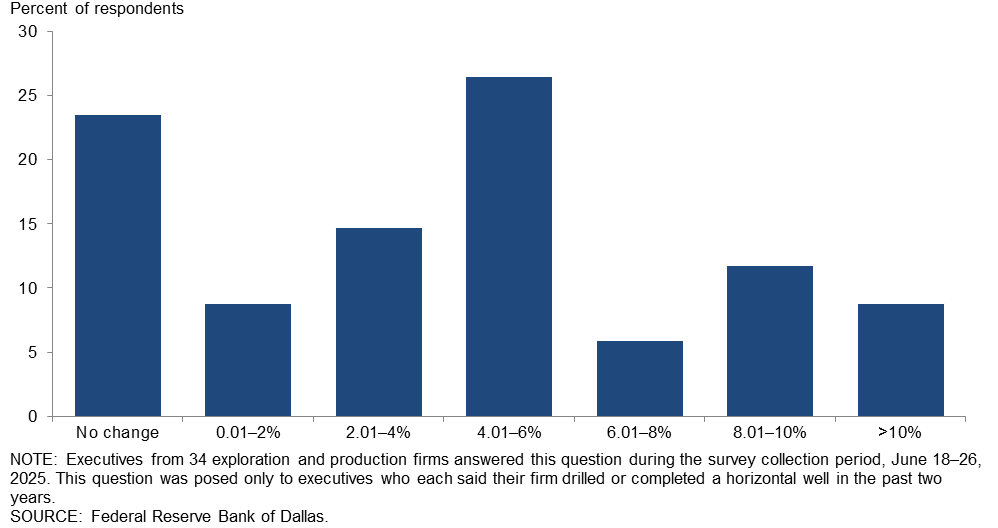
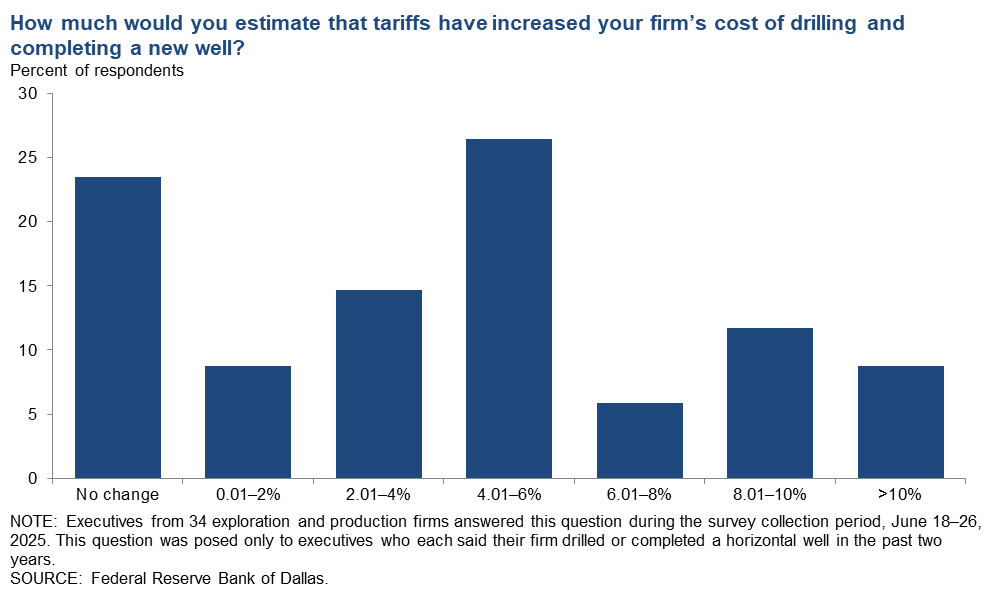
How much would you estimate that tariffs have increased your firm’s cost of drilling and completing a new well?
The most selected response was an increase of “4.01–6 percent” (26 percent of respondents), followed by “no change” (24 percent) and an increase of “2.01–4” percent (15 percent). A breakdown of the responses suggests costs have increased more for small E&P firms than for large E&P firms.
| Response | Percent of respondents (among each group) | ||
| All E&P | Large E&P | Small E&P | |
| No change | 24 | 27 | 22 |
| 0.01–2% | 9 | 0 | 13 |
| 2.01–4% | 15 | 18 | 13 |
| 4.01–6% | 26 | 45 | 17 |
| 6.01–8% | 6 | 0 | 9 |
| 8.01–10% | 12 | 9 | 13 |
| >10% | 9 | 0 | 13 |
| NOTES: Executives from 34 exploration and production firms answered this question during the survey collection period, June 18–26, 2025. Small E&P firms produced fewer than 10,000 barrels per day (b/d) in fourth quarter 2024, while large E&P firms produced 10,000 b/d or more. A total of 23 small firms and 11 large firms responded. This question was posed only to executives who each said their firm drilled or completed a horizontal well in the past two years. Percentages may not sum to 100 due to rounding. SOURCE: Federal Reserve Bank of Dallas. |
|||
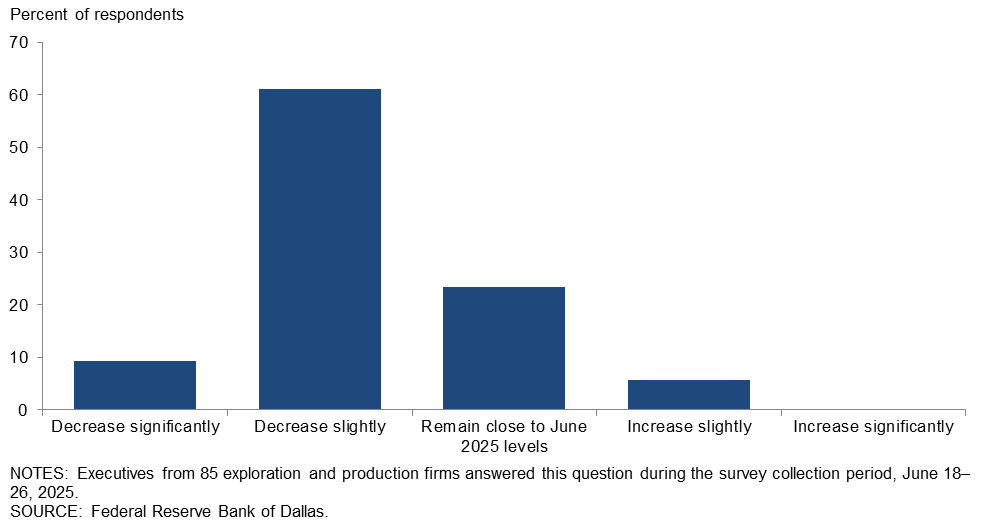
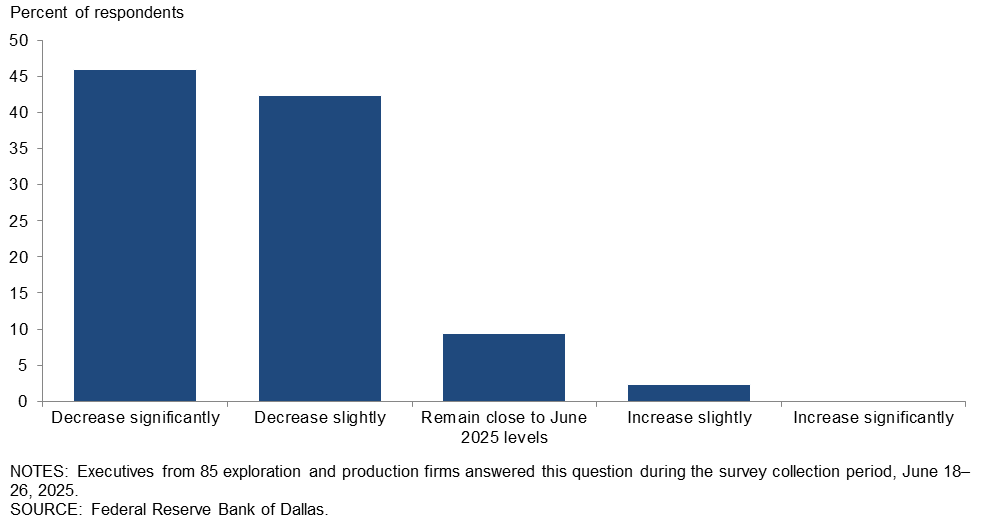
If the price of WTI oil were to remain at $60 per barrel over the next 12 months, what do you expect to happen to your firm’s oil production from June 2025 to June 2026?
A majority of executives—61 percent—expect their firms’ oil production would decrease slightly from June 2025 to June 2026 if the WTI price remained at $60 per barrel. Twenty-four percent expect production would remain close to June 2025 levels.
| Response | Percent of respondents (among each group) | ||
| All E&P | Large E&P | Small E&P | |
| Increase significantly | 0 | 0 | 0 |
| Increase slightly | 6 | 7 | 6 |
| Remain close to June 2025 levels | 24 | 21 | 24 |
| Decrease slightly | 61 | 57 | 62 |
| Decrease significantly | 9 | 14 | 8 |
| NOTES: Executives from 85 exploration and production firms answered this question during the survey collection period, June 18–26, 2025. Small E&P firms produced fewer than 10,000 barrels per day (b/d) in fourth quarter 2024, while large E&P firms produced 10,000 b/d or more. A total of 71 small firms and 14 large firms responded. Percentages may not sum to 100 due to rounding. SOURCE: Federal Reserve Bank of Dallas. |
|||
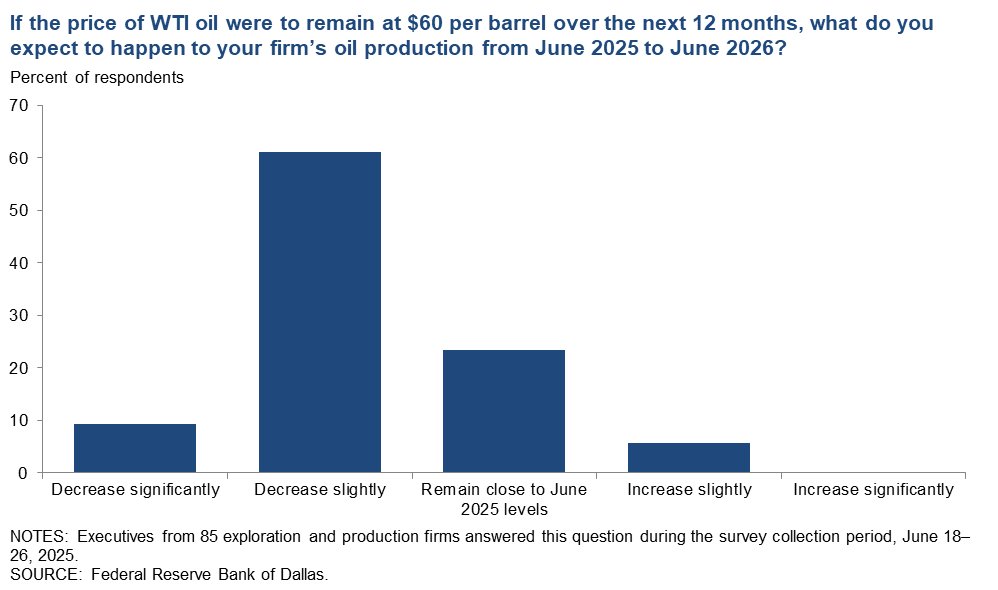
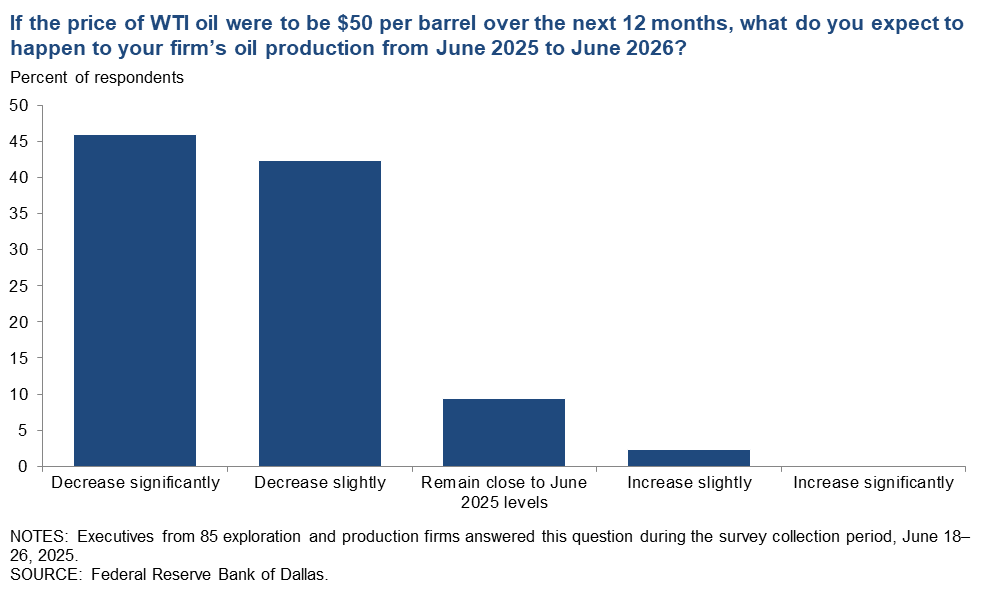
If the price of WTI oil were to be $50 per barrel over the next 12 months, what do you expect to happen to your firm’s oil production from June 2025 to June 2026?
A total of 46 percent of executives expect their firms’ oil production would decrease significantly from June 2025 to June 2026 if WTI were $50 per barrel. Another 42 percent anticipate their firms’ oil production would decrease slightly. The most selected response among executives at large E&P firms was “decrease slightly,” while among executives at small E&P firms it was “decrease significantly.”

| Response | Percent of respondents (among each group) | ||
| All E&P | Large E&P | Small E&P | |
| Increase significantly | 0 | 0 | 0 |
| Increase slightly | 2 | 0 | 3 |
| Remain close to June 2025 levels | 9 | 7 | 10 |
| Decrease slightly | 42 | 57 | 39 |
| Decrease significantly | 46 | 36 | 48 |
| NOTES: Executives from 85 exploration and production firms answered this question during the survey collection period, June 18–26, 2025. Small E&P firms produced fewer than 10,000 barrels per day (b/d) in fourth quarter 2024, while large E&P firms produced 10,000 b/d or more. A total of 71 small firms and 14 large firms responded. Percentages may not sum to 100 due to rounding. SOURCE: Federal Reserve Bank of Dallas. |
|||
Oil and gas support services firms
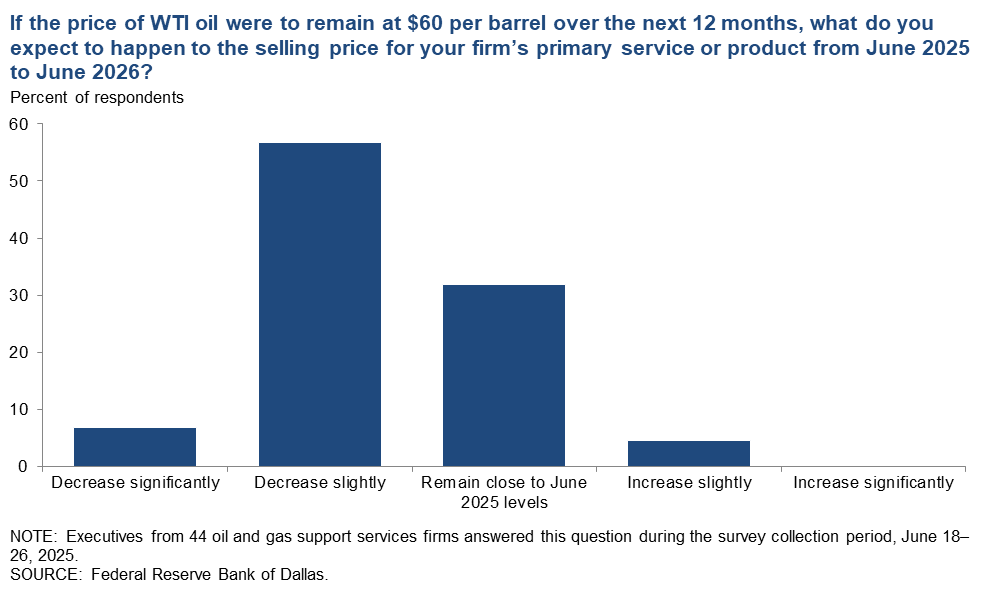
If the price of WTI oil were to remain at $60 per barrel over the next 12 months, what do you expect to happen to the selling price for your firm’s primary service or product from June 2025 to June 2026?
Most oil and gas support services executives—57 percent—expect the selling price for their firm’s primary service or product to decrease slightly from June 2025 to June 2026 if oil were $60 per barrel.

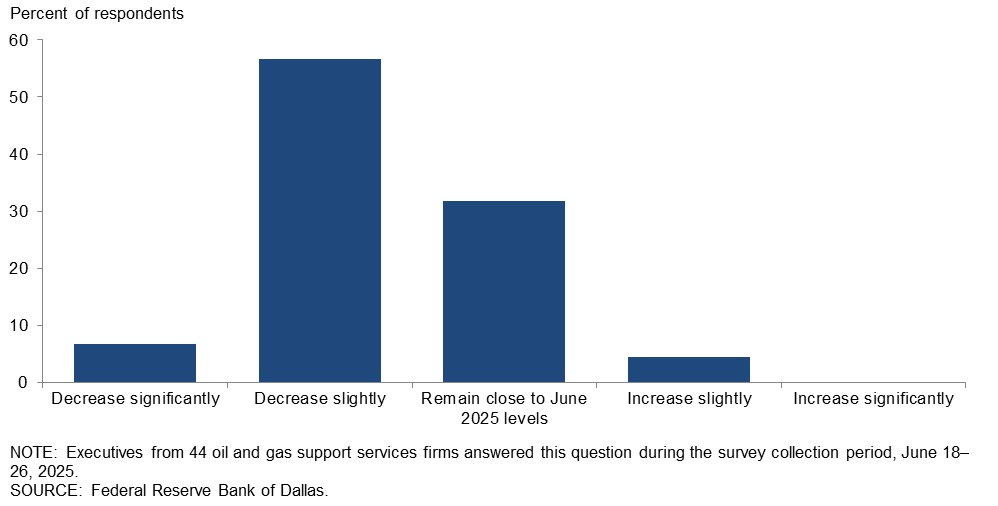
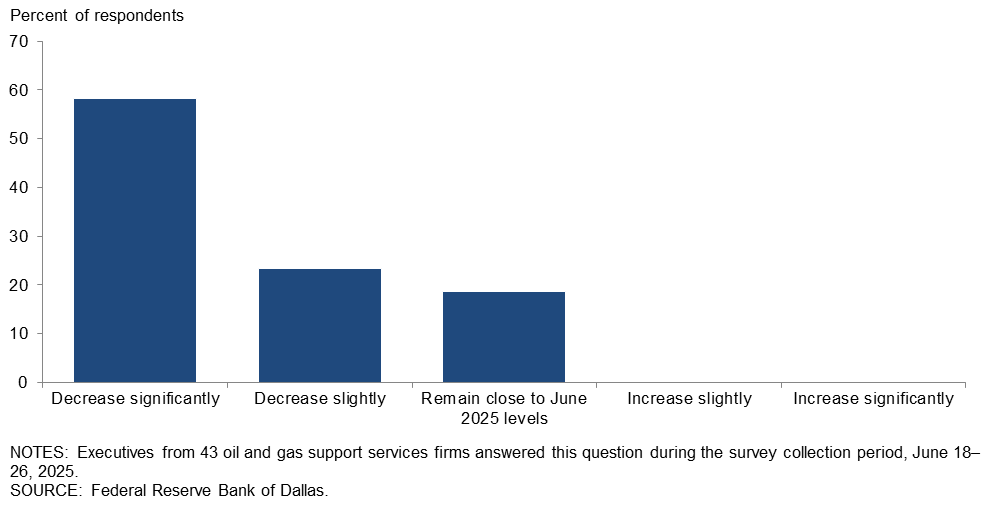
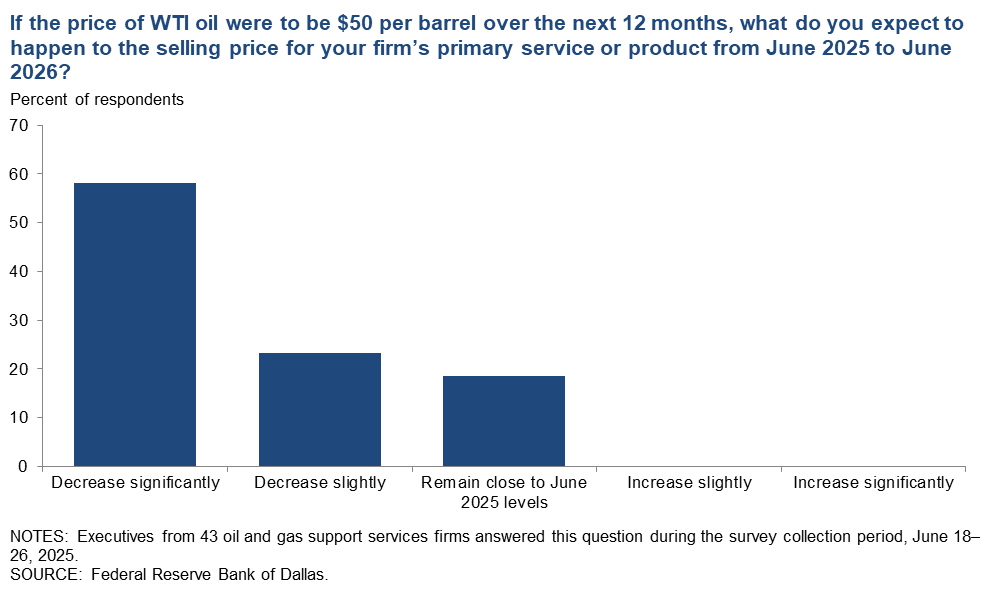
If the price of WTI oil were to be $50 per barrel over the next 12 months, what do you expect to happen to the selling price for your firm’s primary service or product from June 2025 to June 2026?
Most executives—58 percent—expect the selling price for their firm’s primary service or product to decrease significantly from June 2025 to June 2026 if oil were $50 per barrel.
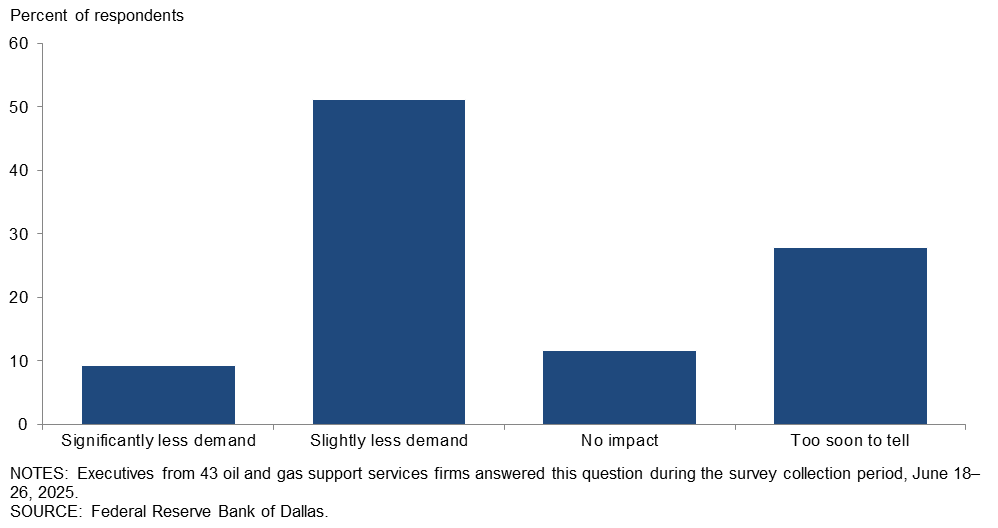
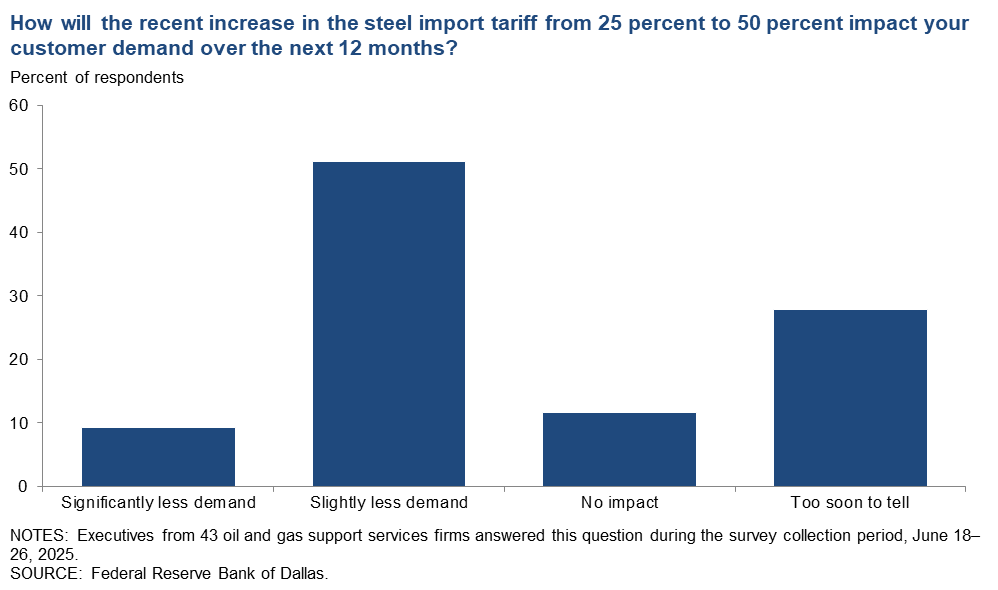
How will the recent increase in the steel import tariff from 25 percent to 50 percent impact your customer demand over the next 12 months?
A majority of executives—51 percent—expect the recent increase in the steel import tariff to result in slightly less customer demand over the next 12 months. Another 28 percent of executives said it is too soon to tell. Fewer respondents selected “no impact” and “significantly less demand.”
All firms
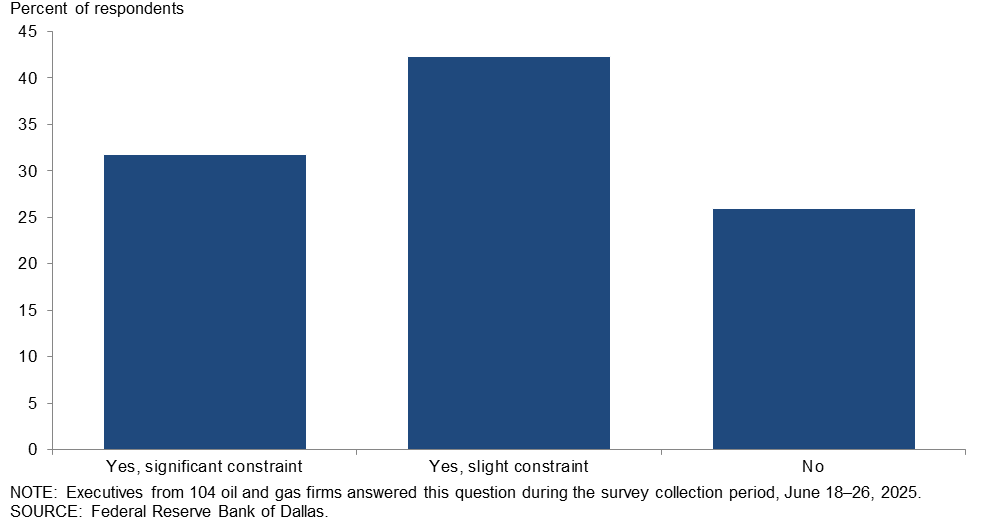
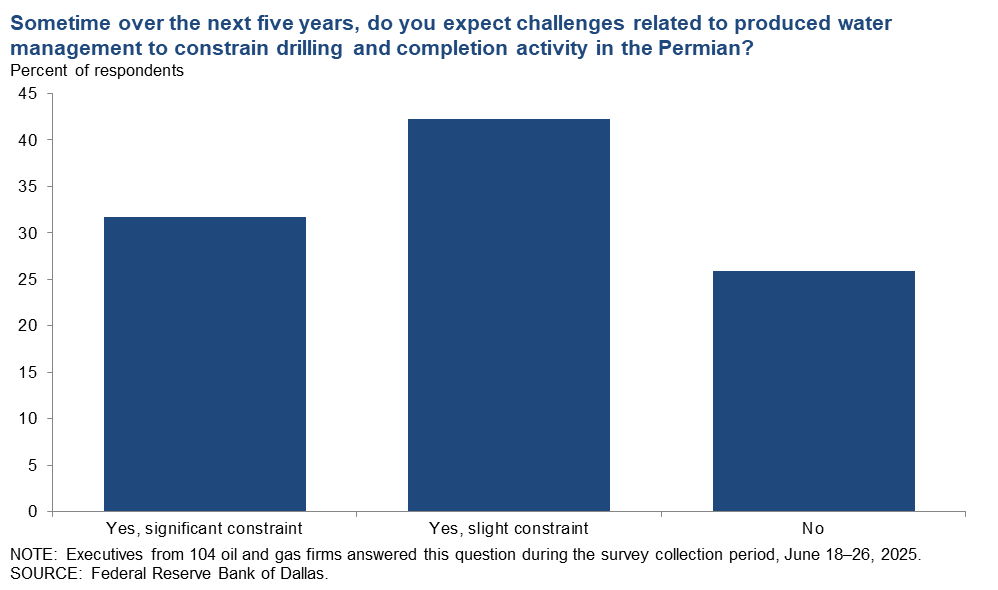
Sometime over the next five years, do you expect challenges related to produced water management to constrain drilling and completion activity in the Permian?
Most executives expect challenges related to produced water management to constrain drilling and completion activity in the Permian Basin sometime over the coming five years. Forty-two percent expect these challenges to slightly constrain activity, while 32 percent expect a significant constraint. Twenty-six percent expect no constraints. Large E&P firms were more likely to report they expect no constraints relative to small E&P firms and oilfield support service firms. A breakdown can be found below.
| Response | Percent of respondents (among each group) | |||
| All firms | Large E&P | Small E&P | Services | |
| Yes, significant constraint | 32 | 18 | 37 | 28 |
| Yes, slight constraint | 42 | 36 | 39 | 50 |
| No | 26 | 45 | 25 | 22 |
| NOTES: Executives from 68 exploration and production firms and 36 oil and gas support services firms answered this question during the survey collection period, June 18–26, 2025. Small E&P firms produced fewer than 10,000 barrels per day (b/d) in fourth quarter 2024, while large E&P firms produced 10,000 b/d or more. A total of 57 small E&P firms and 11 large E&P firms responded. Percentages may not sum to 100 due to rounding. SOURCE: Federal Reserve Bank of Dallas. |
||||
Special Questions Comments
Exploration and Production (E&P) Firms
- Despite higher steel prices, domestic mill output hasn’t increased much, which is creating inflationary pressures. U.S. steel producers should scale up production of steel and other steel products.
- It’s hard to imagine how much worse policies and D.C. rhetoric could have been for U.S. E&P companies. We were promised by the administration a better environment for producers but were delivered a world that has benefitted OPEC to the detriment of our domestic industry.
- We have already seen shallow injection zones significantly impact our development and future drilling plans.
- Water management continues to disrupt plans and add significant costs to completions. Also, flaring regulations need to be clearer.
- Costs take six to nine months to move. As to wastewater management, more and more companies are working to solve the issues and recycling is playing a larger part going forward.
- I am in the East Texas Basin, and a large portion of its shale gas being produced is within an area that is a potential disaster waiting to happen as to produced water management. The primary zone used in the counties along the Louisiana state line is the Rodessa-Gloyd. It is not an area with large production, yet it has been allowed to become way over-pressurized. Some, if not most, of the injection wells are doing so way over frack gradient pressures. That results in water being fracked up into other zones. They are now beginning to allow even shallower zones to be used for disposal, and those zones again are not sub-pressure. Another byproduct of this practice is that any effort to drill a well nearby is challenging due to the pressure one experiences at such shallow depths. The drilling mud has to be designed to accommodate an abnormal pressure. Doing so affects all the other zones due to the elevated mud weight. All the exposed zones become targets of mud ingestion. To resolve this, an operator has to run casing to wall off this issue within the well bore, and to do so greatly increases the cost to drill. This also risks impacting fresh drinking water tables even though there is surface casing in all wells. Produced water is not only very high in salt content but is exposed to oxygen due to trucking and storage in tanks. When salt water is mixed with free oxygen, it causes corrosion to any wells previously drilled that have casing exposed to the particular injected shallower zones. I am having to plug wells I own due to casing compromise almost yearly. This problem is happening in the West Texas Permian area with blowouts of older, plugged wells that were not plugged in a way that would control these issues.
- Produced water disposal is currently being used to kill projects in California. Therefore, this is not just a Permian issue, but is a national issue that is a recent ploy by certain parties to undermine aspects of the industry.
- On a worldwide basis, crude oil supplies will exceed demand forcing prices lower through 2026. Lifting sanctions on Iran sales of oil to China will decrease demand from other sources. Natural gas prices should start a gradually increasing through 2026, especially if associated gas supplies from the Permian Basin wane.
Oil and Gas Support Services Firms
- The significant drop in rig count has created a substantial inventory of spare equipment that will continue to sustain the few rigs working for many years. Continued cannibalizing will undermine any potential ramp-up of the rig count in the future.
- The uncertainty in casing prices is delaying drilling activity.
- It is a tough marketplace right now with most firms holding contractors down well below what they need to remain profitable.
- The numerous negative tailwinds—tariffs, over supply of oil, consolidation and turmoil surrounding economic policy—will have significant impact on the domestic energy sector. A lengthy downturn is the logical outcome.
Results Tables
Historical data are available from first quarter 2016 to the most current release quarter.
Business Indicators: Quarter/Quarter
| Business Indicators: All Firms Current Quarter (versus previous quarter) |
|||||
| Indicator | Current Index | Previous Index | % Reporting Increase |
% Reporting No Change |
% Reporting Decrease |
| Level of Business Activity | –8.1 | 3.8 | 19.3 | 53.3 | 27.4 |
| Capital Expenditures | –3.0 | 9.4 | 25.9 | 45.2 | 28.9 |
| Supplier Delivery Time | –0.7 | 3.2 | 6.8 | 85.7 | 7.5 |
| Employment | –6.6 | 0.0 | 9.6 | 74.3 | 16.2 |
| Employee Hours | –5.1 | 0.7 | 10.3 | 74.3 | 15.4 |
| Wages and Benefits | 10.3 | 21.6 | 16.9 | 76.5 | 6.6 |
| Indicator | Current Index | Previous Index | % Reporting Improved |
% Reporting No Change |
% Reporting Worsened |
| Company Outlook | –6.4 | –4.9 | 21.4 | 50.8 | 27.8 |
| Indicator | Current Index | Previous Index | % Reporting Increase |
% Reporting No Change |
% Reporting Decrease |
| Uncertainty | 47.1 | 43.1 | 59.6 | 27.9 | 12.5 |
| Business Indicators: E&P Firms Current Quarter (versus previous quarter) |
|||||
| Indicator | Current Index | Previous Index | % Reporting Increase |
% Reporting No Change |
% Reporting Decrease |
| Level of Business Activity | –4.4 | 6.9 | 17.8 | 60.0 | 22.2 |
| Oil Production | –8.9 | 5.6 | 21.1 | 48.9 | 30.0 |
| Natural Gas Wellhead Production | –4.5 | 4.8 | 21.3 | 52.8 | 25.8 |
| Capital Expenditures | 2.2 | 8.2 | 30.0 | 42.2 | 27.8 |
| Expected Level of Capital Expenditures Next Year | 10.0 | 18.2 | 36.7 | 36.7 | 26.7 |
| Supplier Delivery Time | –1.1 | 3.6 | 7.9 | 83.1 | 9.0 |
| Employment | –1.1 | –2.3 | 6.6 | 85.7 | 7.7 |
| Employee Hours | –1.1 | 1.1 | 7.7 | 83.5 | 8.8 |
| Wages and Benefits | 8.8 | 21.6 | 15.4 | 78.0 | 6.6 |
| Finding and Development Costs | 11.4 | 17.1 | 25.0 | 61.4 | 13.6 |
| Lease Operating Expenses | 28.1 | 38.7 | 36.0 | 56.2 | 7.9 |
| Indicator | Current Index | Previous Index | % Reporting Improved |
% Reporting No Change |
% Reporting Worsened |
| Company Outlook | –4.8 | –3.7 | 20.2 | 54.8 | 25.0 |
| Indicator | Current Index | Previous Index | % Reporting Increase |
% Reporting No Change |
% Reporting Decrease |
| Uncertainty | 43.9 | 40.9 | 56.0 | 31.9 | 12.1 |
| Business Indicators: O&G Support Services Firms Current Quarter (versus previous quarter) |
|||||
| Indicator | Current Index | Previous Index | % Reporting Increase |
% Reporting No Change |
% Reporting Decrease |
| Level of Business Activity | –15.6 | –2.3 | 22.2 | 40.0 | 37.8 |
| Utilization of Equipment | –4.6 | –4.8 | 22.7 | 50.0 | 27.3 |
| Capital Expenditures | –13.3 | 11.9 | 17.8 | 51.1 | 31.1 |
| Supplier Delivery Time | 0.0 | 2.4 | 4.5 | 90.9 | 4.5 |
| Lag Time in Delivery of Firm’s Services | 0.0 | 0.0 | 6.8 | 86.4 | 6.8 |
| Employment | –17.7 | 4.7 | 15.6 | 51.1 | 33.3 |
| Employment Hours | –13.3 | 0.0 | 15.6 | 55.6 | 28.9 |
| Wages and Benefits | 13.3 | 21.4 | 20.0 | 73.3 | 6.7 |
| Input Costs | 40.0 | 30.9 | 42.2 | 55.6 | 2.2 |
| Prices Received for Services | –17.7 | 7.1 | 6.7 | 68.9 | 24.4 |
| Operating Margin | –33.4 | –21.5 | 13.3 | 40.0 | 46.7 |
| Indicator | Current Index | Previous Index | % Reporting Improved |
% Reporting No Change |
% Reporting Worsened |
| Company Outlook | –9.5 | –7.1 | 23.8 | 42.9 | 33.3 |
| Indicator | Current Index | Previous Index | % Reporting Increase |
% Reporting No Change |
% Reporting Decrease |
| Uncertainty | 53.4 | 47.6 | 66.7 | 20.0 | 13.3 |
Business Indicators: Year/Year
| Business Indicators: All Firms Current Quarter (versus same quarter a year ago) |
|||||
| Indicator | Current Index | Previous Index | % Reporting Increase |
% Reporting No Change |
% Reporting Decrease |
| Level of Business Activity | –9.2 | 4.9 | 31.3 | 28.2 | 40.5 |
| Capital Expenditures | –1.6 | 15.0 | 32.0 | 34.4 | 33.6 |
| Supplier Delivery Time | 0.8 | 3.4 | 13.5 | 73.8 | 12.7 |
| Employment | –9.3 | 7.4 | 16.3 | 58.1 | 25.6 |
| Employee Hours | –7.7 | 5.6 | 13.1 | 66.2 | 20.8 |
| Wages and Benefits | 29.2 | 41.4 | 39.2 | 50.8 | 10.0 |
| Indicator | Current Index | Previous Index | % Reporting Improved |
% Reporting No Change |
% Reporting Worsened |
| Company Outlook | –8.3 | 0.0 | 26.7 | 38.3 | 35.0 |
| Business Indicators: E&P Firms Current Quarter (versus same quarter a year ago) |
|||||
| Indicator | Current Index | Previous Index | % Reporting Increase |
% Reporting No Change |
% Reporting Decrease |
| Level of Business Activity | –3.4 | 9.9 | 31.8 | 33.0 | 35.2 |
| Oil Production | –8.1 | 13.3 | 28.7 | 34.5 | 36.8 |
| Natural Gas Wellhead Production | –2.3 | 1.2 | 29.1 | 39.5 | 31.4 |
| Capital Expenditures | 5.9 | 16.2 | 36.5 | 32.9 | 30.6 |
| Expected Level of Capital Expenditures Next Year | 1.2 | 16.1 | 37.2 | 26.7 | 36.0 |
| Supplier Delivery Time | 0.0 | 1.3 | 13.1 | 73.8 | 13.1 |
| Employment | –1.2 | 6.1 | 14.9 | 69.0 | 16.1 |
| Employee Hours | 0.0 | 9.7 | 11.5 | 77.0 | 11.5 |
| Wages and Benefits | 25.3 | 40.2 | 34.5 | 56.3 | 9.2 |
| Finding and Development Costs | 17.8 | 21.7 | 34.5 | 48.8 | 16.7 |
| Lease Operating Expenses | 34.5 | 51.8 | 46.4 | 41.7 | 11.9 |
| Indicator | Current Index | Previous Index | % Reporting Improved |
% Reporting No Change |
% Reporting Worsened |
| Company Outlook | –6.3 | 1.4 | 25.0 | 43.8 | 31.3 |
| Business Indicators: O&G Support Services Firms Current Quarter (versus same quarter a year ago) |
|||||
| Indicator | Current Index | Previous Index | % Reporting Increase |
% Reporting No Change |
% Reporting Decrease |
| Level of Business Activity | –21.0 | –4.8 | 30.2 | 18.6 | 51.2 |
| Utilization of Equipment | –19.0 | –4.8 | 28.6 | 23.8 | 47.6 |
| Capital Expenditures | –16.2 | 12.5 | 23.3 | 37.2 | 39.5 |
| Supplier Delivery Time | 2.4 | 7.3 | 14.3 | 73.8 | 11.9 |
| Lag Time in Delivery of Firm’s Services | –2.4 | –2.5 | 7.1 | 83.3 | 9.5 |
| Employment | –26.2 | 10.0 | 19.0 | 35.7 | 45.2 |
| Employment Hours | –23.2 | –2.4 | 16.3 | 44.2 | 39.5 |
| Wages and Benefits | 37.2 | 43.9 | 48.8 | 39.5 | 11.6 |
| Input Costs | 41.9 | 55.0 | 53.5 | 34.9 | 11.6 |
| Prices Received for Services | –14.0 | 7.3 | 18.6 | 48.8 | 32.6 |
| Operating Margin | –38.1 | –20.5 | 14.3 | 33.3 | 52.4 |
| Indicator | Current Index | Previous Index | % Reporting Improved |
% Reporting No Change |
% Reporting Worsened |
| Company Outlook | –12.5 | –2.5 | 30.0 | 27.5 | 42.5 |
Activity Chart
Comments
Comments from Survey Respondents
Survey participants are given the opportunity to submit comments on current issues that may be affecting their businesses. Some comments have been edited for grammar and clarity. Comments from the Special Questions survey can be found below the special questions.
Exploration and Production (E&P) Firms
- There are a variety of issues affecting our business. First, heightened uncertainty stemming from OPEC+ unwinding production cuts, trade and tariff changes, and escalating geopolitical tensions are affecting our firm. Second, the deflationary environment continues despite trade, tariff and macroeconomic uncertainty. Third, we expect Lower 48 oil-focused activity, spending and service costs to decline in the second half of 2025. Fourth, industry mergers and acquisitions are expected to remain lukewarm in the second half of 2025 due to uncertainty on several fronts.
- The Liberation Day chaos and tariff antics have harmed the domestic energy industry. Drill, baby, drill will not happen with this level of volatility. Companies will continue to lay down rigs and frack spreads.
- There is constant noise coming from the administration saying $50-per-barrel oil is the target. Everyone should understand that $50 is not a sustainable price for oil. It needs to be mid $60s.
- There is too much uncertainty in the market.
- Increased steel costs and other costs for drilling wells are affecting our business. The increased costs change the production economics.
- Encouraging natural gas exports to Europe and Asia would help Texas and help balance trade and create better political ties and natural gas prices.
- Tariffs are increasing our tubular costs. We’ve noticed a sharp increase in our electrical power costs and unit rates (dollars per kilowatt hour) in Texas and Oklahoma. West Texas saltwater disposal costs have rapidly increased to injurious levels putting strong pressure on margins.
- The current political uncertainty is causing apprehension and concern about small, independent oil and gas companies’ economic viability.
- Political turmoil is not beneficial. We are dealing with warring bureaucracies, with each trying to exert their specific agendas and effectively prevent progress.
- Service costs are low and wells are very economic, but there are inventory challenges (lack of) for small operators like us.
- We are spending way too much time and resources on trying to predict the price of oil. We dropped our rig count 50 percent. Also, suppliers are being squeezed, and there is a concern some of our vendors will not survive.
- The recent volatility in commodity futures has made it challenging to reach agreement on transaction pricing between buyers and sellers. However, for natural-gas-weighted assets, pricing above $3.00/Mcf is generally viewed as a marked improvement over 2024. As a result, we’ve seen more productive negotiations and acquisition activity in this segment, particularly with the healthy rebound in natural gas strip pricing since early 2025.
- Global conflicts have helped increase crude oil prices.
- With the pending Middle East conditions and war events, it is not possible to predict the future. The escalation of events is of such an expanding nature and clearly of a magnitude that can produce consequences beyond reasonable prediction. It will have multiple impacts in energy and especially for oil.
- All bets (and answers) are off if Iran escalates attacks and the conflict spreads to other countries in the Middle East.
- If the Federal Reserve would lower interest rates, the oil patch would see a jump as the economy recovers to a higher level. Interest rates are holding the oil industry and the economy as a whole back.
- Thank God the previous administration is gone and so are their anti-energy policies!
- Oil and gas markets look good in the long term (two to five years out). Short term 2025 and 2026 will have a lot of volatility.
- The Middle East situation is unpredictable, causing uncertainty for oil prices based on access to open oil markets, especially Iran and Straight of Hormuz containment. Supply-demand barrels are difficult to project.
- As expected, war in the Middle East has placed an uncertain moment into the equation of supply and demand. However, I personally feel the outcome will not last long due to Iranian efforts being destroyed. I think a last-ditch effort for vengeance could be attacks on oil and gas fields of nearby countries. Also, access to the Strait of Hormuz could be impacted for a period of time.
Oil and Gas Support Services Firms
- Tariffs are increasing our product costs. Despite efforts to mitigate their impact, the scale and breadth of the tariffs have forced us to pass these costs on to our customers. This comes at a time when the economics of oil and gas production are already challenged due to the dynamics of global oil supply and demand. Our U.S. manufacturing base and operations have been negatively impacted by tariffs. Many of our locally manufactured items contain components, steel and aluminum sourced outside of the United States because they do not have domestically-sourced alternatives. Despite efforts to mitigate the impact, the costs are moving through the value stream and affecting our customer base during a period of reduced profitability due to the general oversupply of oil in the current market.
- Private and smaller oilfield services firms (OFS) and contract drilling companies are rapidly failing and going out of business. This will eventually undermine our country’s tremendous ability to ramp up when and if the need for increased production arises.
- Our biggest issues are the steel tariffs we are absorbing as an oilfield services company. Our customers (exploration and production firms, or E&Ps) are refusing to help absorb these costs. E&Ps continue to speak out of both sides of their mouths. They talk partnership but are treating their vendors like second-class citizens, pushing OFS to unsustainable margins.
- E&P customers are delaying activity due to steel tariffs.
- Macro and geopolitical issues are creating significant uncertainty, hence E&P spending is going down.
- The long-term costs for transportation and disposal of produced water are increasing. It’s safe to now add water takeaway to the list of significant logistical challenges that producers are forced to deal with in the Permian Basin.
- We have seen a noticeable shift in overall activity due to a decrease in oil prices and overall macro uncertainty. We work with many of the large E&P companies; their employees are bracing for looming job reductions, which feeds further unrest for service and equipment providers.
- This is interesting timing for this survey. Generally, we feel a slowdown is coming in our business sector (oil and gas service companies) in the late third quarter. However, with the recent happenings in the Middle East and the potential for even more unrest in the area, that slowdown may be delayed. We do feel that a slowdown in our sector is coming, though.
- While the overall rig count dropped, we see more of that drop coming from the larger operators and, with that, a chance for the smaller operators to pick up rigs at better prices. In our market (smaller operators) we feel like this environment provides opportunity. We are hopeful that more carve-outs from last year’s M&A bonanza continue to create deals for the smaller and more nimble operators to prove up non-core divestitures.
- Our Permian Basin business outlook has declined in light of lower West Texas Intermediate (WTI), but our utilization has improved year to date. However, our Haynesville business including utilization has increased substantially year to date, driven by better Henry Hub natural gas prices, customer activity and an improved outlook for U.S. natural gas.
- With the ongoing war in Iran, it appears oil and natural gas prices may be higher than originally anticipated.
- The price of oil is an issue affecting our business.
- Price volatility and the ability to plan is an issue, more so than previous years.
Is Oil & Gas Right for Your Portfolio?
Crude Oil, LNG, Jet Fuel price quote
ENB Top News
ENB
Energy Dashboard
ENB Podcast
ENB Substack