


By Wolf Richter for WOLF STREET:
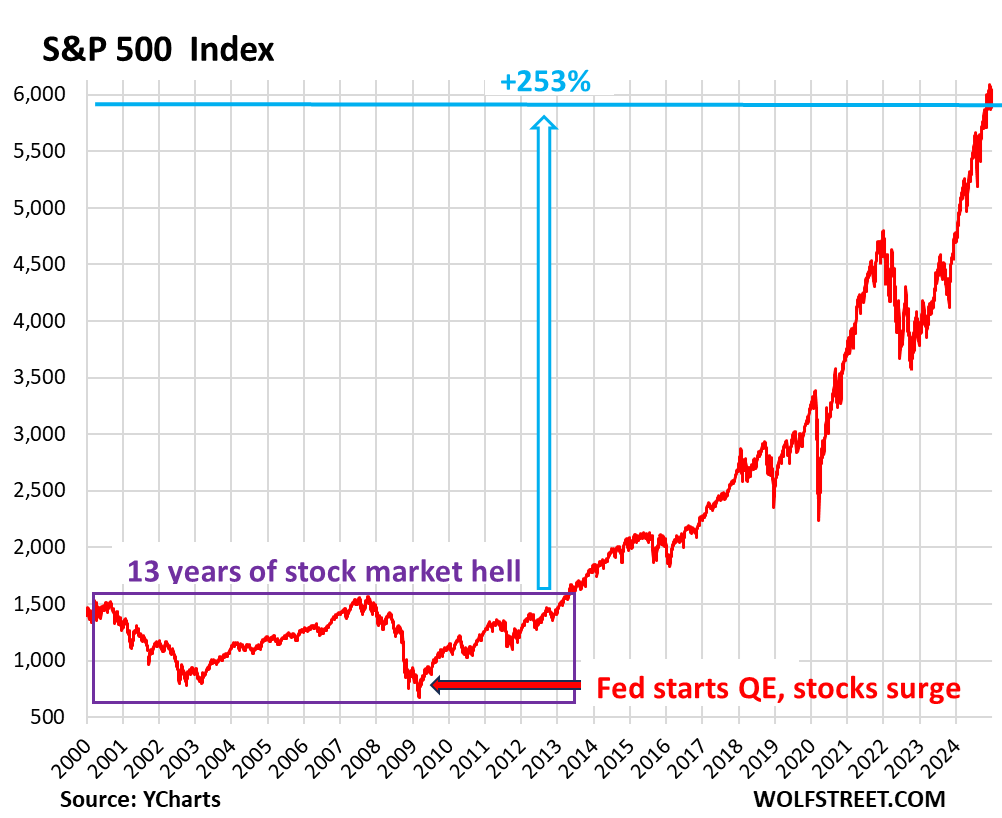
The S&P 500 gained 24% in 2024 and 53% over 2023 and 2024 combined, which was a huge two-year gain, reminiscent of the Dotcom bubble at the end of the 1990s, after which the S&P 500 spent 13 years in stock-market hell on a rollercoaster to nowhere with two 50%-crashes in between (purple box in the chart below).
But money-printing fixed all that. The S&P 500 has surged 253% since May 2013, which was when the S&P 500 finally surpassed its March 2000 high in a sustained manner (index data via YCharts).
Since the Fed started bombarding the markets with liquidity via QE in 2009, and other central banks followed in its footsteps, the S&P 500 has become the global standout amid the major foreign markets. But the Fed switched to QT and has so far unloaded $2.1 trillion; other central banks have switched to QT as well, including the ECB, which has unloaded €2.48 trillion.

Foreign stock markets.
Stock markets are valued in local currency. For USians investing their USD overseas, exchange rates are part of the bet. So we’re also going to look at the impact of USD exchange rates for USD investors in Japanese and Indian stocks.
Japanese and Indian stocks have surged in local currency since 2010, but the currencies have seen large-scale declines over the years against the USD, and that has tarnished the returns for USians (all data below via Investing.com).
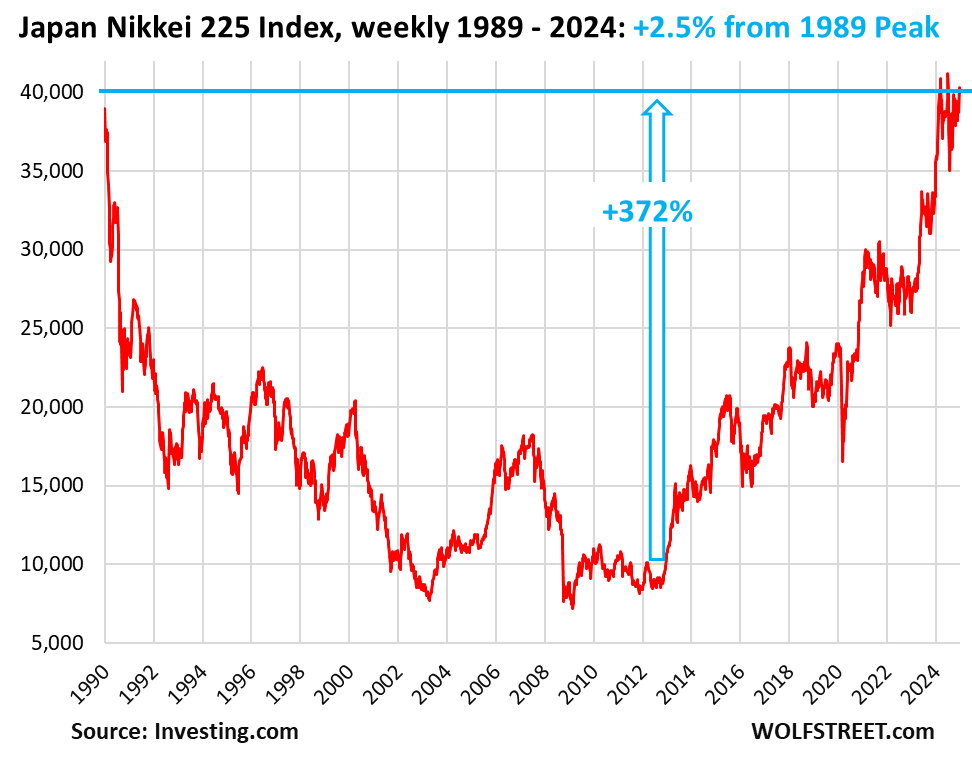
Japan’s Nikkei 225 ended the year 2.5% above the 1989 peak:
- Closed 2024 at 39,895
- Gain in 2024: 19%
- Gain in 2023: +28%
- Gain since 2012, start of Abenomics: 372%
- Gain since December 1989: +2.5%.
It took the huge amount of money-printing by the Bank of Japan starting in 2012 under the doctrine of Abenomics, including equity ETF purchases, to get this index to recover to its 1989 bubble high.
Now inflation is back in Japan. The BOJ ended QE in the first half of 2024 and started QT in the second half of 2024. And the yen has plunged against the dollar.


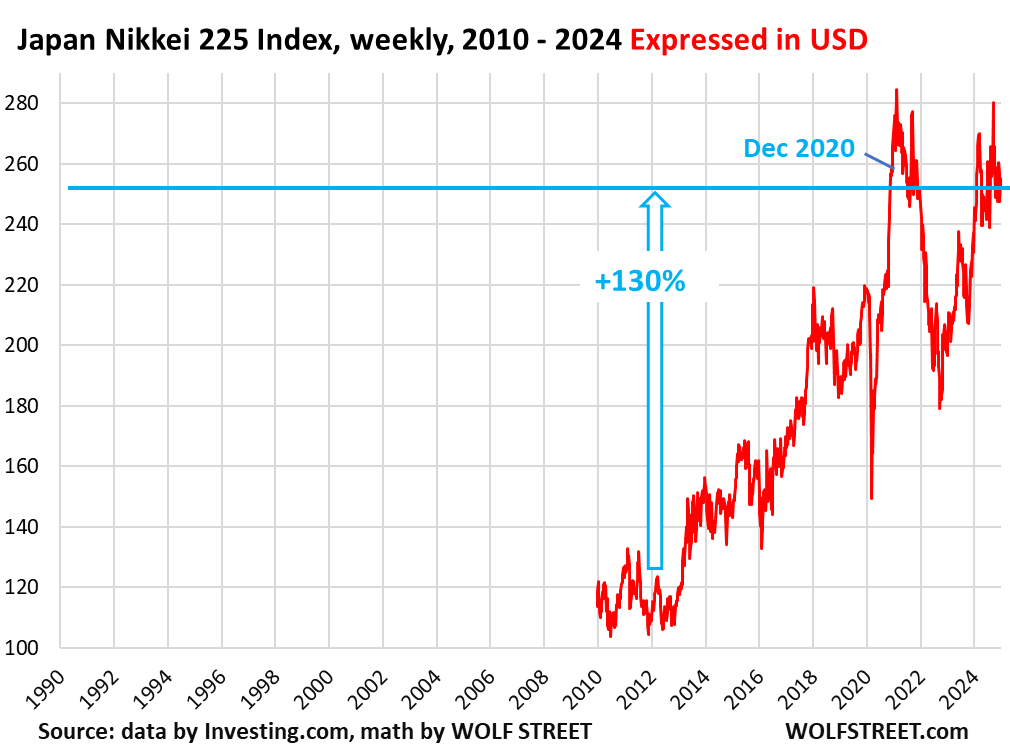
Back in early 2012, when the massive money-printing spree took off, the JPY-USD exchange rate was ¥90 to $1. Now it’s ¥158 to $1. In other words, over those 12 years, the yen’s value against the dollar has collapsed by 43%. A substantial portion of that collapse took place over the past three years.
For USD-based investors in Japanese stocks, that 372% gain in yen since the beginning of 2012 shrivels to a gain of 130% in USD terms.
Here is the Nikkei 225 index expressed in USD since 2010. I left it on the same time axis as the chart above to make it easier to compare. Note how the massive plunge in the yen over the past three years left USD-based investors below December 2020 (each Nikkei 225 value adjusted by the exchange rate at the time):

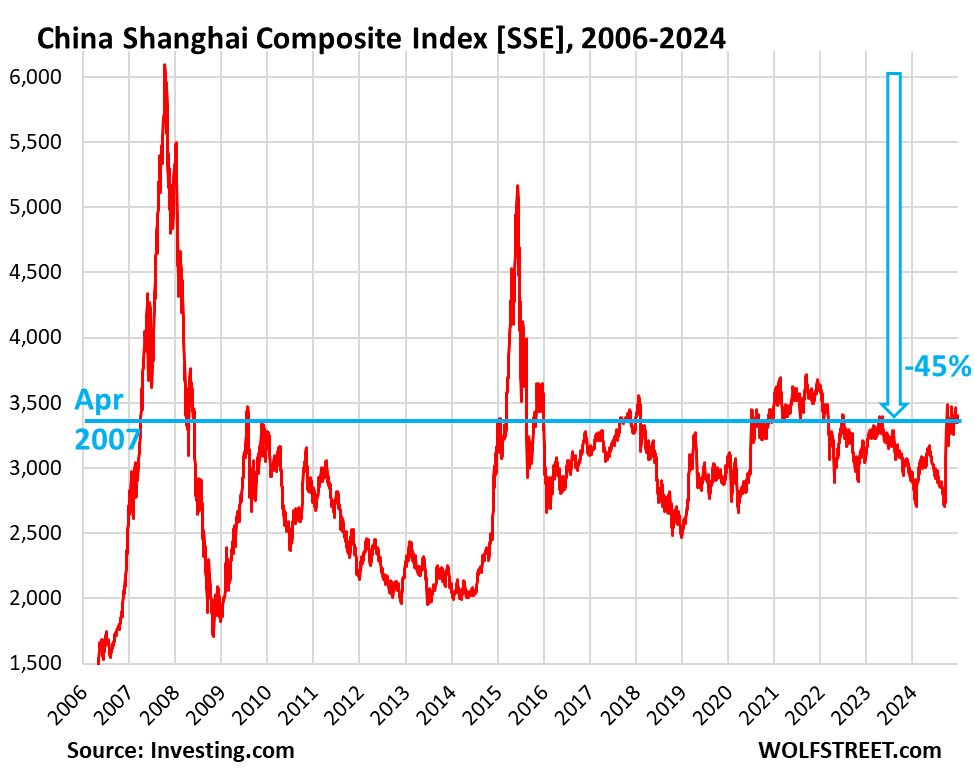
China’s Shanghai Stock Exchange (SSE), -45% from 2007 high:
- Closed 2024 at 3,351
- Year-over-year: +12.6%
- From October 2007 all-time high: -45%
- Back where it had first been in April 2007

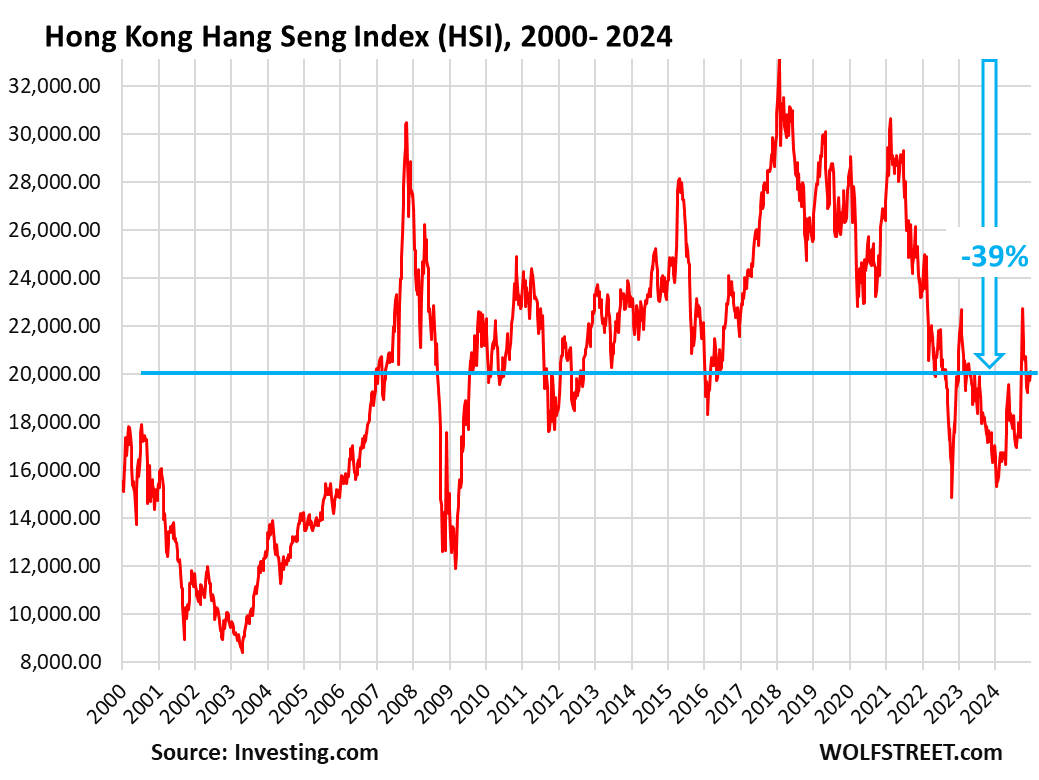
Hong Kong’s Hang Seng Index (HSI), -34% from the 2007 high:
- Closed 2024 at 20,059
- Year-over-year: +21.3%
- From all-time high, January 2018: -39%
- From prior all-time high in 2007: -34%
- Back where it had first been in December 2006.

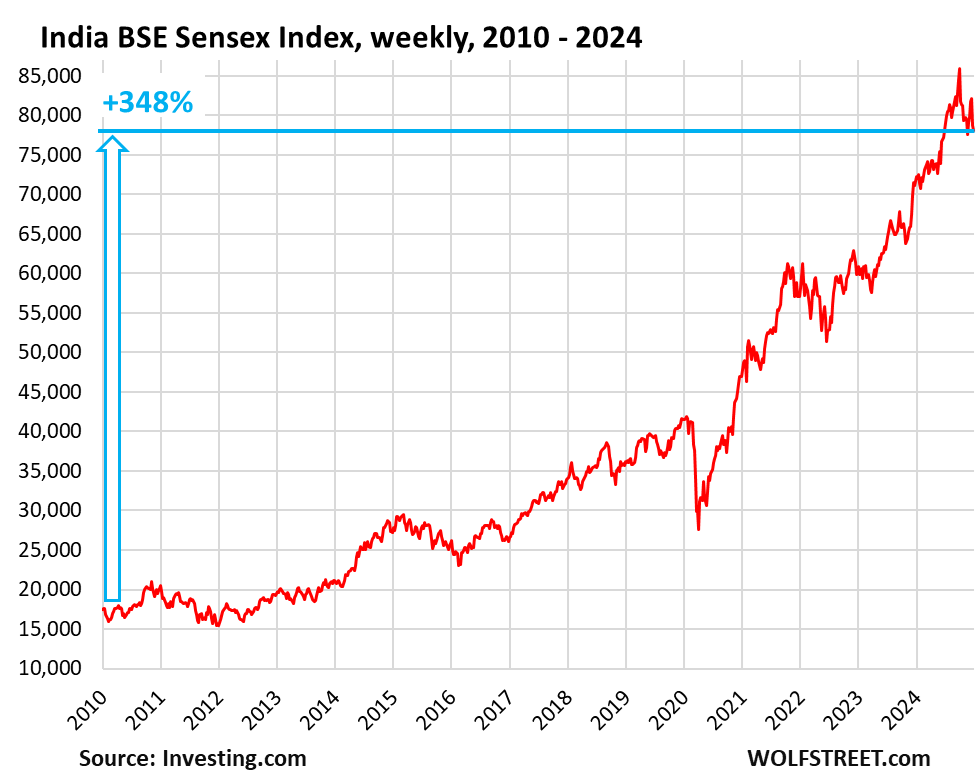
India’s BSE Sensex Index, +348% since 2010. But the rupee swooned.
- Closed 2024 at 78,169
- Year-over-year: +8.2%
- Since all-time high in Sept 2024: -9.1%
- Since 2010: +348%

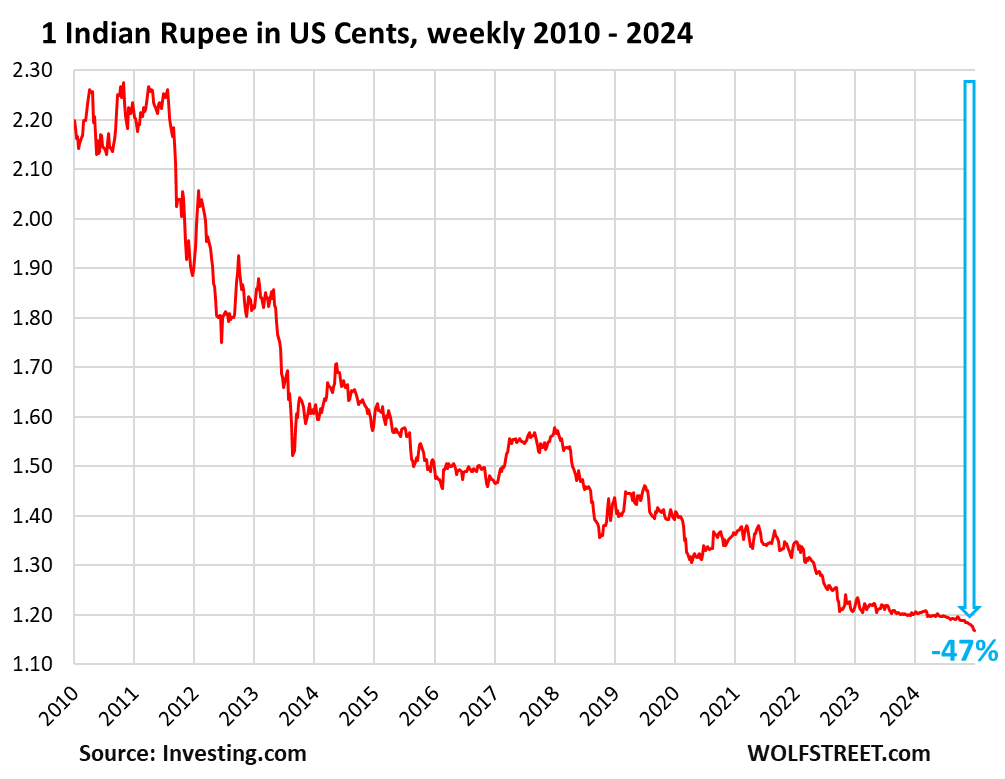
But the Indian rupee lost nearly half its value against the USD since 2010:

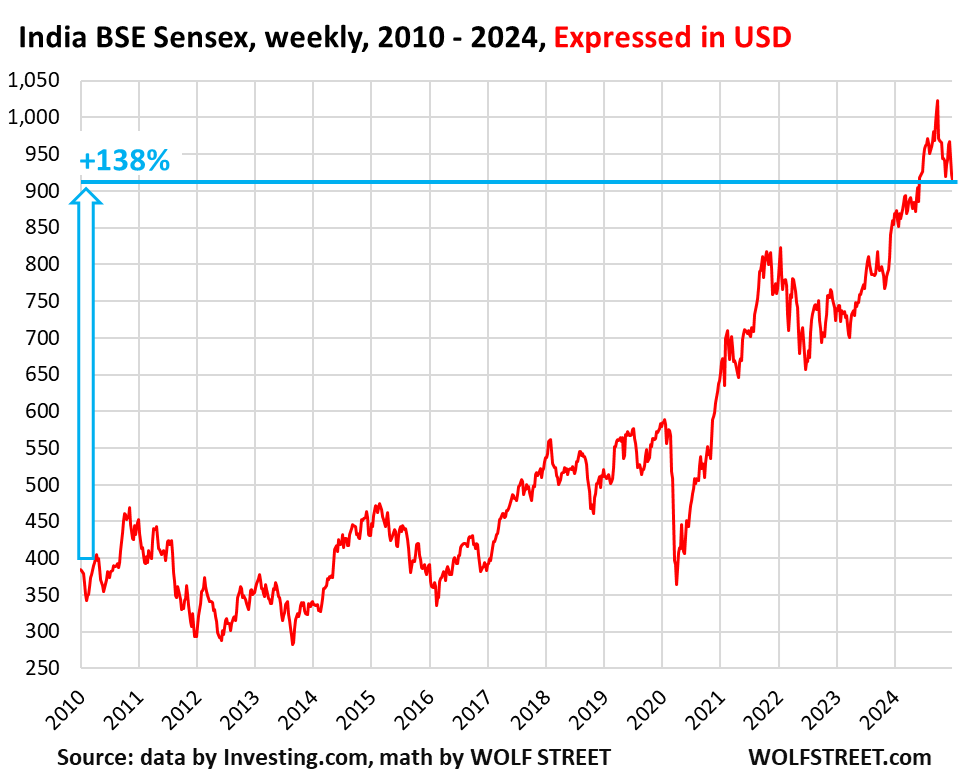
Expressed in USD, for USD-based investors, the BSE Sensex was up 138% since 2010.
- Year-over-year: +5.1%
- Since all-time high in Sept 2024: -10.7%
- Since 2010: +138%

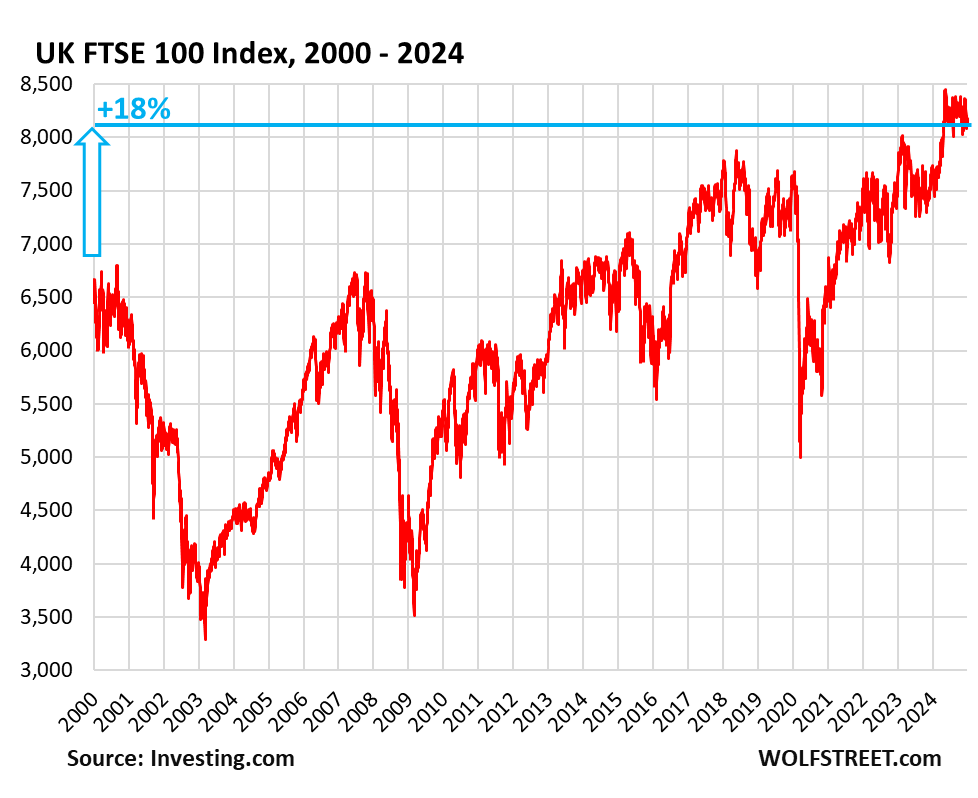
UK’s FTSE 100 Index (FTSE), +18% since 1999.
- Closed 2024 at 8,173
- Year-over-year: +5.7%
- From December 1999 high of 6,930: +18%

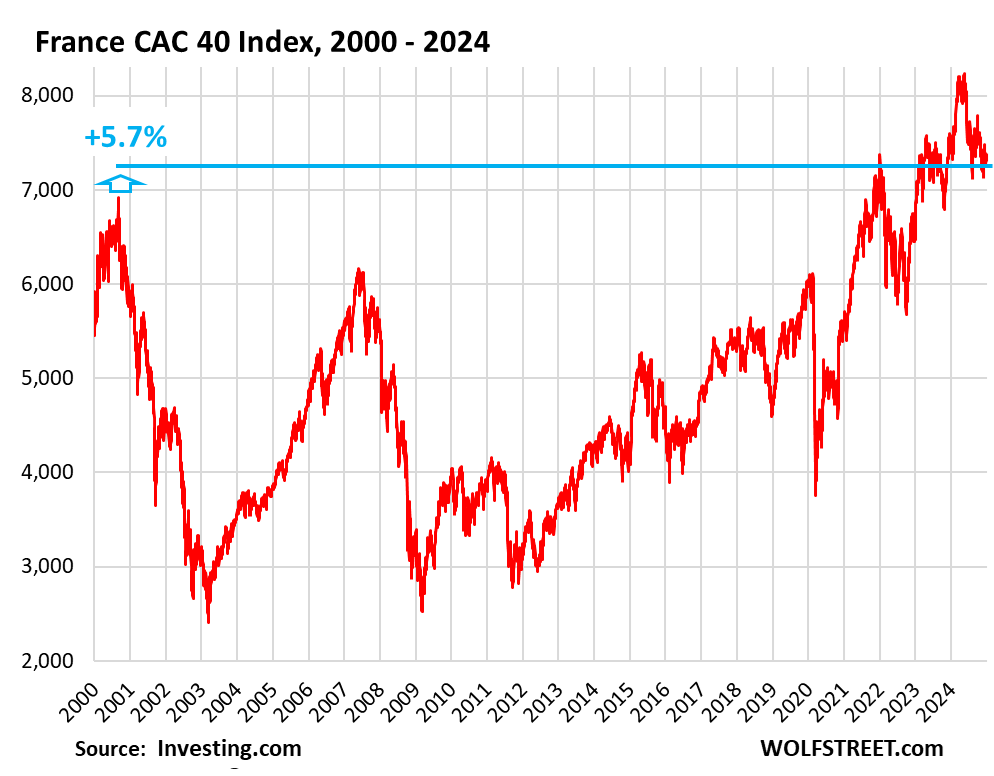
France’s CAC 40 Index, + 9% in 24 years.
- Closed 2024 at 7,380
- Year-over-year: -2.2%
- From all-time high in May 2024: -11.2%
- From September 2000 high: +5.7%

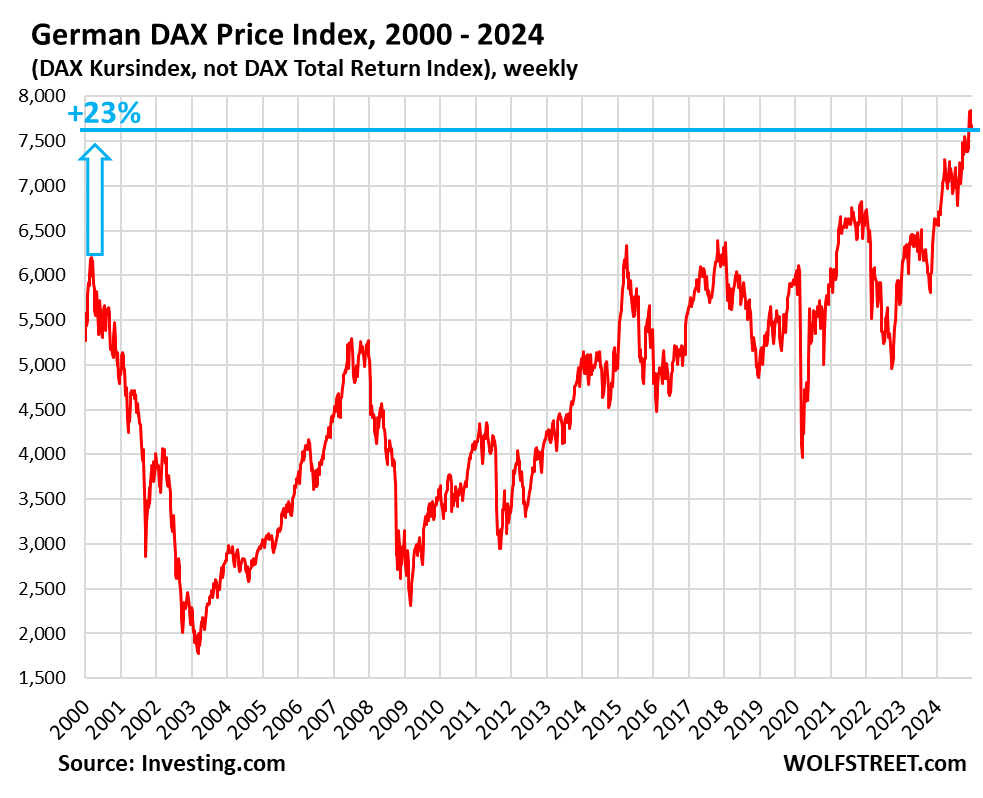
Germany’s DAX Price Index (DAXK), +23% since 2000.
The most widely cited German stock market index, the DAX, is a “total return index” that includes dividends and is therefore not comparable to a “price index,” such as the S&P 500 Index, and all the other indices here, which do not include dividends.
But the DAX Kursindex (DAXK) is a price index, and does not include dividends, and is comparable to the S&P 500 Index and all the other indices here.
- Closed the year at 7,649
- Year-over-year: +16.5%
- From prior all-time high in March 2000: +23%%

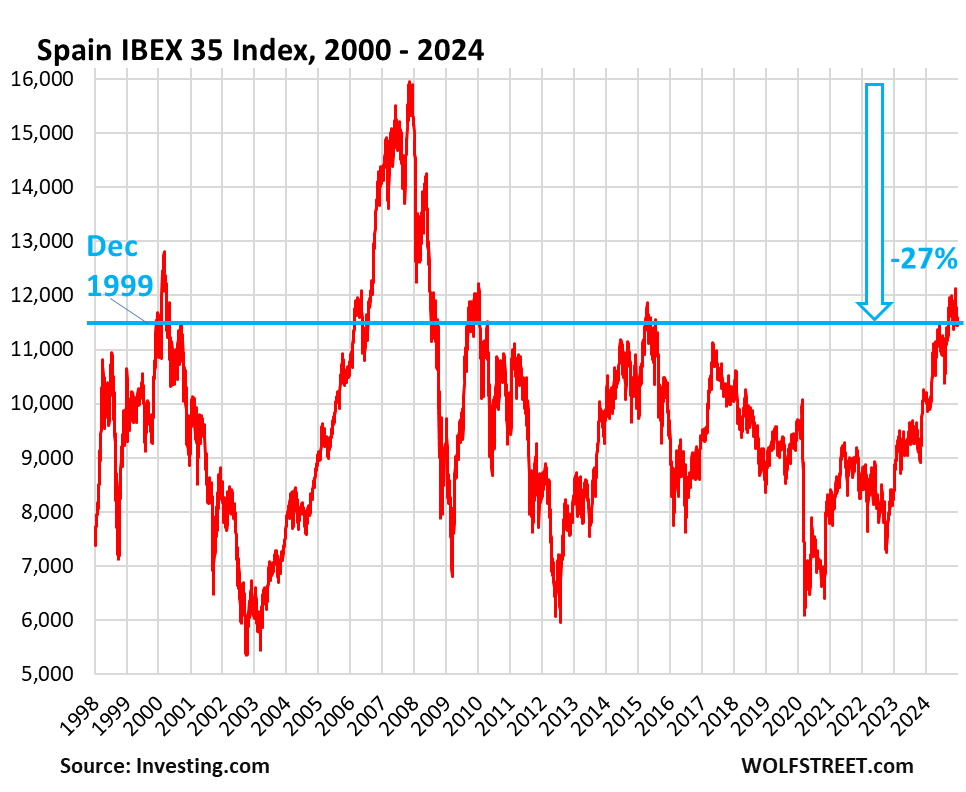
Spain’s IBEX 35 Index (IBEX), -27% from 2007, back to 1999:
- Closed the year at 11,595
- Year-over-year: +14.8%
- From all-time high in Dec 2007: -27%
- Back where it had first been in Dec 1999

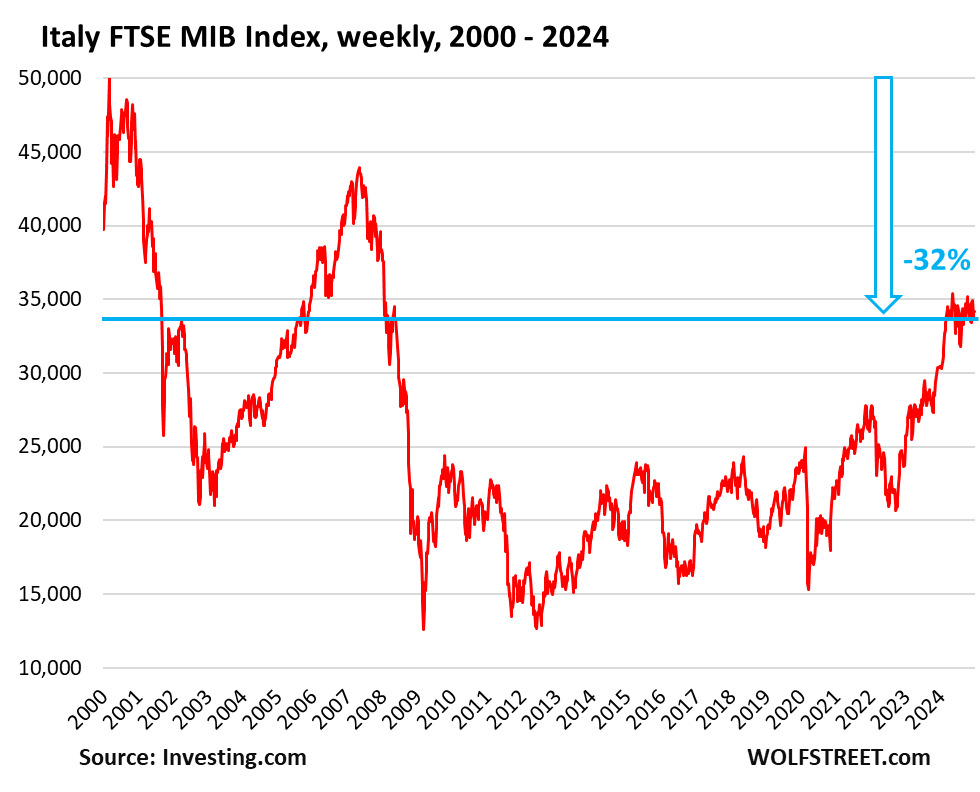
Italy’s FTSE MIB Index, -32% from March 2000.
- Closed the year at 34,186
- Year-over-year: +12.3%
- From all-time high in March 2000: -32%
- Back where it had first been in 1998

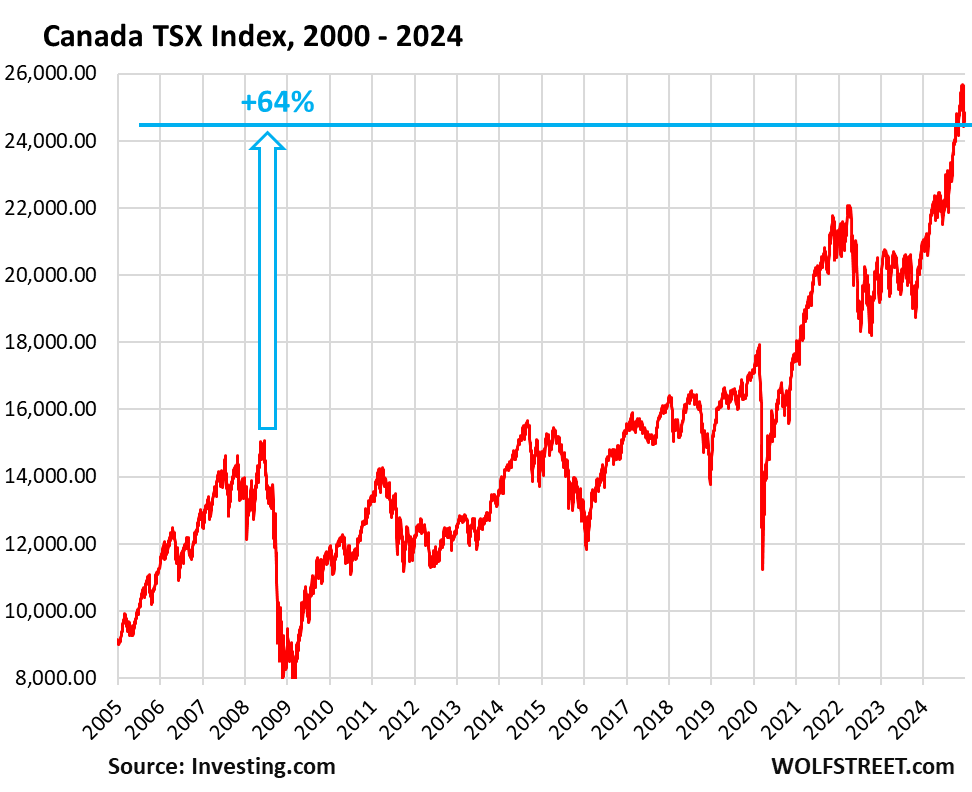
Canada’s TSX Composite Index: +64% since 2008 high:
- Closed the year at 24,728
- Year-over-year: +18%
- From March 2008 high: +64%

We give you energy news and help invest in energy projects too, click here to learn more