


California Governor Gavin Newsom has long positioned himself as a climate warrior, pushing aggressive policies to phase out fossil fuels in the Golden State. From banning new fracking permits to imposing setbacks on drilling near communities, his administration has waged what critics call a “war” on the oil and gas industry. But with gasoline prices stubbornly high, refinery closures looming, and a recent policy reversal allowing thousands of new wells in Kern County, questions are mounting: Has Newsom’s anti-oil crusade pushed California too far into energy vulnerability?
And as whispers of a 2028 presidential bid grow louder, can he pivot fast enough to shake off the baggage of soaring energy costs that have driven businesses and residents out of state?
A Decade of Skyrocketing Energy Prices
Over the past 10 years, Californians have endured some of the nation’s highest energy costs, a trend exacerbated by state policies restricting domestic production and favoring renewables. Gasoline prices, in particular, have been volatile. In 2015, the average retail price for regular gasoline in California hovered around $2.80 per gallon, but by 2022, it spiked to a record monthly average of $6.16 in the Los Angeles region amid supply disruptions and regulatory pressures.
As of October 2025, prices remain elevated at about $4.65 per gallon statewide, well above the national average of $3.13.
Electricity rates tell a similar story of escalation. In 2015, California’s average residential electricity price was about 16 cents per kilowatt-hour (kWh), already 33% above the national average. By 2023, it had climbed to nearly 30 cents per kWh in real terms, an 80% premium over the rest of the U.S.
Recent data shows the state’s electric utility retail price at 30.04 cents per kWh in 2025, up 7% from the prior month alone.
This surge far outpaces inflation, with rates inflating at an average of 15.3% annually from 2020 to 2023, driven by wildfire mitigation costs, renewable mandates, and grid upgrades
Here’s a snapshot of average annual gasoline and electricity prices in California over the last decade:
|
Year
|
Avg. Gasoline Price ($/gallon)
|
Avg. Electricity Price (cents/kWh)
|
|---|---|---|
|
2015
|
2.80
|
16.0
|
|
2016
|
2.55
|
16.5
|
|
2017
|
3.00
|
17.2
|
|
2018
|
3.55
|
18.0
|
|
2019
|
3.60
|
19.0
|
|
2020
|
3.15
|
20.5
|
|
2021
|
4.20
|
22.0
|
|
2022
|
5.25 (peak $6.16 in LA)
|
24.5
|
|
2023
|
4.80
|
29.0
|
|
2024
|
4.70
|
28.5
|
|
2025 (YTD)
|
4.65
|
30.0
|
Sources: EIA, AAA, FRED, YCharts. Prices are approximate annual averages for regular gasoline and residential electricity.
These costs have real-world impacts: Businesses cite energy expenses as a top reason for fleeing California, and households face bills projected at $183,700 over 25 years without efficiency measures.
Growing Dependence on Imported OilAs domestic production wanes, California has become increasingly reliant on foreign oil imports. In 2015, the state imported about 50% of its crude, but by 2023, that figure ballooned to 75%, with top suppliers including Iraq (21.7%), Saudi Arabia (15.7%), Brazil (15.1%), Ecuador (14.6%), and Guyana (9.7%).
Total imports hit 324 million barrels in 2024 from foreign sources alone, costing the state an estimated $25 billion annually.
This shift exposes California to global volatility, geopolitical risks, and higher transportation costs, all while local fields like those in Kern County sit underutilized.
Annual crude oil imports (million barrels):
|
Year
|
Foreign Imports
|
Total Imports (incl. U.S. sources)
|
|---|---|---|
|
2015
|
~200
|
~380
|
|
2016
|
~210
|
~390
|
|
2017
|
~220
|
~400
|
|
2018
|
~230
|
~410
|
|
2019
|
~240
|
~420
|
|
2020
|
~220 (COVID dip)
|
~380
|
|
2021
|
~250
|
~430
|
|
2022
|
~280
|
~460
|
|
2023
|
~300
|
~480
|
|
2024
|
324
|
510
|
|
2025 (proj.)
|
~330
|
~520
|
Sources: CEC, EIA. Figures are approximate based on trends.
Plummeting Well Permits Under NewsomNewsom’s policies have drastically curtailed new drilling. In 2019, before his full crackdown, California issued 2,366 new oil and gas well permits. That number cratered to 73 in 2024 and just 4 in 2025 so far.
Overall, his administration has approved 16,366 permits since 2019, but the trend is downward, with denials rising due to environmental reviews and setbacks like SB 1137 (3,200-foot buffer zones, currently in litigation).
Annual permits issued:
|
Year
|
Permits Issued
|
|---|---|
|
2015
|
~3,000
|
|
2016
|
~2,800
|
|
2017
|
~2,600
|
|
2018
|
~2,500
|
|
2019
|
2,366
|
|
2020
|
~1,500
|
|
2021
|
~1,000
|
|
2022
|
~500
|
|
2023
|
~200
|
|
2024
|
73
|
|
2025 (YTD)
|
4 + 35 (Q2 2024 spillover)
|
Sources: CalGEM, Consumer Watchdog. Estimates for earlier years based on trends
The Kern County Reversal: A Desperate Pivot?
In a stunning about-face, Newsom signed SB 237 on September 19, 2025, granting Kern County authority to approve up to 2,000 new oil wells annually through 2035, exempting them from the California Environmental Quality Act (CEQA) for a decade.
The bill aims to boost local production, stabilize fuel supplies, and avert $8-per-gallon gas amid refinery woes.
Kern, home to most of California’s oil fields, could achieve net-zero emissions per well under local rules.
But is it enough? Critics say no. The plan doesn’t address broader setbacks or the fact that many approved permits go unused due to economic unviability.
Moreover, refinery closures threaten to exacerbate shortages. Phillips 66’s 139,000-barrel-per-day Wilmington refinery is set to shut down by December 2025, and Valero’s Benicia facility by April 2026, slashing state capacity by 17%.
Chevron’s El Segundo refinery, with 285,000 bpd capacity, suffered a major fire on October 2, 2025, in its jet fuel unit, forcing operational adjustments but no full closure.
Reopening El Segundo fully is possible, but experts warn offline periods could hike gas prices by 13 cents per week.
The Pipeline Predicament: Physics and Underutilization
Adding to the crisis is California’s main oil pipelines, particularly those transporting crude from Kern County fields to coastal refineries like Line 2000 and others in the San Joaquin Valley network. These pipelines are severely underutilized due to declining production, operating at flows too low to maintain integrity.
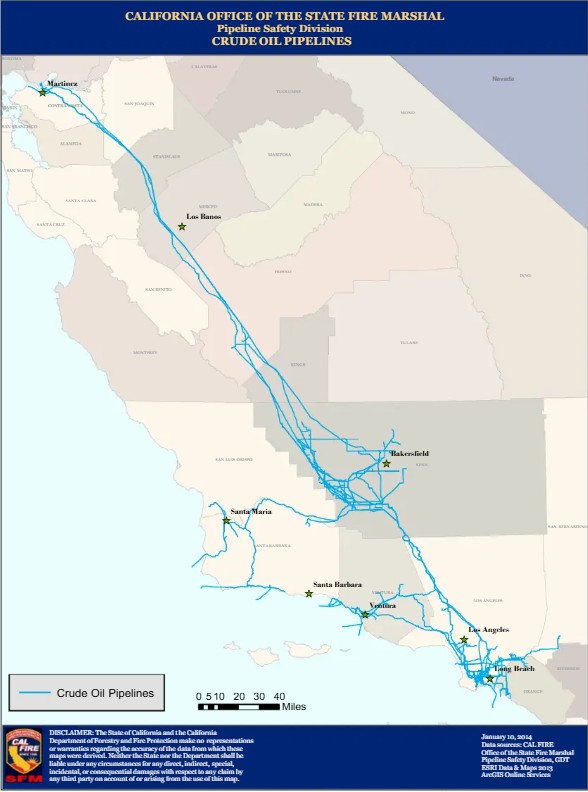

Physics plays a cruel role here: Low throughput leads to sedimentation, corrosion, and temperature issues that can cause leaks or force shutdowns. Northern California pipelines are at highest risk, potentially shifting refineries to costlier waterborne imports if they close.
Even with Kern’s new permits, ramping up production fast enough to save these lines is doubtful, as wells take time to drill and yield modestly.
Political Fallout: A Presidential Poison Pill?
Newsom’s energy policies have become a liability for any national ambitions. High gas and power bills have fueled an exodus of Californians to cheaper states, painting him as out-of-touch with working-class voters.
His recent oil-friendly bills, part of a bipartisan package to cut pollution while stabilizing supplies, are dismissed by critics as a cynical flip-flop to dodge blame for potential $8 gas.
On X, users call it “too little too late,” branding him a “dead man running” who won’t fool voters nationwide.
In a potential 2028 run, these issues could alienate Rust Belt and energy-producing states, where cheap fuel is a priority. While Newsom touts climate leadership—signing deals with Italy and South Korea—his record risks being weaponized as evidence of elite environmentalism at the expense of affordability.
Recovery might hinge on Kern’s output stabilizing prices, but with refineries closing and pipelines teetering, the damage may already be done. Newsom’s war on oil might not end his career, but it could leave him limping into the national arena.
Have you calculated your Tax Burden in 2025?
Crude Oil, LNG, Jet Fuel price quote
ENB Top News
ENB
Energy Dashboard
ENB Podcast
ENB Substack