


By Wolf Richter for WOLF STREET.
Despite the drop in mortgage rates – to 6.5% in the latest reporting week – and the surge in inventories as vacant homes for sale are coming out of the woodwork, sales of existing homes have been wobbling along the lowest levels since the depth of the Housing Bust in 2010 amid wilting demand in face of prices that are still way too high.
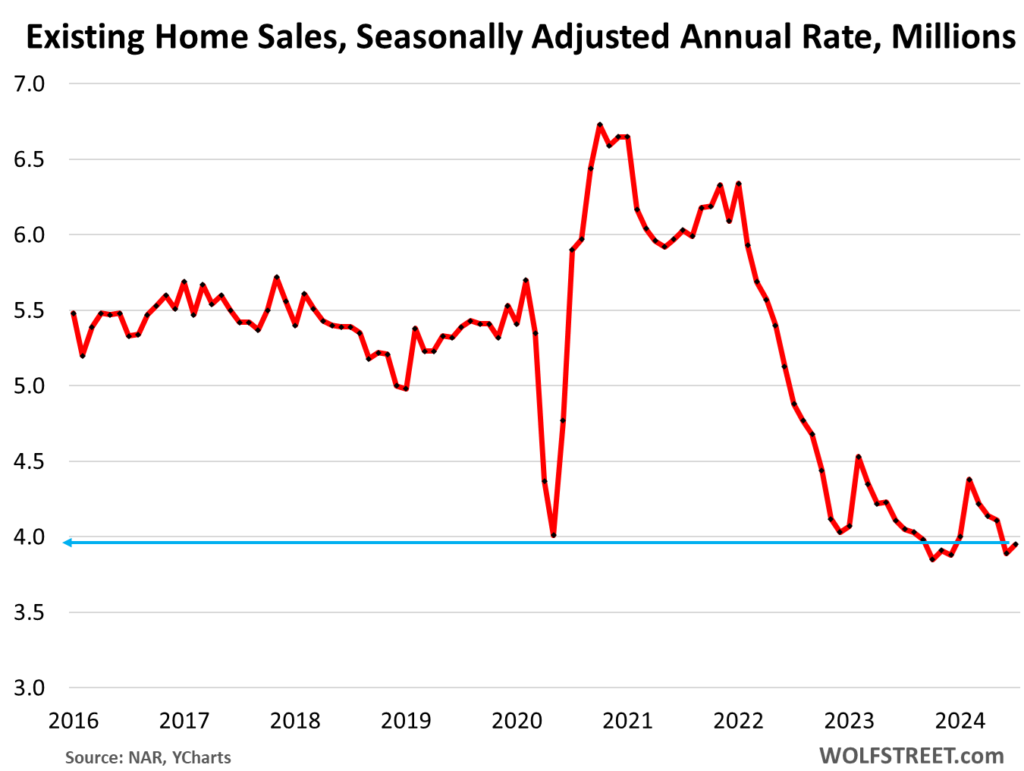
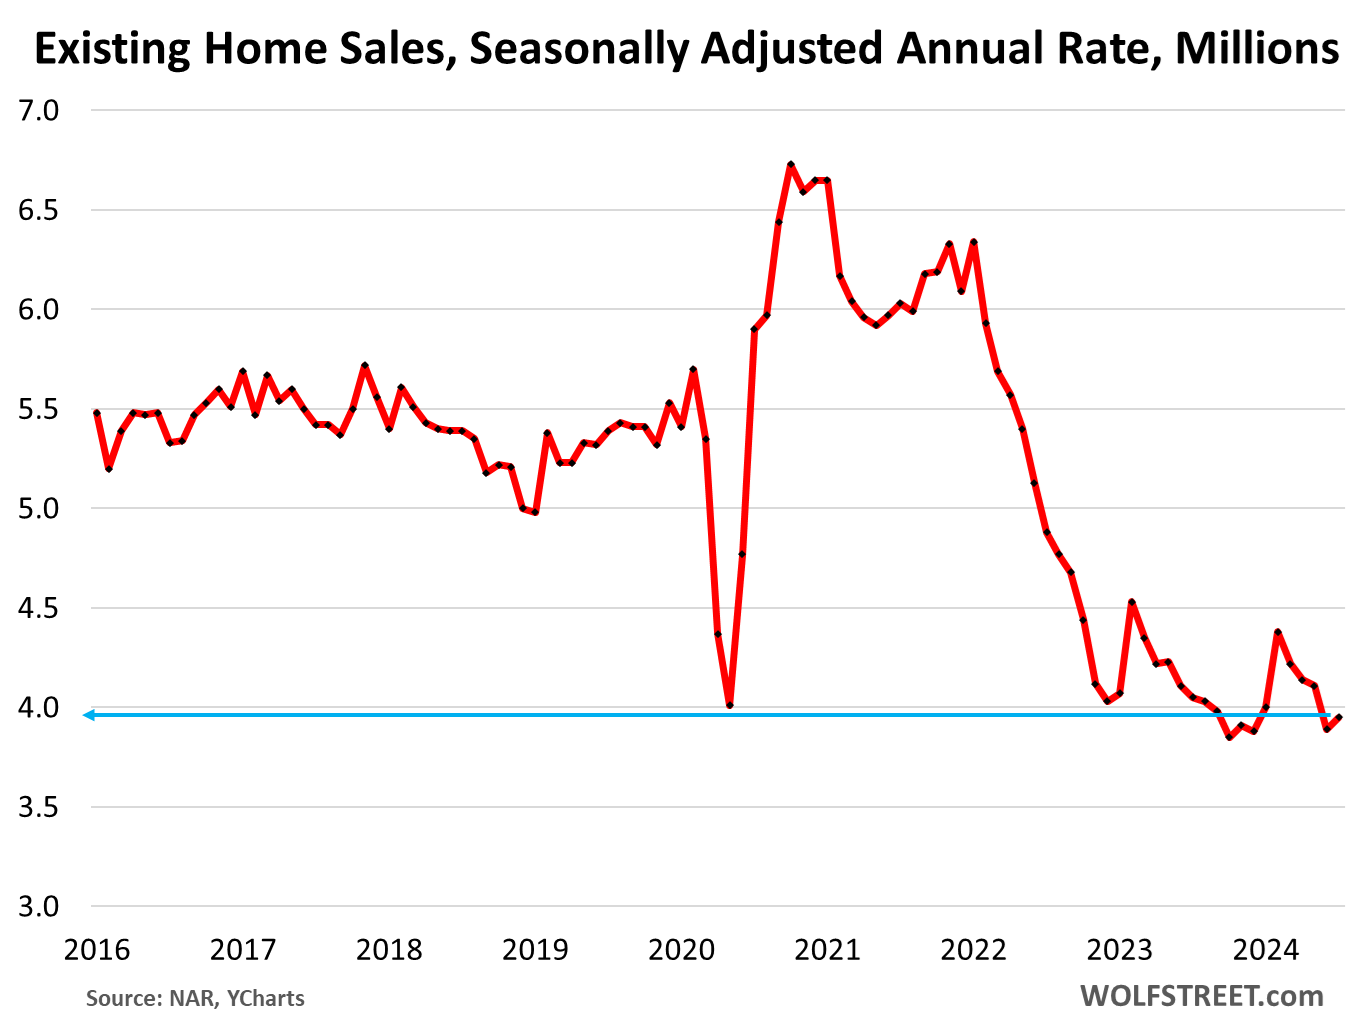
Sales of existing homes of all types – single-family houses, townhomes, condos, and co-ops – in July inched up 1.3% from June, to a seasonally adjusted annual rate of 3.95 million, below the low point in May 2020, the fourth-lowest since the depth of the Housing Bust in 2010, behind only June 2024, and October and December 2023.
Sales in July were down from the Julys in prior years by (historic data via YCharts):
2023: -2.5%
2022: -19.1%
2021: -34.5%
2019: -26.7%
2018: -26.7%.

Inventory and supply have reached multi-year highs, as sales have sagged. Inventory rose to 1.33 million homes, the highest since October 2020, according to NAR data.
Supply, after spiking to 4.1 months in June at June’s rate of sales, dipped in July to 4.0 months, as sales ticked up. Both June and July were the highest since the spike in May 2020, and just a notch below the Julys in 2019 (4.2 months), 2018 (4.3 months), and 2017 (4.3 months). In July 2023, supply was 3.3 months.
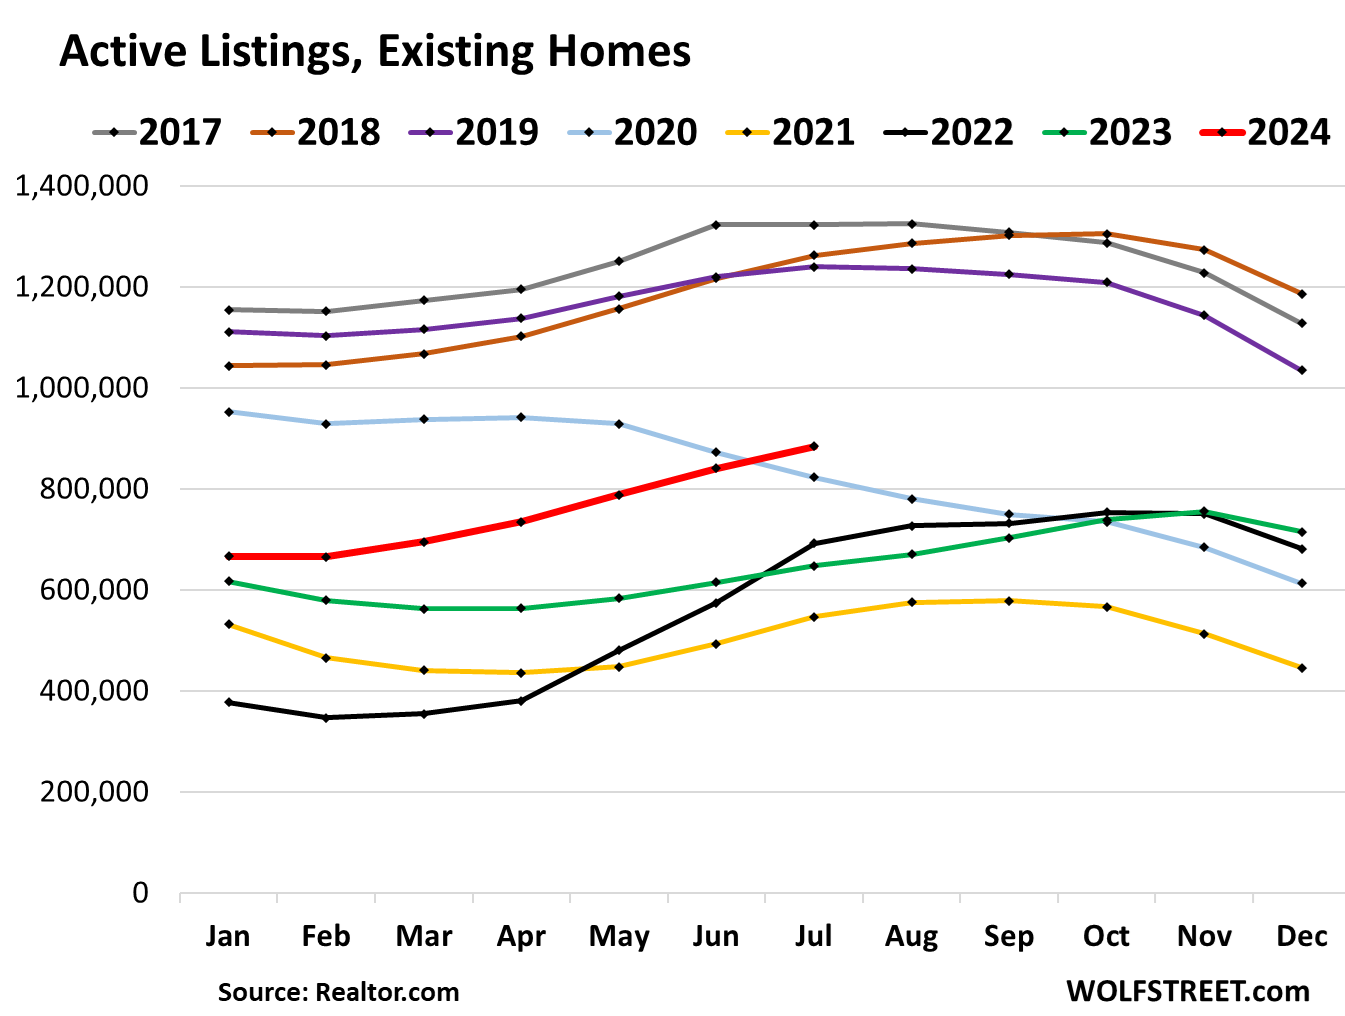
That spike in supply in recent months is quite something – the result of dismal sales and the rise in inventories as the vacant homes are coming out of the woodwork that homeowners wanted to ride up the price spike with all the way to the top (historic data via YCharts):


Active listings surged by 36.6% year-over-year to 884,273 in July, the highest since May 2020, according to data from Realtor.com.

Active listings exploded in some of the 50 biggest metros, with data from Realtor.com – note the housing-to-the-moon metros at the top of the list: Tampa, Orlando, San Diego, Denver, and Seattle, where active listings spiked between 95% and 74% year-over-year, while sales fell, and vacant homes came out of the woodwork.
| Metro Area, July 2024 | Active Listings YoY | New Listings YoY |
| Tampa-St. Petersburg-Clearwater, Fla. | 95% | 6% |
| Orlando-Kissimmee-Sanford, Fla. | 79% | 7% |
| San Diego-Chula Vista-Carlsbad, Calif. | 78% | 15% |
| Denver-Aurora-Lakewood, Colo. | 75% | 11% |
| Seattle-Tacoma-Bellevue, Wash. | 74% | 37% |
| Jacksonville, Fla. | 73% | 15% |
| Miami-Fort Lauderdale-Pompano Beach, Fla. | 72% | 5% |
| Phoenix-Mesa-Chandler, Ariz. | 61% | 2% |
| San Jose-Sunnyvale-Santa Clara, Calif. | 61% | 31% |
| Charlotte-Concord-Gastonia, N.C.-S.C. | 60% | 12% |
| Columbus, Ohio | 58% | 17% |
| Atlanta-Sandy Springs-Alpharetta, Ga. | 57% | 2% |
| Dallas-Fort Worth-Arlington, Texas | 52% | 3% |
| Raleigh-Cary, N.C. | 51% | 6% |
| Memphis, Tenn.-Miss.-Ark. | 49% | -3% |
| Sacramento-Roseville-Folsom, Calif. | 48% | 0% |
| San Antonio-New Braunfels, Texas | 45% | 1% |
| Los Angeles-Long Beach-Anaheim, Calif. | 43% | 8% |
| Riverside-San Bernardino-Ontario, Calif. | 41% | -1% |
| Richmond, Va. | 39% | 10% |
| San Francisco-Oakland-Berkeley, Calif. | 37% | 5% |
| Oklahoma City, Okla. | 36% | 16% |
| Houston-The Woodlands-Sugar Land, Texas | 35% | -13% |
| Cincinnati, Ohio-Ky.-Ind. | 35% | 10% |
| Birmingham-Hoover, Ala. | 35% | -10% |
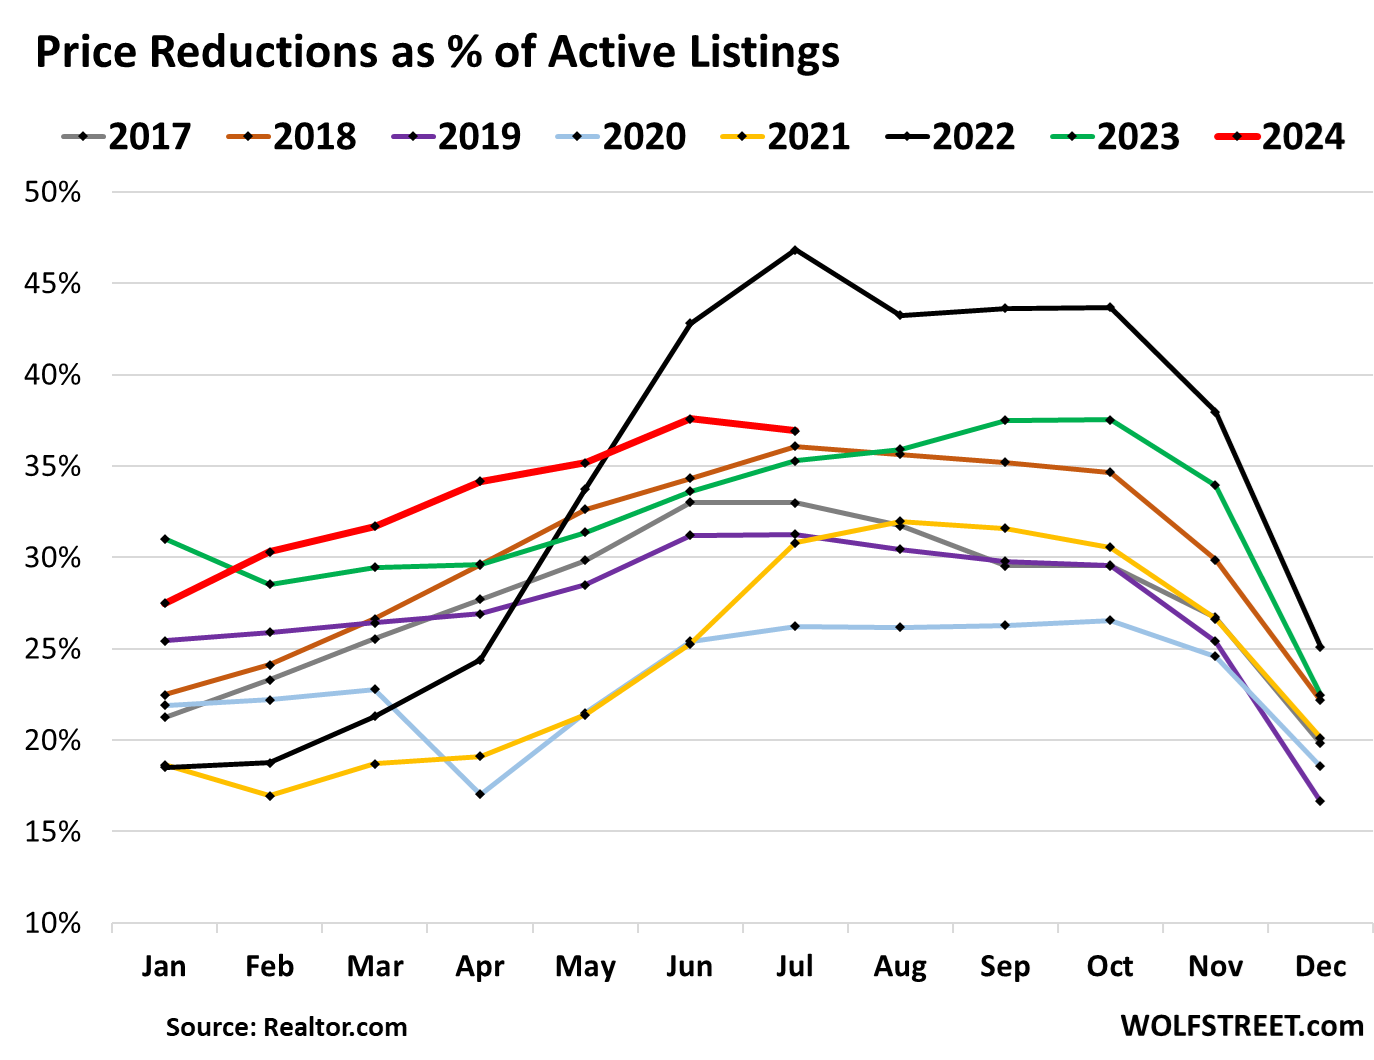

Price reductions as a percent of active listings, at 37.6%, were the second highest for any July in Realtor.com’s data going back to 2016, behind only July 2022:
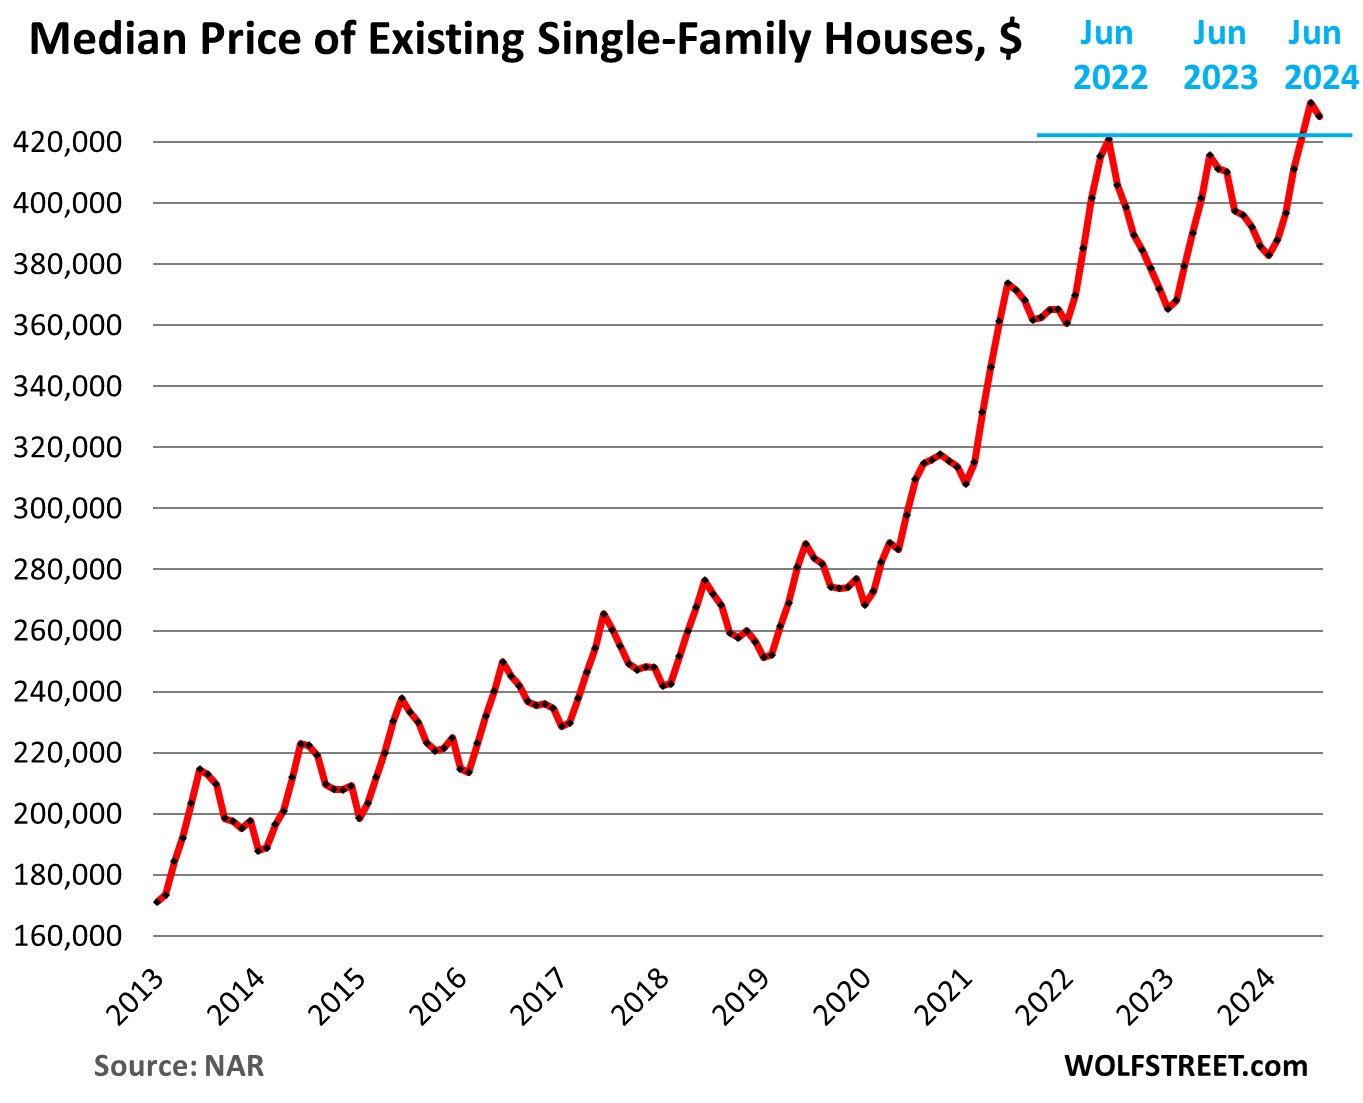
The median price of single-family houses dipped to $428,500 in July from the seasonal peak in June, and was up 4.2% year-over-year.
Since we track the progress from the prior peak in June 2022 – the blue line in the chart below – the median price was up 1.8%. For seasonal reasons, the median price will fall for the rest of the year into early 2025. Junes mark the high points.

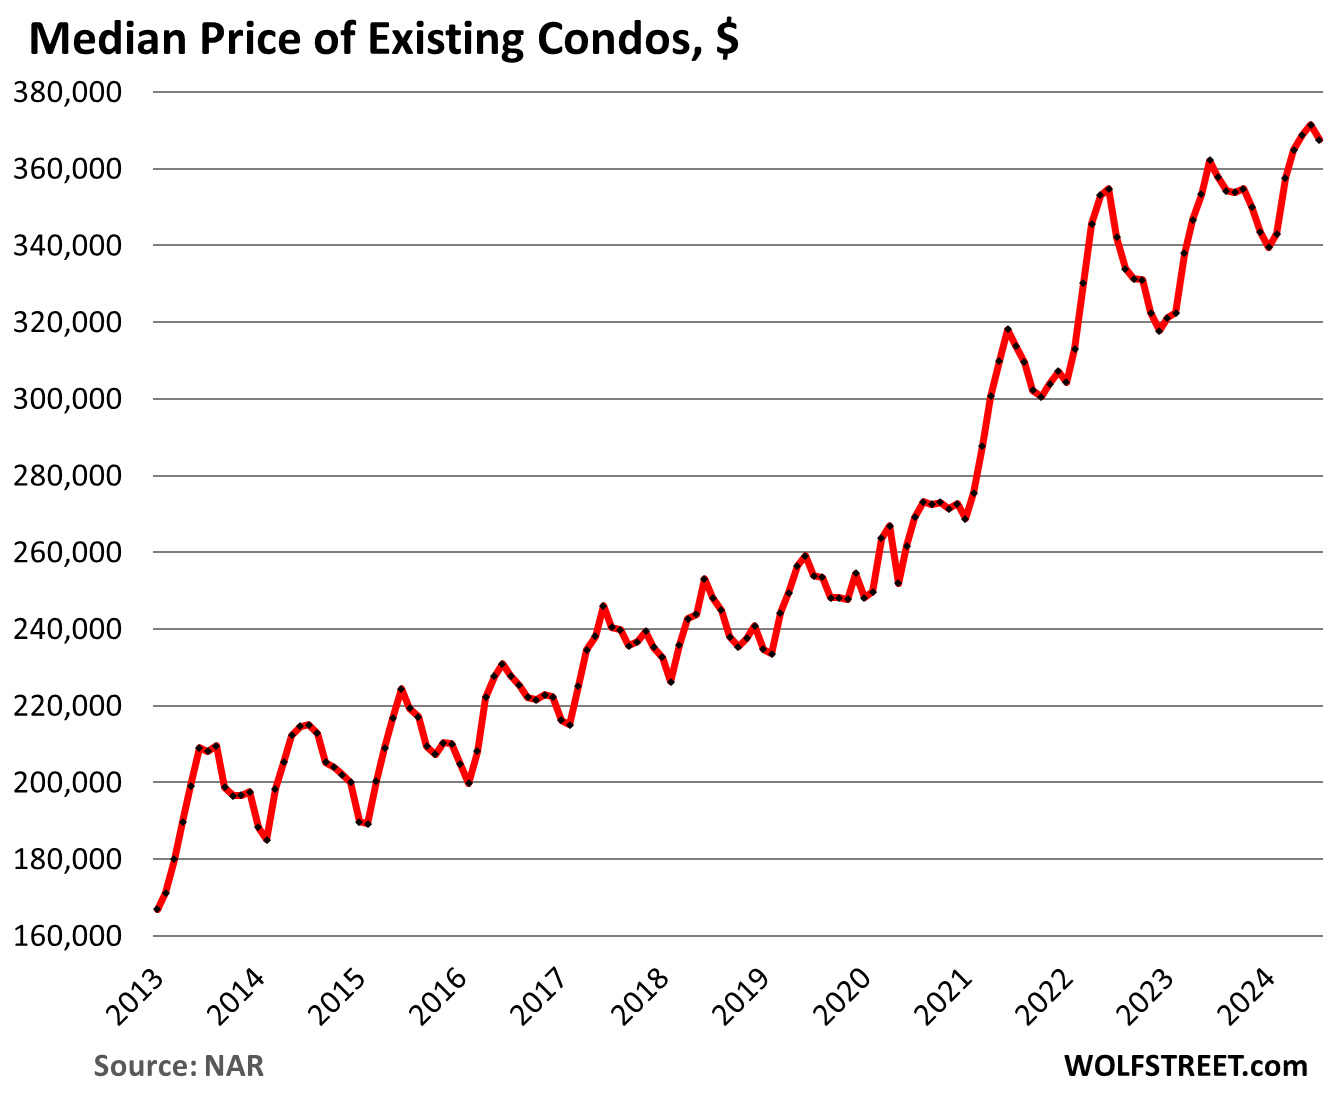
The median price of condos and co-ops fell to $367,500 in July, and was up 2.7% year-over-year. The year-over-year increases have been getting smaller from the 8%-plus range late last year. Unlike single-family house prices, condo prices didn’t book any year-over-year declines in mid-2023. But now they’re running out of steam.
“The condominium market is underperforming compared to the single-family market. Rising maintenance and insurance costs have lessened the appeal for condominiums,” NAR said.

Take the Survey at https://survey.energynewsbeat.com/