


Hurricanes in September & October and the Boeing strike will mess with labor market data for a few months; the Fed won’t get clear answers.
By Wolf Richter for WOLF STREET.
Three hurricanes – Francine in early September, Helene in late September and early October, and Milton in mid-October – and the heavy rains and flooding that came with them temporarily shut down work sites in a substantial part of the country, which is going to throw a lot of additional uncertainty over the labor market data for the next few months.
We’ve already seen this play out in the weekly initial unemployment insurance (UI) claims, which react the fastest: They spiked for the late September to early October period as many work sites were temporarily closed, then subsided again.
In addition, there’s the ongoing Boeing strike and the accompanying layoffs. Workers on strike are not eligible for UI and don’t show up in weekly initial UI claims. But they will show up in the employment data over the next few months. So this is going to be a mess.
Today the Bureau of Labor Statistics released the Job Openings and Labor Turnover Survey (JOLTS) for September, which is based on employer data, may have also been impacted.
And some interesting things happened:
- Hiring in September jumped for the third month in a row.
- Workers continued the trend of not quitting their jobs but sticking it out.
- Layoffs and discharges jumped, after the decline in August.
- Job openings fell, after the increase in August, and are now about where they’d been at the peak before the pandemic.
- Job openings as a percentage of total nonfarm payrolls fell but remained higher than any time before the pandemic.
- The number of job opening per unemployed persons has remained roughly stable for the third month at decent but not hot levels.
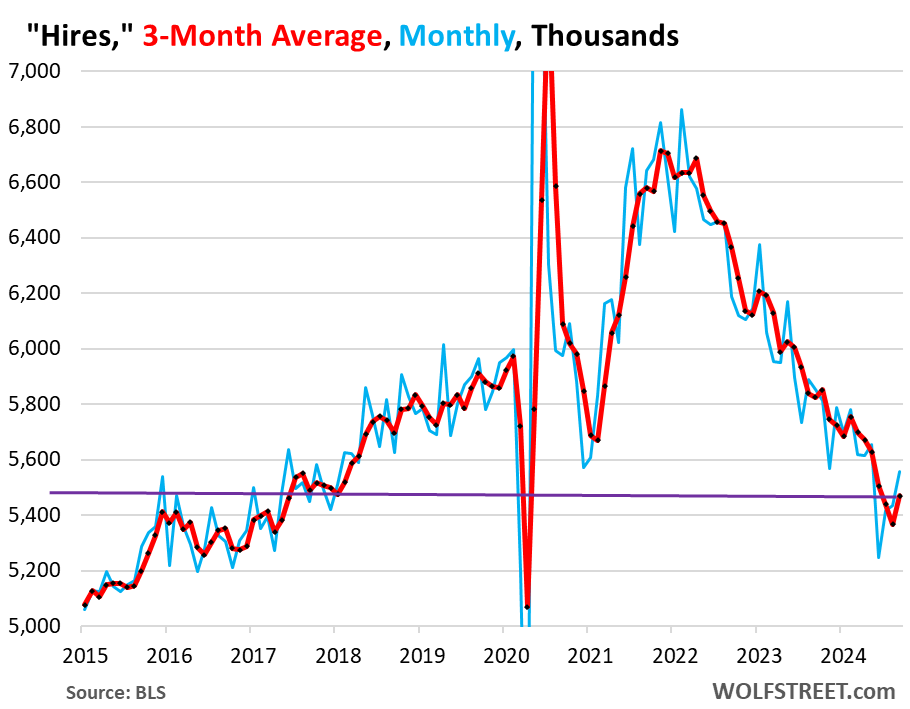
Hires jumped to 5.56 million in September, the third month in a row of increases, and August was revised higher (blue in the chart below).
The three-month average, which irons out the month-to-month squiggles and includes revisions, rose to 5.47 million hires, the first increase since February (red).
These people were hired to fill roles left behind by workers who had quit or were discharged, and to fill new roles. But the number of workers who quit their jobs has been dropping sharply as workers clung to their jobs, instead of walking out, as we’ll see in a moment. And far fewer quits means less hiring to fill the newly open positions, which explains the long down-trend in the chart below which roughly parallels the trend in quits.
But hiring has now accelerated for the third month, even as fewer workers quit, and so these hires filled newly created positions or positions left behind by workers who were discharged.

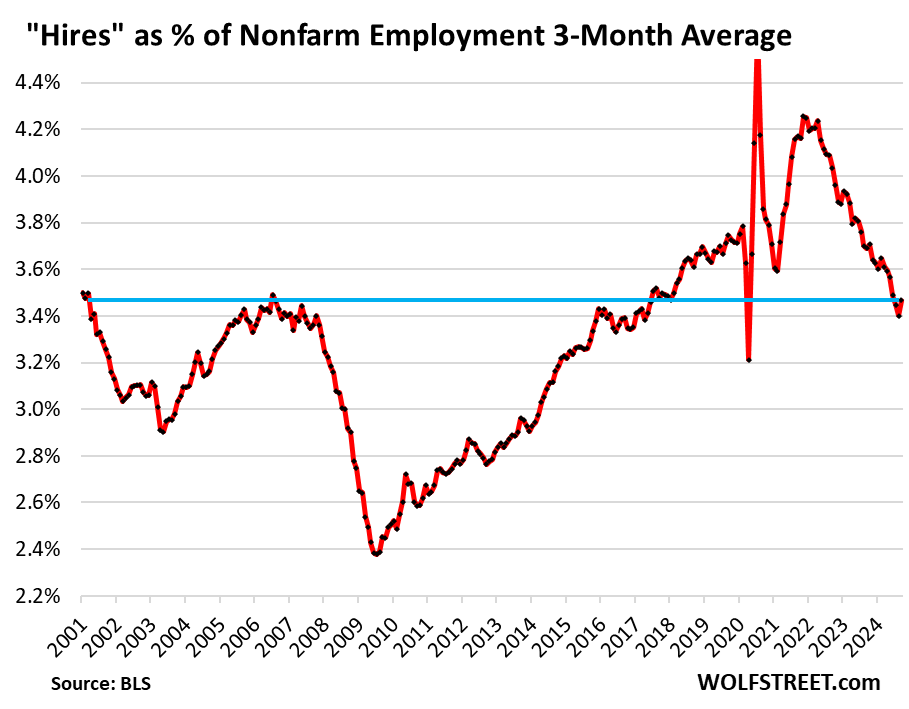
The ratio of hires to nonfarm payrolls increased to 3.47%, the highest in three months, but below where it had been in the 2017-2019 years, which were considered a tight labor market (amid Fed rate hikes and QT).

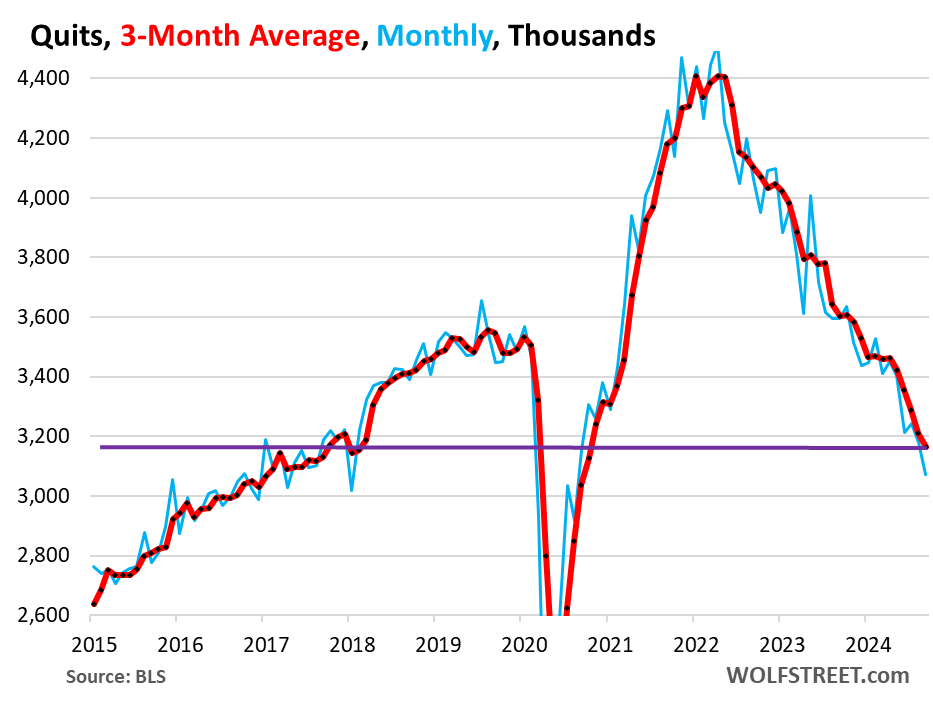
Quits: Workers cling to their jobs. Voluntary quits fell to 3.07 million in September. The three-month average fell to 3.16 million, back to March 2018 levels.
The huge churn during the pandemic, when workers jumped jobs and industries to improve their pay and working conditions, and to better match their skills and aspirations, thereby triggering the biggest pay increases in decades, has ended.
Fewer voluntary quits mean fewer newly open slots that have to be filled, so fewer job openings, as we’ll see in a moment, and fewer hires to fill those openings.
For employers, lower quits is a big improvement. Productivity rises when workers stay longer and learn the ropes. Pay increases have moderated because employers no longer have to poach each other’s employees by offering better pay. Employers are re-exerting control and they’re cleaning out the deadwood. Some are now mandating the return to the office at least for a few days a week, knowing that most people won’t quit over those policies, and if they do, fine.

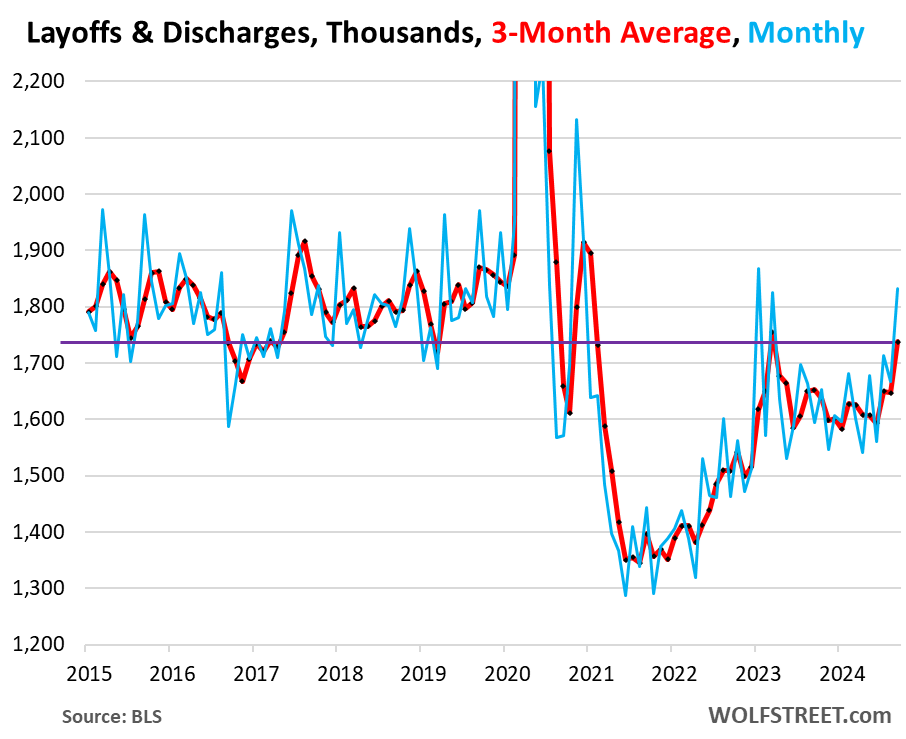
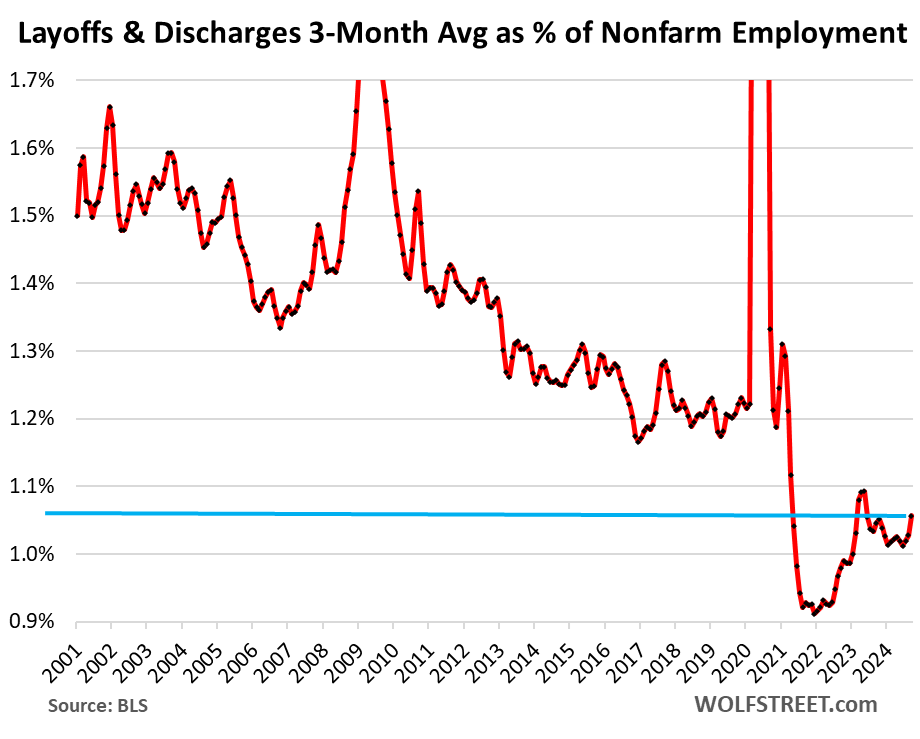
Layoffs and discharges rose to 1.83 million in September, after having declined in August. This could be one place where Hurricane Francine, which hit the Gulf Coast and especially Louisiana in the first half of September, showed up. The much bigger effects of Hurricane Helene will likely show up in the October data. The three-month average rose to 1.74 million.
Layoffs and involuntary discharges include people getting fired for cause. Getting fired is a standard feature of working in America, and it occurs a lot even during the best times.
These numbers are still relatively low in comparison to the prior two decades, as employers are shedding people at a rate that is lower than during the Good Times before the pandemic, and they’re hanging on to the workers they’ve got.

Layoffs and discharges as percentage of nonfarm payrolls – which accounts for growing employment over the years – rose to 1.09%. The three-month average rose to 1.06%, both far below any time during the pre-pandemic years in the data going back to 2001. This shows just how employers are hanging on to their workers.
Why employers are hanging on to their workers has been subject to a lot of speculation, including that employers may have learned a lesson after getting burned by the labor shortages in 2021 and 2022, when they couldn’t rehire the masses of people that they’d let go, and had to poach employees from each other and thereby drove up their labor costs.

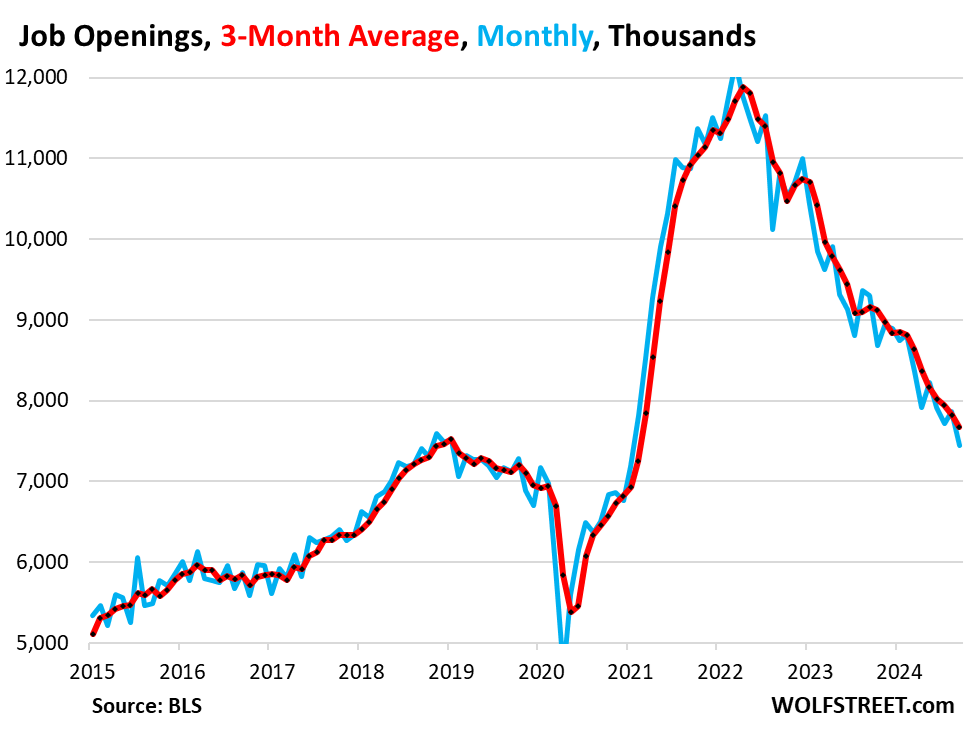
Job openings fell to 7.44 million, roughly where they’d been at the peak before the pandemic. With fewer people quitting – see above – there are fewer job openings to fill. The massive churn of the labor force in 2021 and 2022 has ended.
The three-month average fell to 7.67 million job openings, and that’s still above the prepandemic record of job openings.

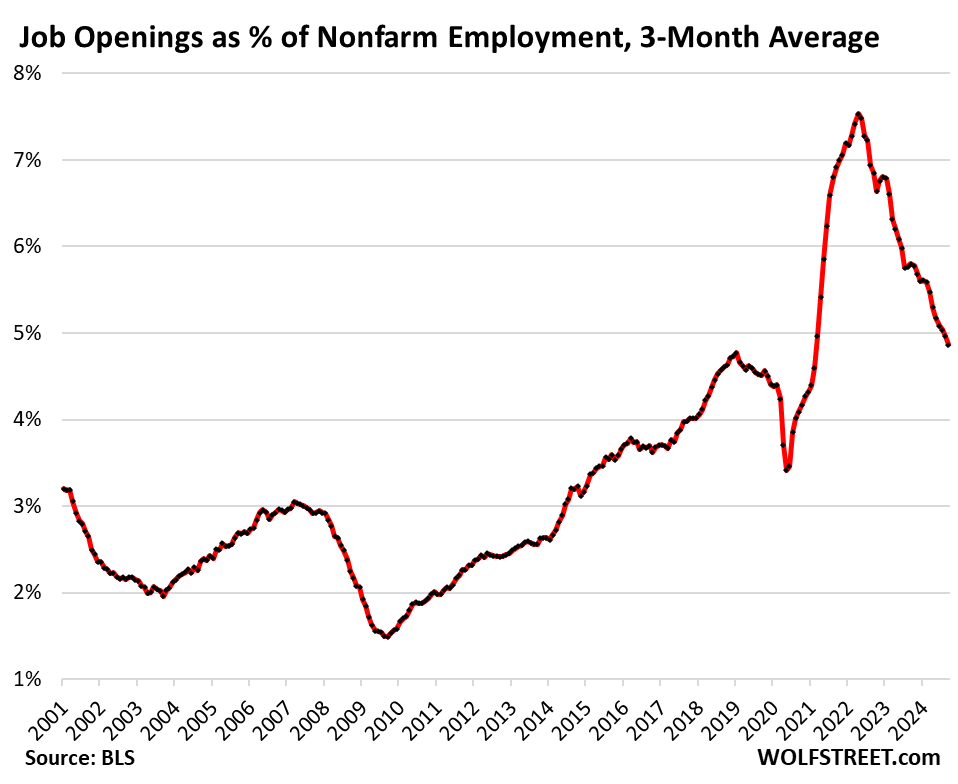
The ratio of job openings to nonfarm payrolls, which accounts for rising employment, dipped to 4.7%, but is still higher than the pre-pandemic records in late 2018 and early 2019. The three-month average of job openings dipped to 4.9% of nonfarm payrolls, still above the prepandemic record.

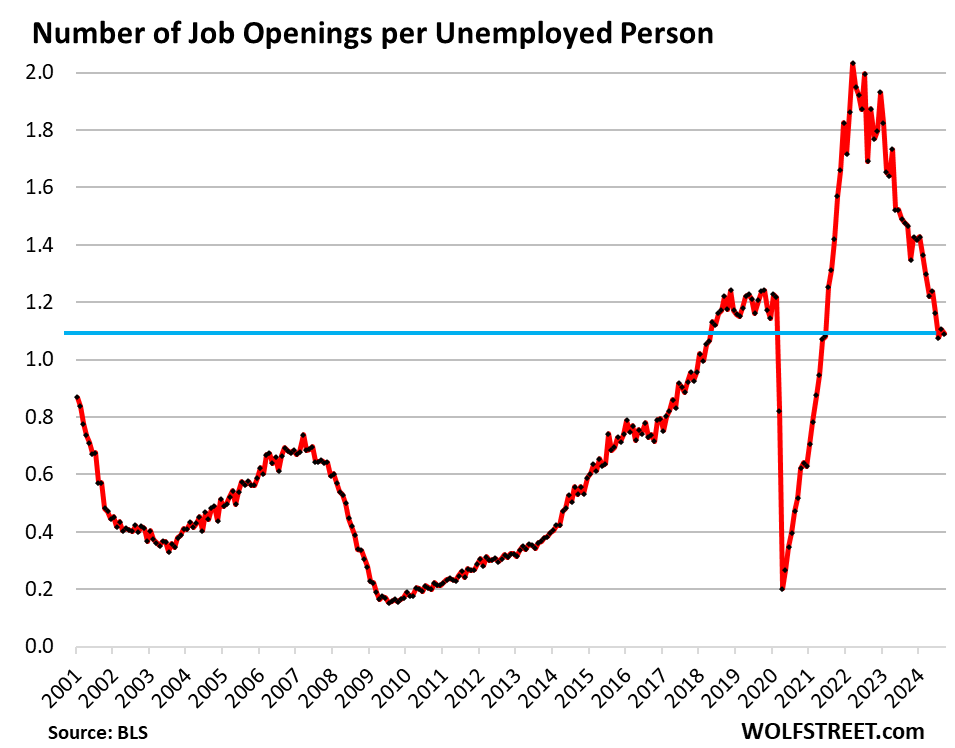
The number of job openings per unemployed person – a Powell favorite – has remained at about 1.1 for the third month in a row, meaning that there are still slightly more job openings (7.74 million three-month average) than unemployed people looking for work (6.83 million).
This ratio – now lower than it had been during the hot labor market in late 2018 through February 2020 – was one of the reasons Powell cited for the 50 basis-point cut; the metric was a sign that the labor market has cooled enough that doesn’t need to cool further:

Enjoy reading WOLF STREET and want to support it? You can donate. I appreciate it immensely. Click on the beer and iced-tea mug to find out how:


Would you like to be notified via email when WOLF STREET publishes a new article? Sign up here.
![]()
