


Overview
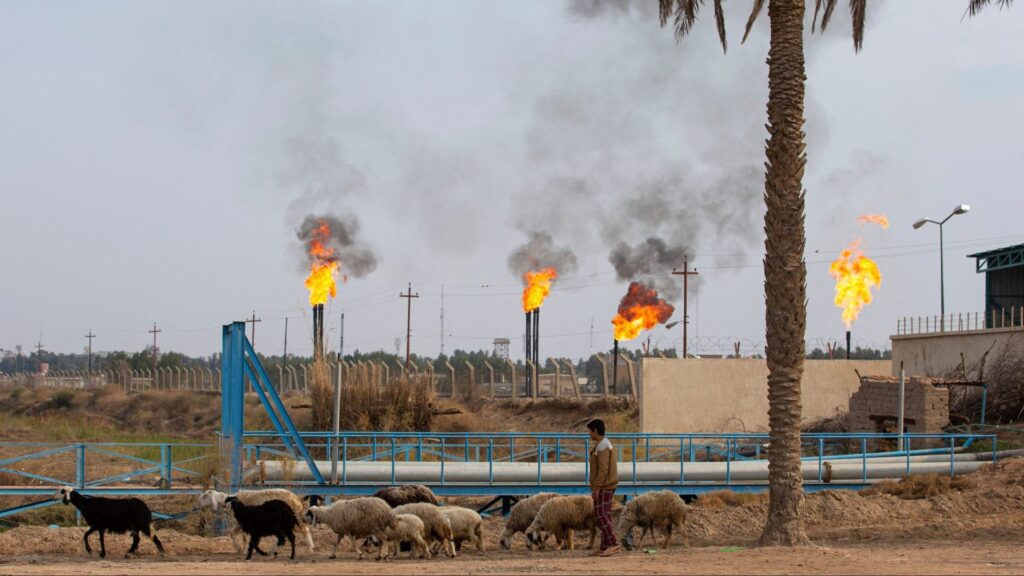
This Fact Sheet analyzes the upstream oil industry’s record on flaring in Canada relative to other top oil-producing countries. Gas flaring is the burning off of the natural gas that is generated in the process of oil extraction and production. Flaring is relevant because it is a source of greenhouse gas emissions (GHGs) (see Appendix).
In 2022, 138,549 million cubic meters (m3) (or 139 billion cubic meters (bcm)) of flared gases were emitted worldwide, creating 350 million tonnes of CO2 emissions annually. Canada is a significant oil producer; it has the third-largest proven crude oil reserves and is the fourthlargest crude oil producer in the world (Natural Resources Canada, undated), and so contributes to flaring.
Flaring comparisons
This Fact Sheet uses World Bank data to provide international comparisons of flaring. It also draws on U.S. Energy Information Administration (EIA) crude oil production data to compare flaring among the top 10 crude oil producing countries.
Table 1 shows gas flaring volumes in 2012 and 2022. In absolute terms, Russia recorded more flaring than any other country at 25,495 million m3 (25.4 bcm) in 2022, which was 1,628 million m3 (7 per cent) higher than in 2012.
The four countries that are the top GHG emitters through flaring (Russia, Iraq, Iran, and Algeria) accounted for 50 per cent of global gas flaring in 2022.
At 945 million m3, Canada was the eighth lowest flarer in 2022 (23rd spot out of the top 30 countries). It decreased its flaring emissions by 320 million m3 from the 2012 level of 1,264 million m3, a 25 per cent drop.
In 2022, Canada contributed just 0.7 per cent of the global amount of gas flaring despite being the world’s fourth largest oil producer (see Table 1).

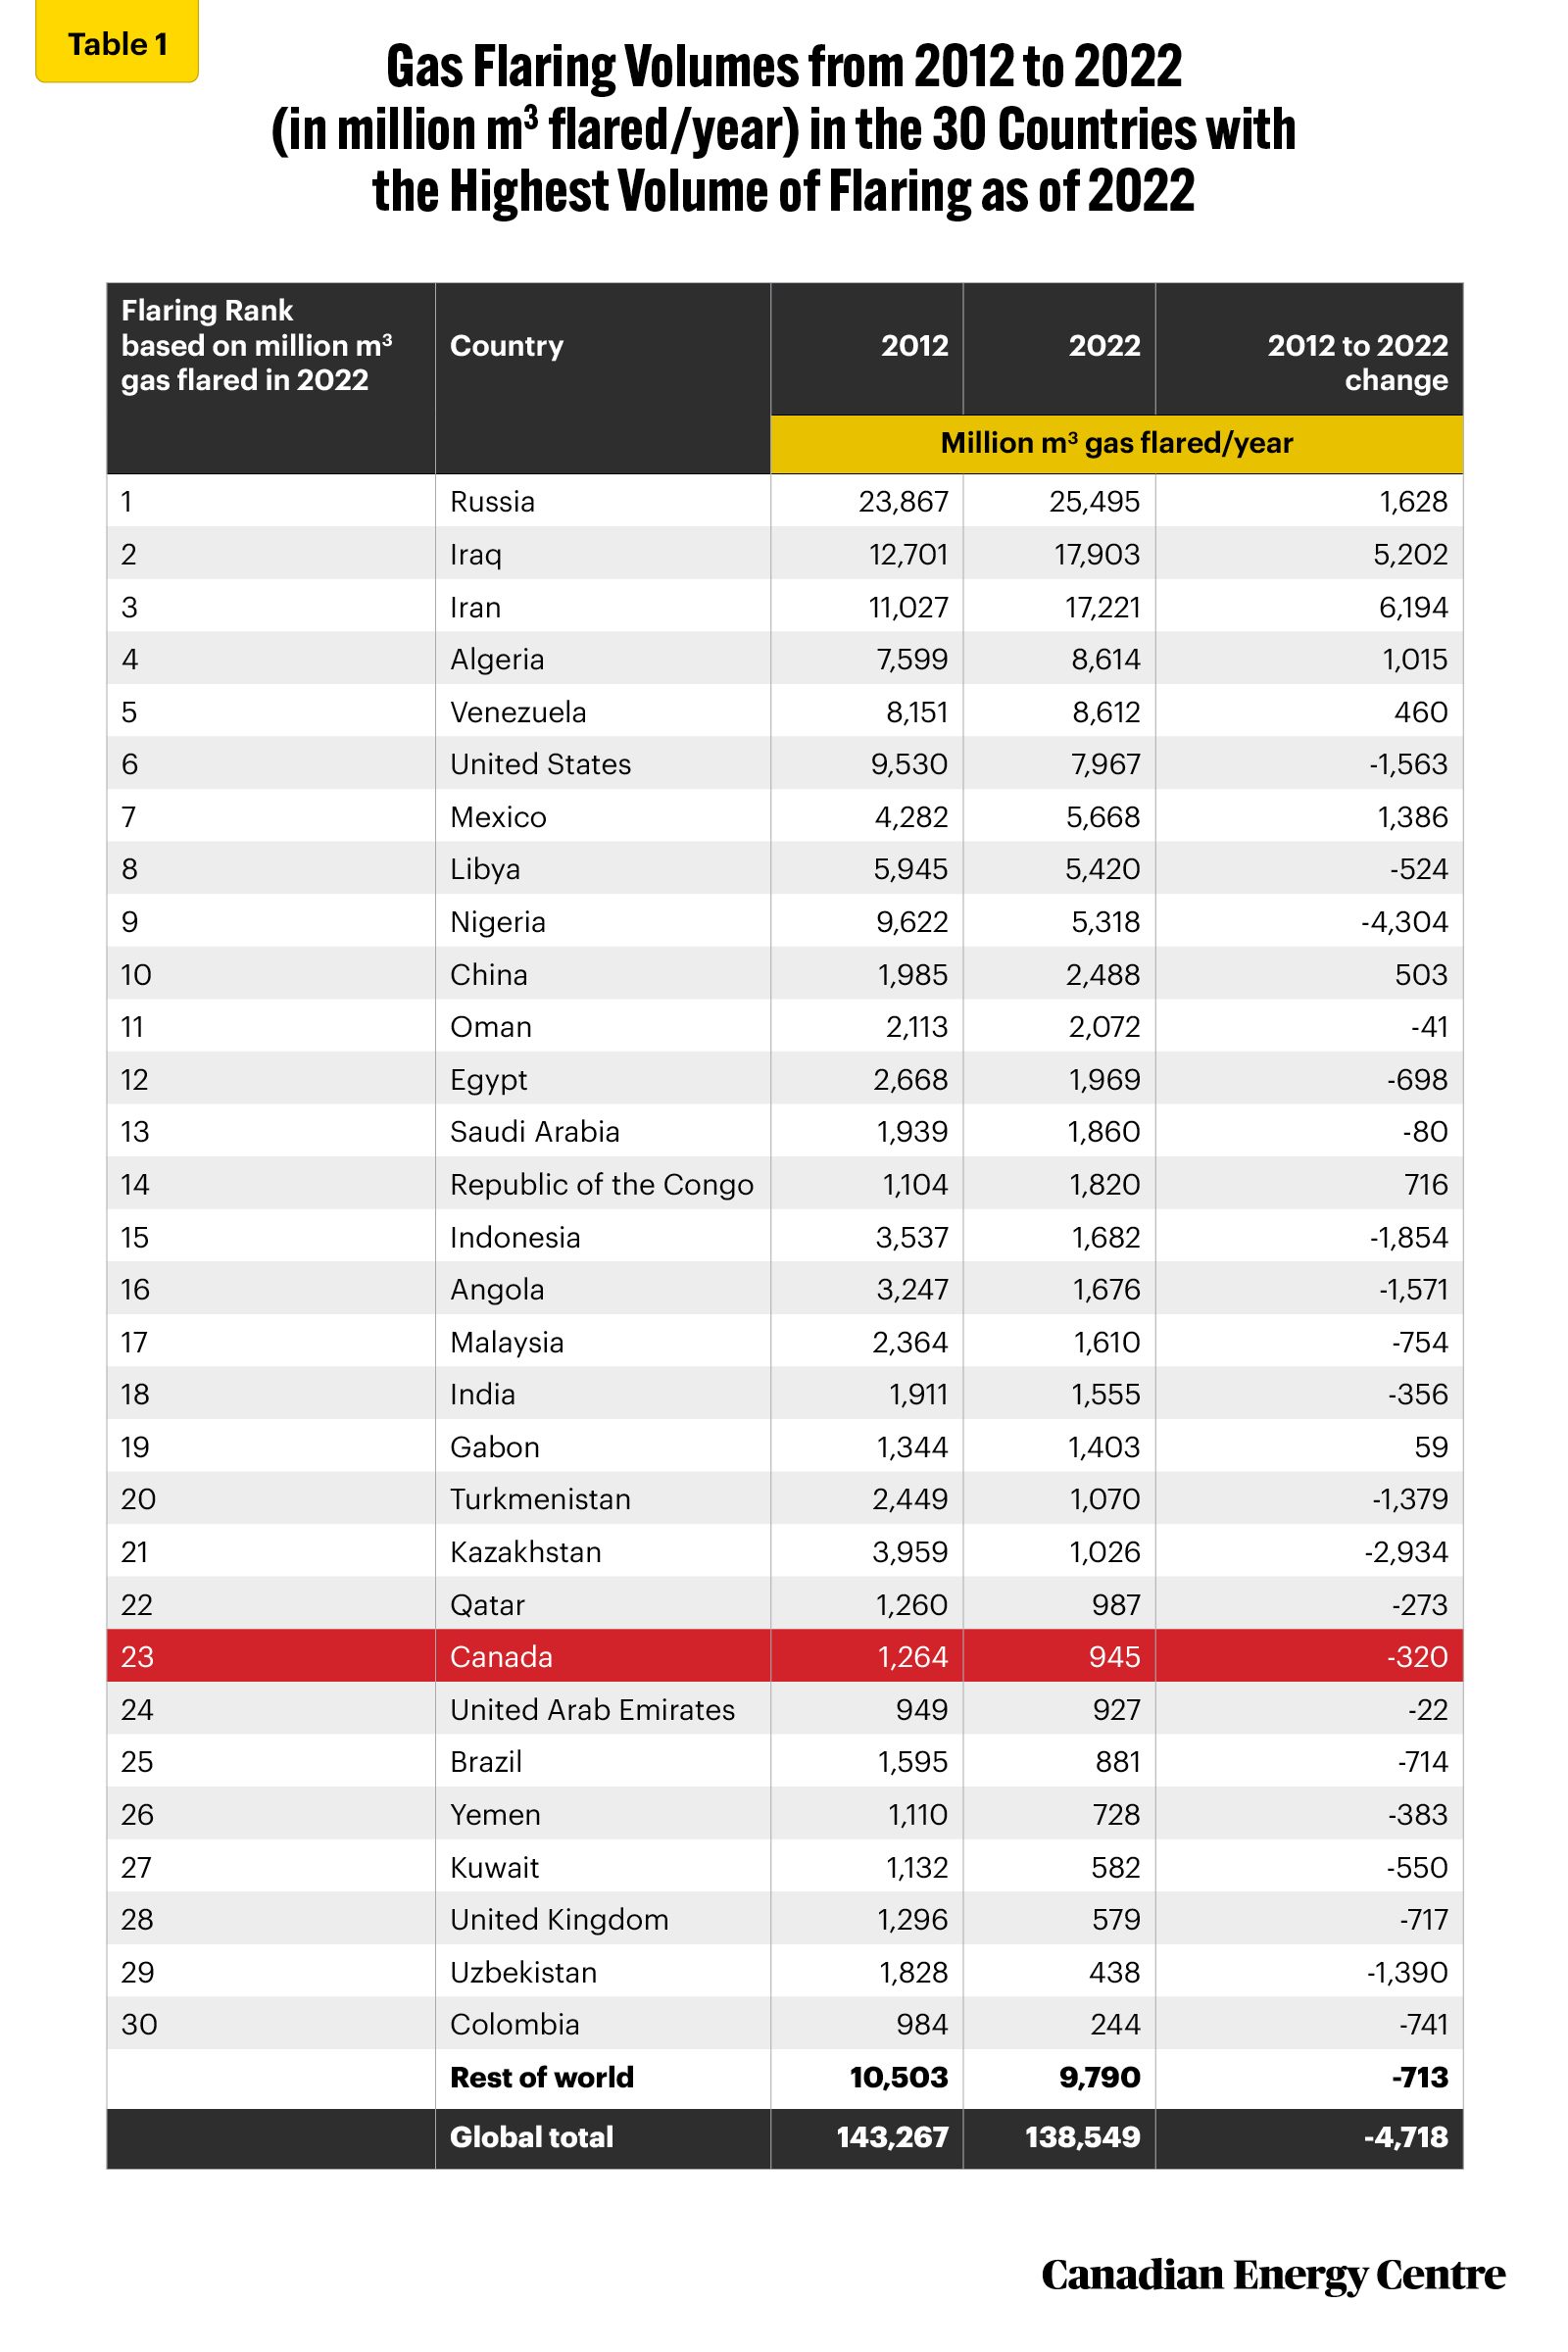
Sources: World Bank (undated)
Flaring declined worldwide between 2012 and 2022
Figure 1 shows the change in flaring volumes between 2012 and 2022. Nine countries flared more in 2022 than in 2012, while 21 countries flared less. In the last decade, the global flaring volume decreased by 3 per cent.
- The three countries that most significantly increased flaring between 2012 and 2022 were the Republic of the Congo (65 per cent), Iran (56 per cent), and Iraq (41 per cent).
- The three countries that most significantly decreased flaring between 2012 and 2022 were Uzbekistan (-76 per cent), Columbia (-75 per cent) and Kazakhstan (-74 per cent).
- As noted earlier, flaring fell by 25 per cent in Canada between 2012 and 2022.

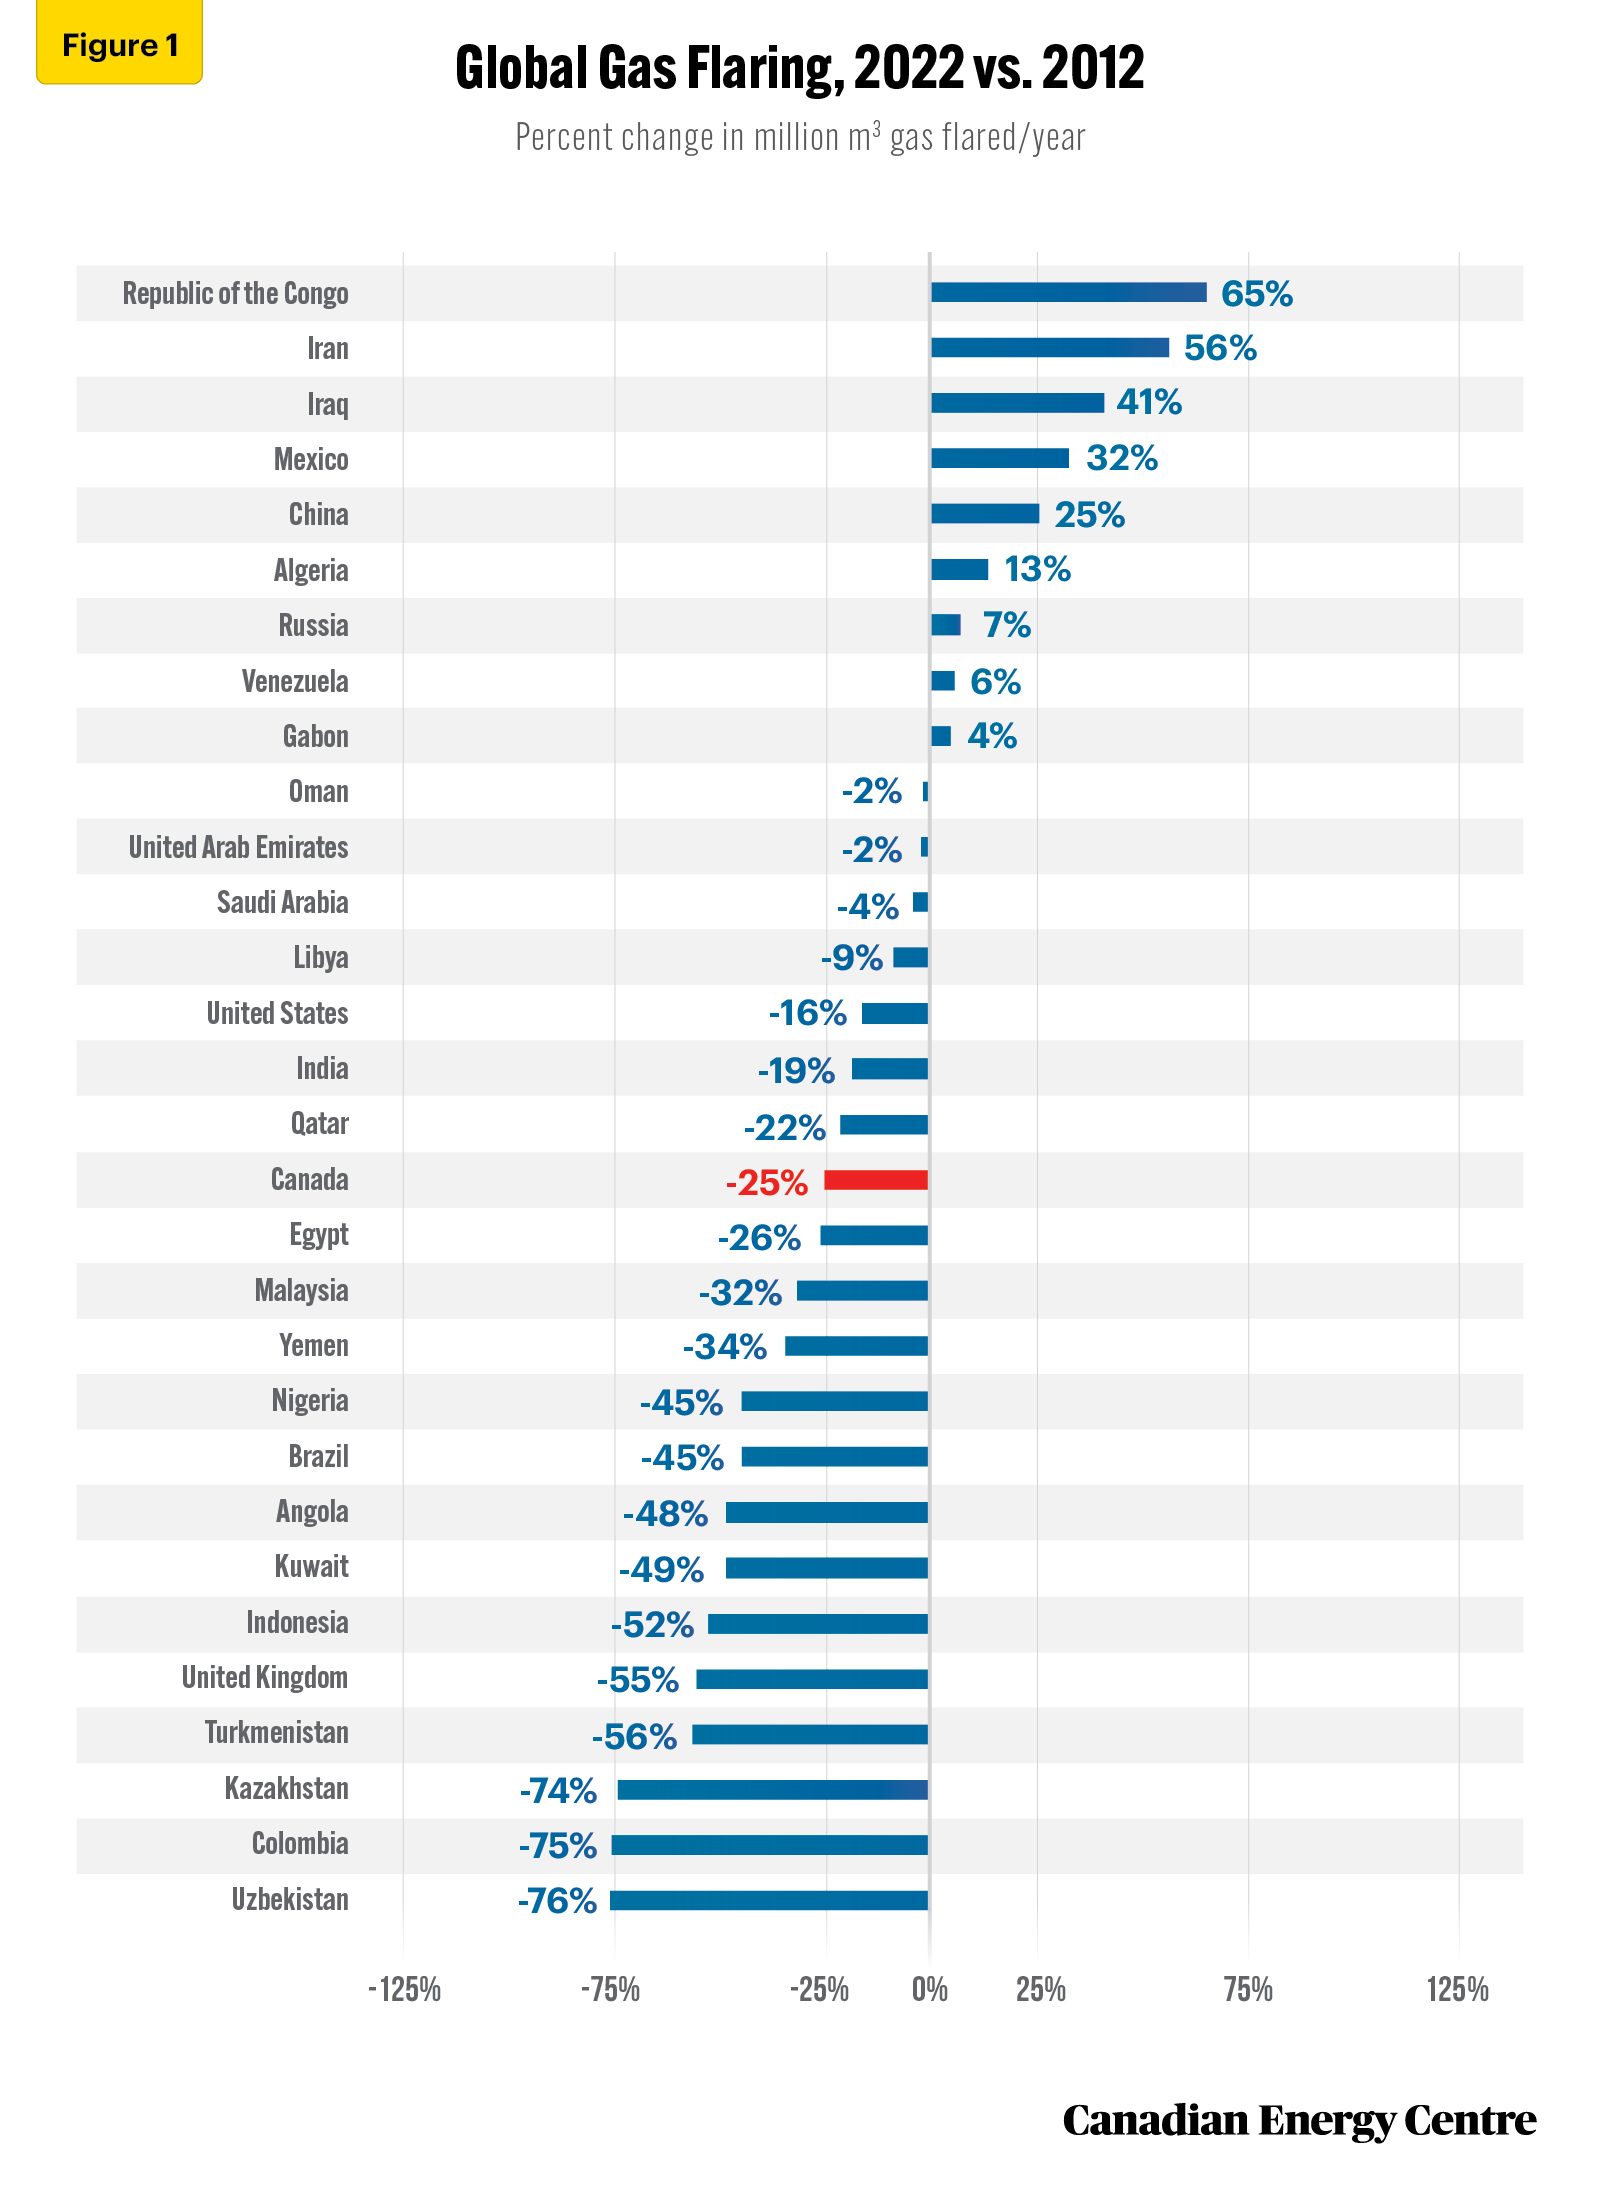
Sources: World Bank (undated)
Comparing flaring to increased production
The decreases in flaring in Canada between 2012 and 2022 shown in Table 1 and Figure 1 understate the magnitude of the decline in flaring in the country. That is because Canada’s crude oil production increased by 45 per cent in that period, even as absolute flaring decreased by 25 per cent (see Table 2).
Canada compares very favourably with the United States, which increased crude oil production by 82 per cent and decreased flaring by 16 per cent.

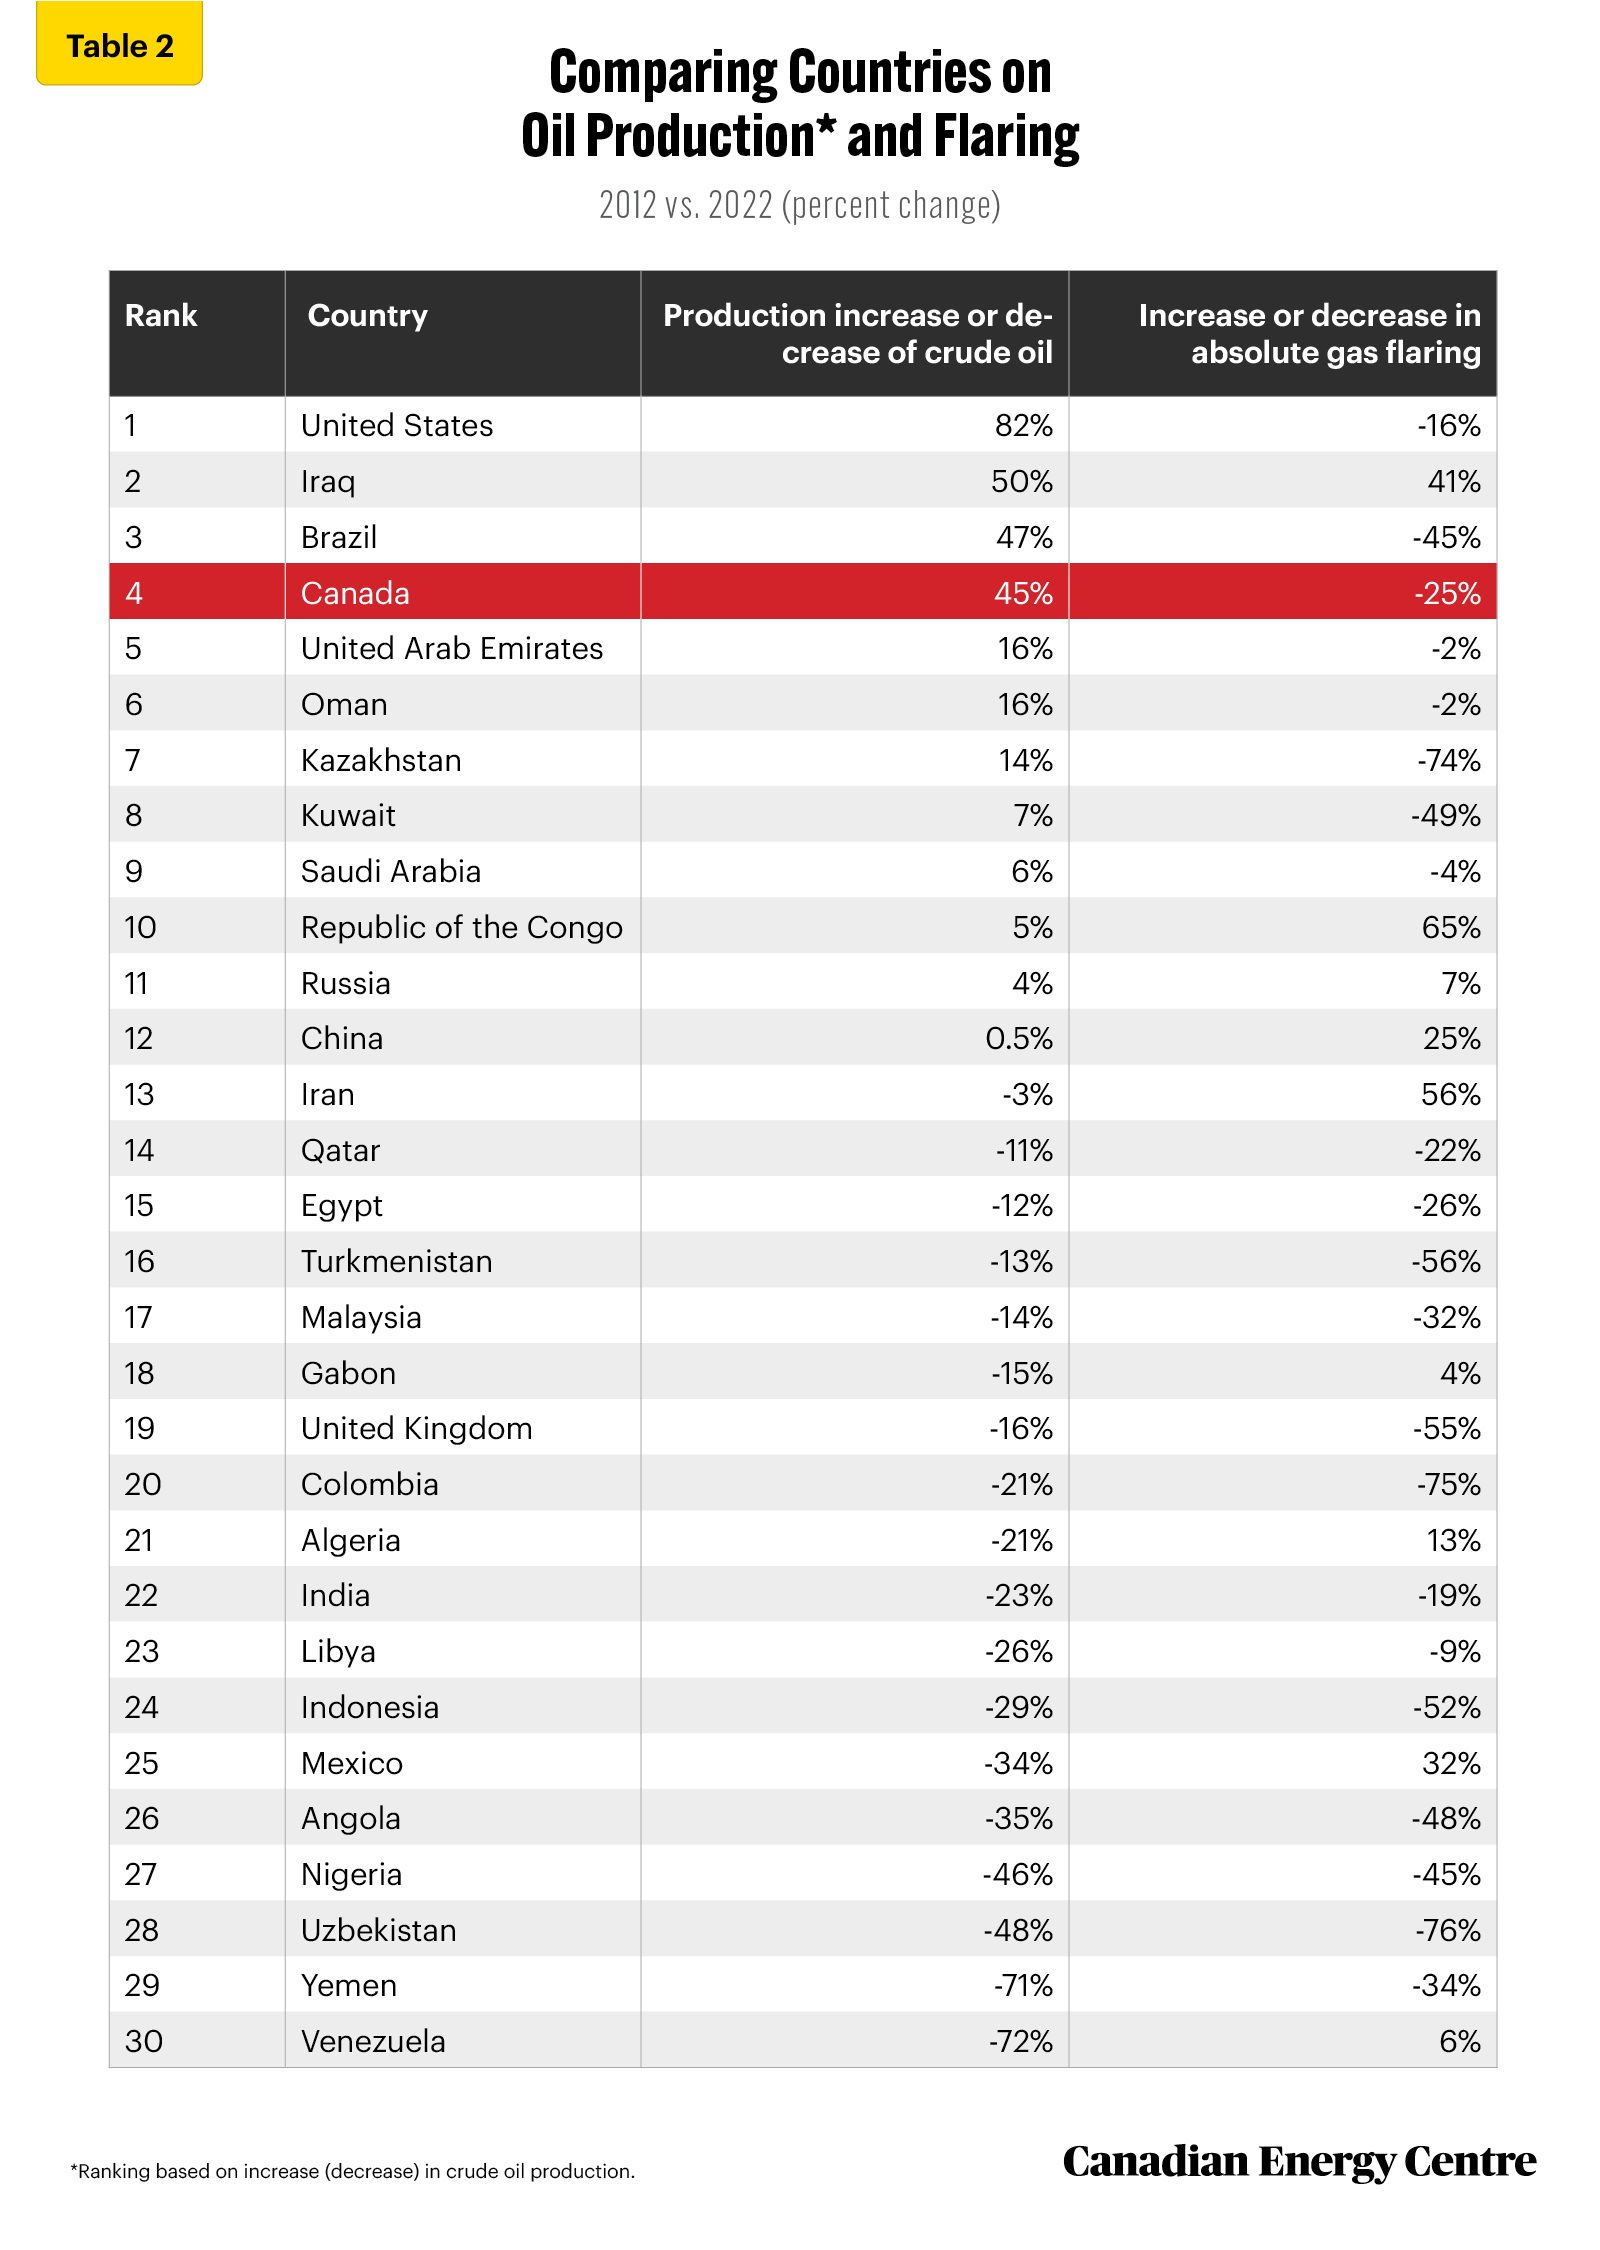
Sources: World Bank (undated) and EIA (2023)
Largest oil producers and flaring intensity
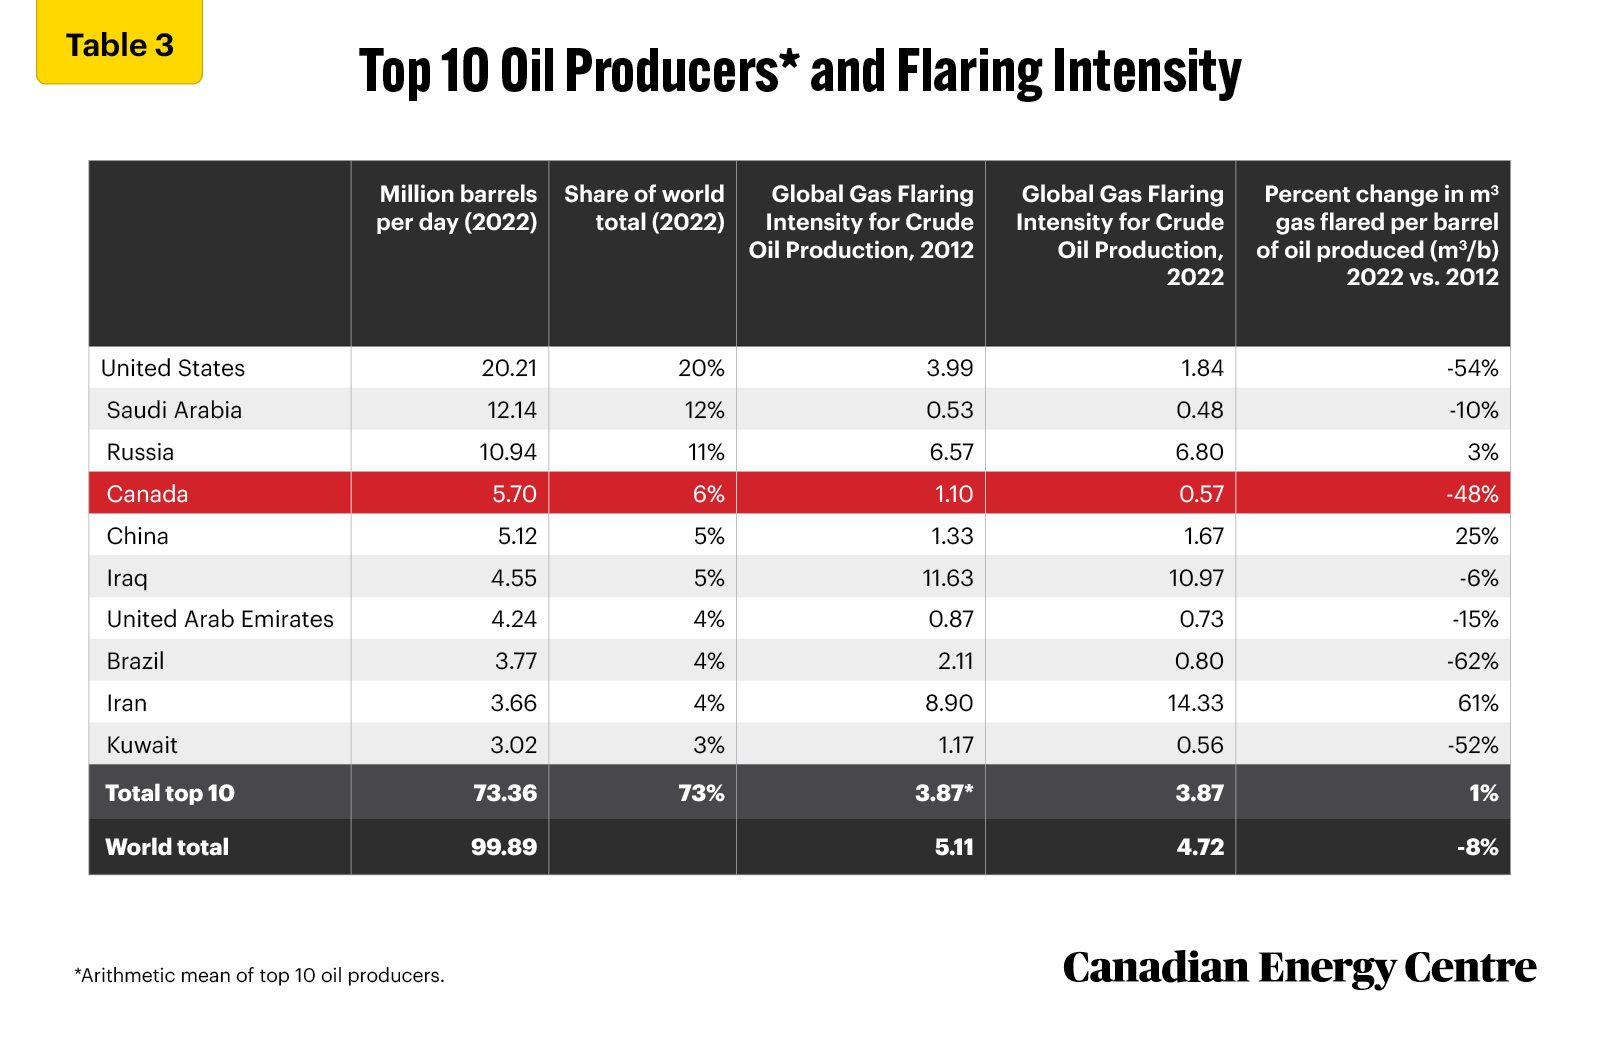
To fully grasp how much more effective Canada has been than many other oil producers in reducing flaring, Table 3 compares both flaring intensity (gas flared per unit of oil production) and crude oil production among the top 10 oil producing countries (which account for 73 per cent of the world oil production).
Canada is the fourth-largest producer of crude oil, and its gas flaring intensity declined by 48 per cenft between 2012 and 2022. Four of the top 10 oil producers witnessed their flaring intensity increase between 2012 and 2022.

Sources: World Bank (undated) and EIA (2023)
Conclusion
Gas flaring contributes to greenhouse gas emissions. However, it is possible for countries to both increase their oil production and still reduce flaring. Canada is one noteworthy example of a country that has significantly reduced flaring not only compared to its increased production of crude oil, but also in absolute terms.
Appendix
Background
Flaring and venting are two ways in which an oil or natural gas producer can dispose of waste gases. Venting is the intentional controlled release of uncombusted gases directly to the atmosphere, and flaring is combusting natural gas or gas derived from petroleum in order to dispose of it.¹ As Matthew R. Johnson and Adam R. Coderre noted in their 2012 paper on the subject, flaring in the petroleum industry generally falls within three broad categories:
- Emergency flaring (large, unplanned, and very short-duration releases, typically at larger downstream facilities or off-shore platforms);
- Process flaring (intermittent large or small releases that may last for a few hours or a few days as occurs in the upstream industry during well-test flaring to assess the size of a reservoir or at a downstream plant during a planned process blowdown); and
- Production flaring (may occur continuously for years while oil is being produced).
To track GHGs from flaring and venting, Environment Canada (2016) defines such emissions as:
- Fugitive emissions: Unintentional releases from venting, flaring, or leakage of gases from fossil fuel production and processing, iron and steel coke oven batteries, or CO2 capture, transport, injection, and storage infrastructure.
- Flaring emissions: Controlled releases of gases from industrial activities from the combustion of a gas or liquid stream produced at a facility, the purpose of which is not to produce useful heat or work. This includes releases from waste petroleum incineration, hazardous emission prevention systems, well testing, natural gas gathering systems, natural gas processing plant operations, crude oil production, pipeline operations, petroleum refining, chemical fertilizer production, and steel production.
- Venting emissions: Controlled releases of a process or waste gas, including releases of CO2 associated with carbon capture, transport, injection, and storage; from hydrogen production associated with fossil fuel production and processing; of casing gas; of gases associated with a liquid or a solution gas; of treater, stabilizer, or dehydrator off-gas; of blanket gases; from pneumatic devices that use natural gas as a driver; from compressor start-ups, pipelines, and other blowdowns; and from metering and regulation station control loops.