


Whiplash-causing month-to-month services PPI fell in July after hot readings in prior months. Core goods PPI is well-behaved.
By Wolf Richter for WOLF STREET.
The sharp deceleration on a year-over-year basis of the core Producer Price Index and the services PPI in July was a one-time shot, caused by the services PPI of July 2023 (+9.9%), the highest month-to-month reading in over two years, to fall out of the 12-month figure and be replaced by July 2024 (-1.9%), lowest month-to-month reading since March 2023.
It won’t repeat the rest of the year because all the remaining month-to-month figures that will fall out of the average over the next five months were low to negative. And the base effect that was such a tailwind in July will flip to a headwind in August and going forward.
And in terms of the month-to-month figures (the blue lines in the charts below), well they’re whiplash volatile.
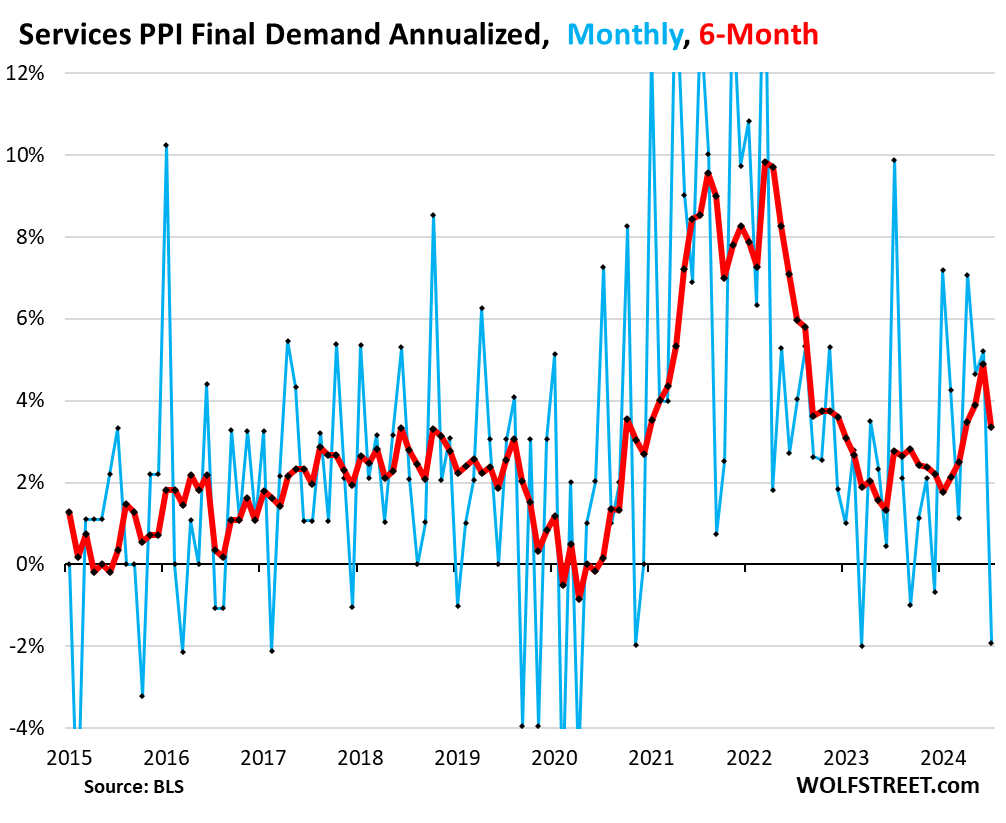
On a month-to-month basis, the Producer Price Index for final demand, which tracks inflation in the goods and services that companies buy and ultimately try to pass on to their customers, decelerated in July from June, on a plunge into the negative by the services PPI, after the hot readings in prior months. The PPI for finished core goods, which exclude food and energy products, accelerated month to month but remains well-behaved.
Services PPI fell by 1.9% annualized in July from June, seasonally adjusted, after the jumps of 5.2% in June, 4.7% in May, and 7.1% in April, according to data by the Bureau of Labor Statistics today (blue in the chart below).
The 6-month average decelerated to 3.4% annualized in July, after having risen at a red-hot pace of 4.9% in June, the highest since August 2022 (red). The six-month rate irons out some of the whiplash volatility of the month-to-month readings and includes all revisions. It decelerated so sharply because the 7.1% January reading fell out of the average and was replaced by the negative 1.9% July reading.

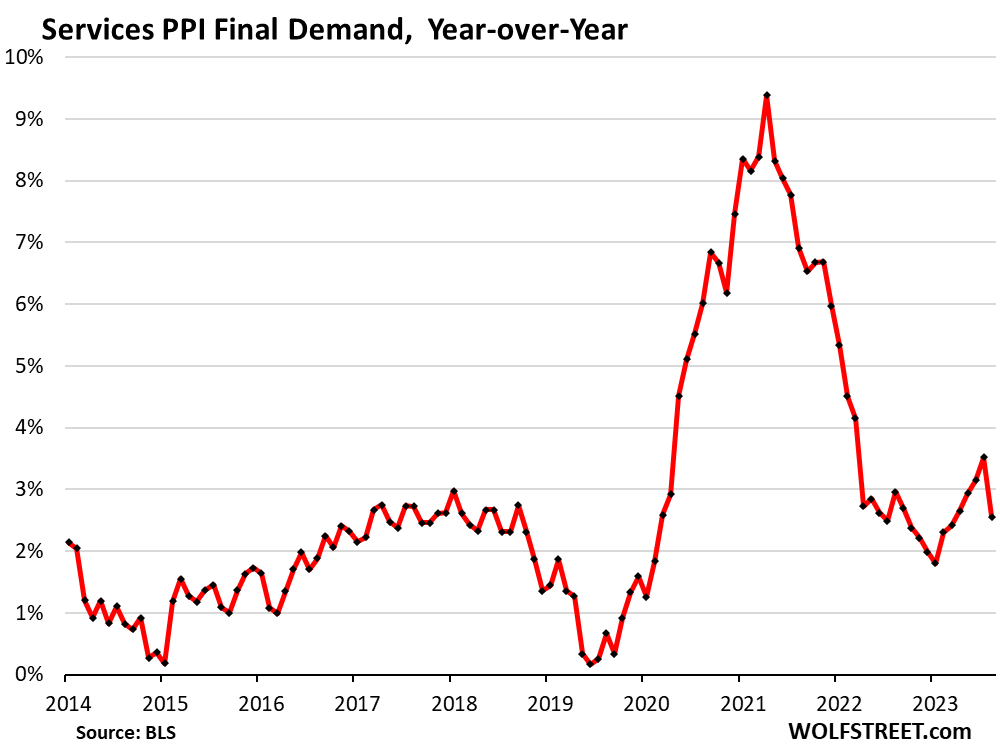
Year-over-year, the services PPI rose by 2.6% in July, a sharp deceleration from the 3.5% increase in June.
The extreme base effect: The year-over-year reading fell so sharply because the freak month-to-month spike of +9.9% annualized in July 2023 (the highest in over two years) was replaced by the drop of -1.9% annualized in July 2024 (the lowest since March 2023). Going forward, the low-to-negative month-to-month readings last year in August through December will come out of the 12-month base and be replaced by the readings going forward, and the tailwind of the base effect in July will flip to a headwind starting in August.

“Finished core goods” PPI is still well-behaved but accelerated in July from June, rising by 1.6% annualized, up from 0.8% in June. As we have seen all around, there have been no major inflation pressures building up in core goods in over a year. Inflation has been largely wrung out of core goods.
The six-month rate decelerated to 2.3% annualized from 2.7%, as the month-to-month 4.0% jump in January fell out of the average and was replaced by the 1.6% increase in July.
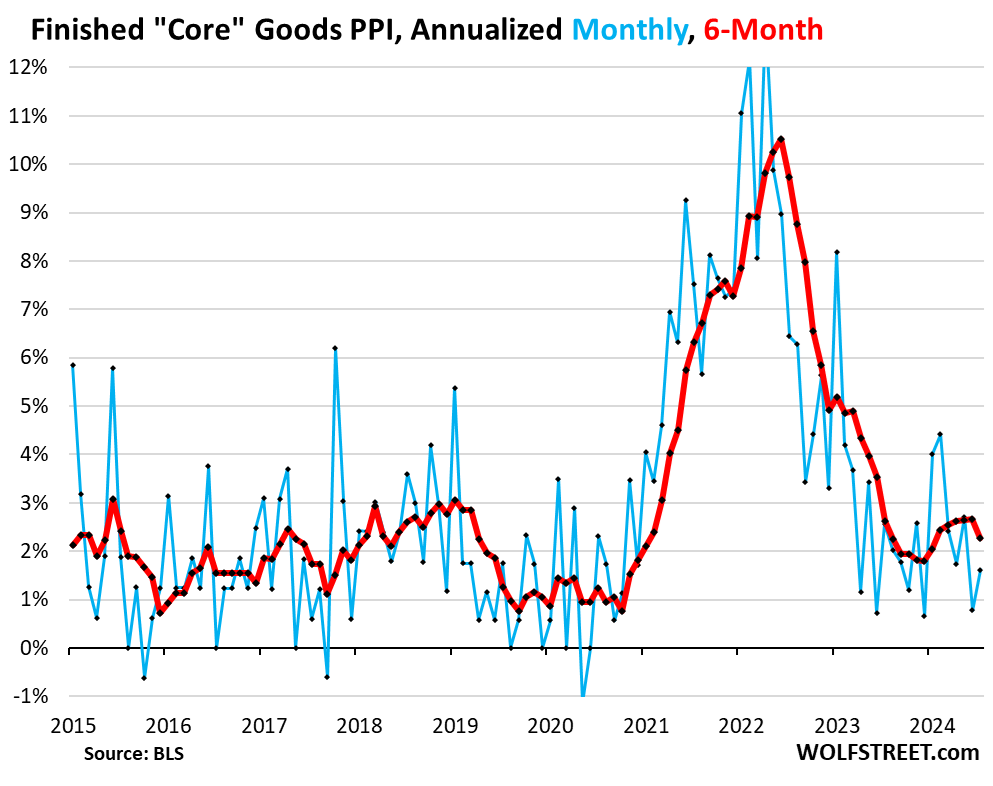

The PPI for “finished core goods” includes finished goods that companies buy except foods and energy. Prices have continued to rise, but a pace that’s in the normal pre-pandemic range.
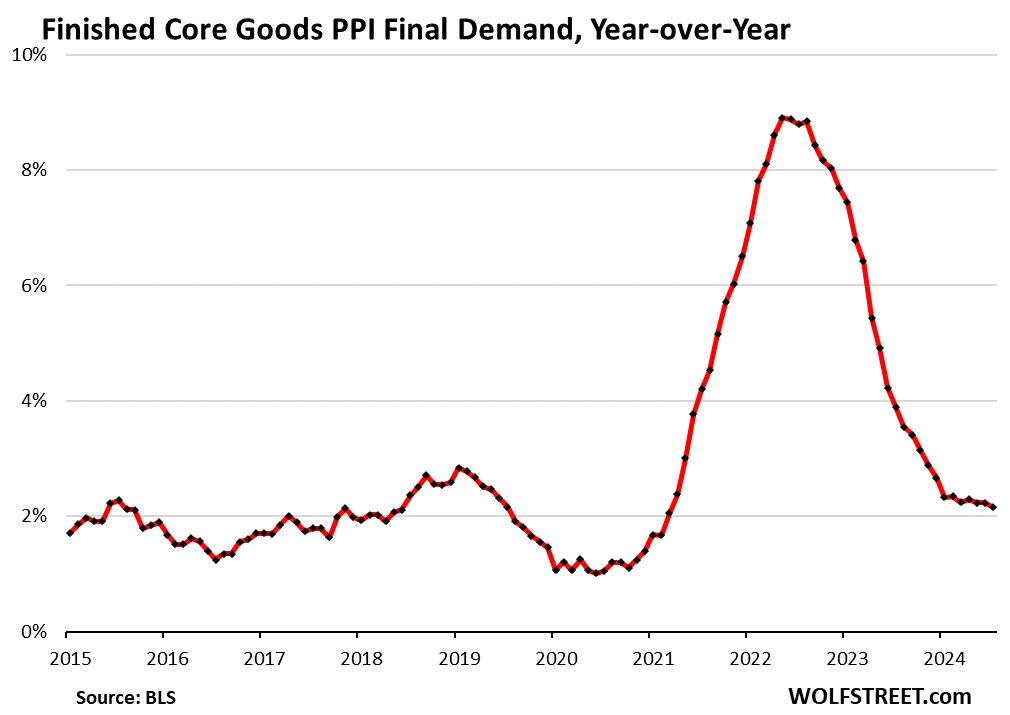
Year-over-year, the finished core goods PPI has been around 2.2% all year with a minuscule down-trend that gets lost in rounding – all of them the lowest since March 2021. In July, finished core goods PPI rose by 2.16%:

“Core” PPI fell by 0.6% annualized in July from June, seasonally adjusted (blue in the chart below), driven by the drop in services (-1.9%), which dominate core PPI, and muffled somewhat by the acceleration in finished core goods (+1.6%). The -0.6% annualized reading in July comes after the 4.1% increases in June and May, and the 6.1% increase in April.
The 6-month rate decelerated to 3.1% in July, from 4.2% in June, which had been the highest since September 2022. After being well-behaved much of 2023 near 2%, the 6-month rate re-took off in February (red).
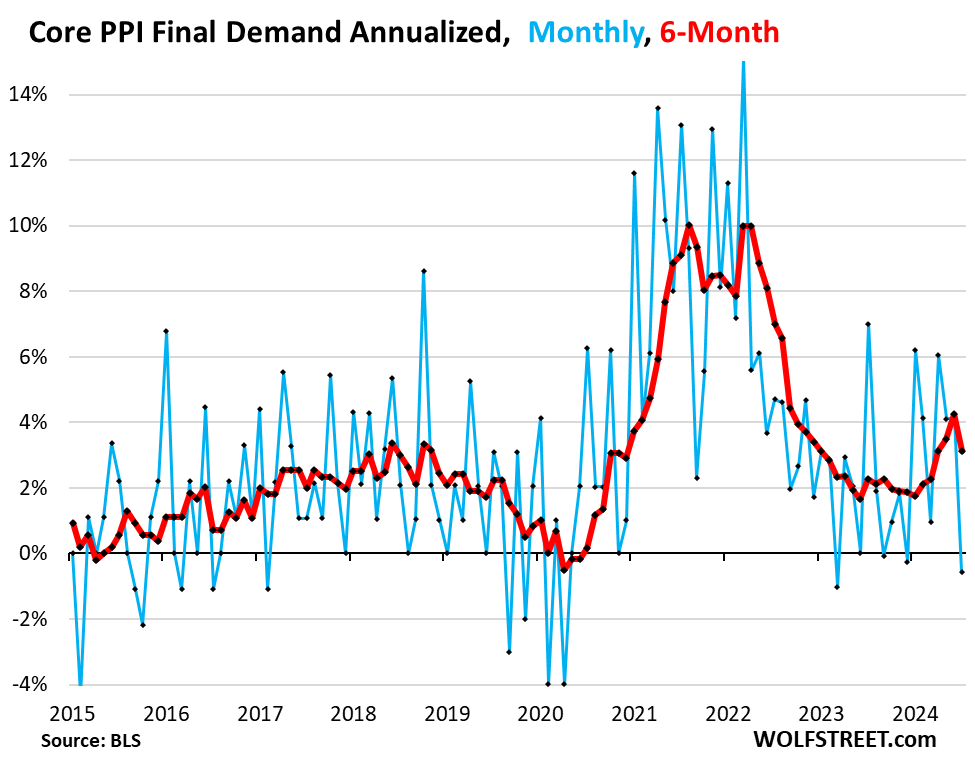

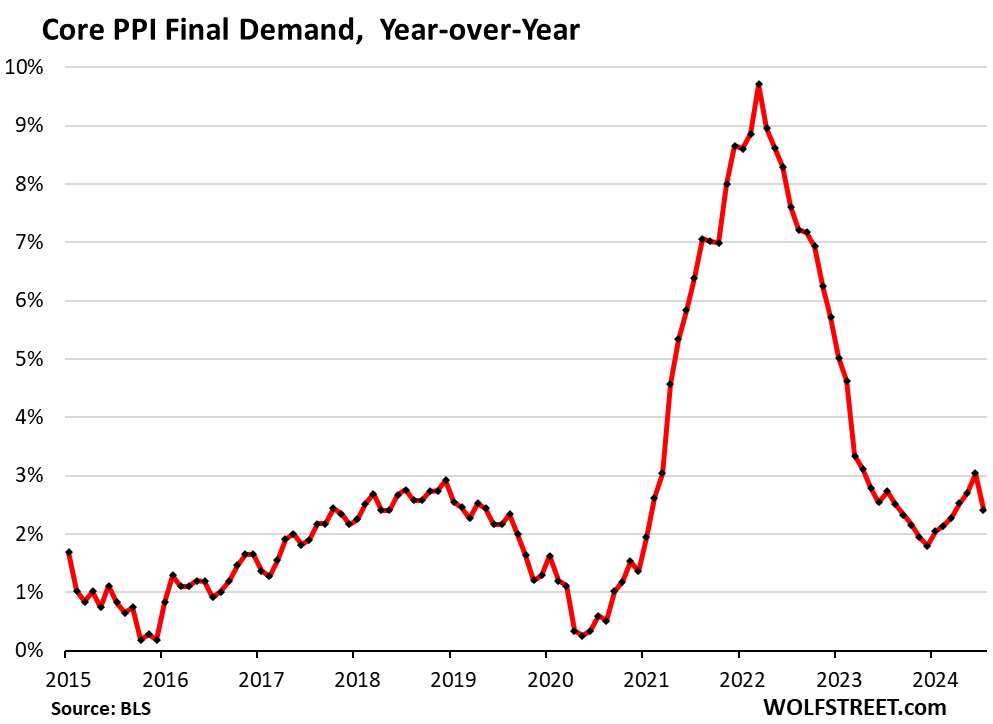
Year-over-year, core PPI rose by 2.6% annualized in July, a sharp deceleration from June, driven by the base effect in services, as we noted above. June (+3.0%) had been the worst reading since April 2023.
For the rest of the year, the readings this year will replaced the low to negative month-to-month readings from August through December 2023, and the tailwind of the big base effect in July becomes a headwind starting in August.

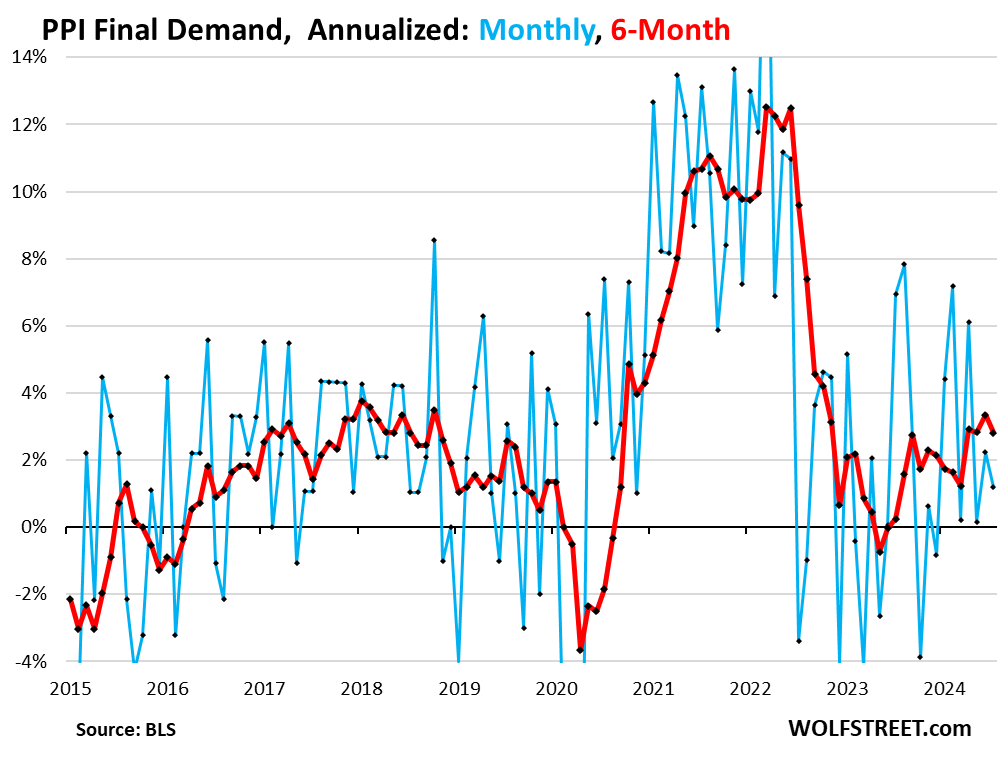
The overall PPI for final demand rose by 1.2% annualized in July from June, a deceleration from June (2.2%). The 6-month rate rose by 2.8% annualized, a deceleration from the 3.3% in June, which had been the highest since October 2022.

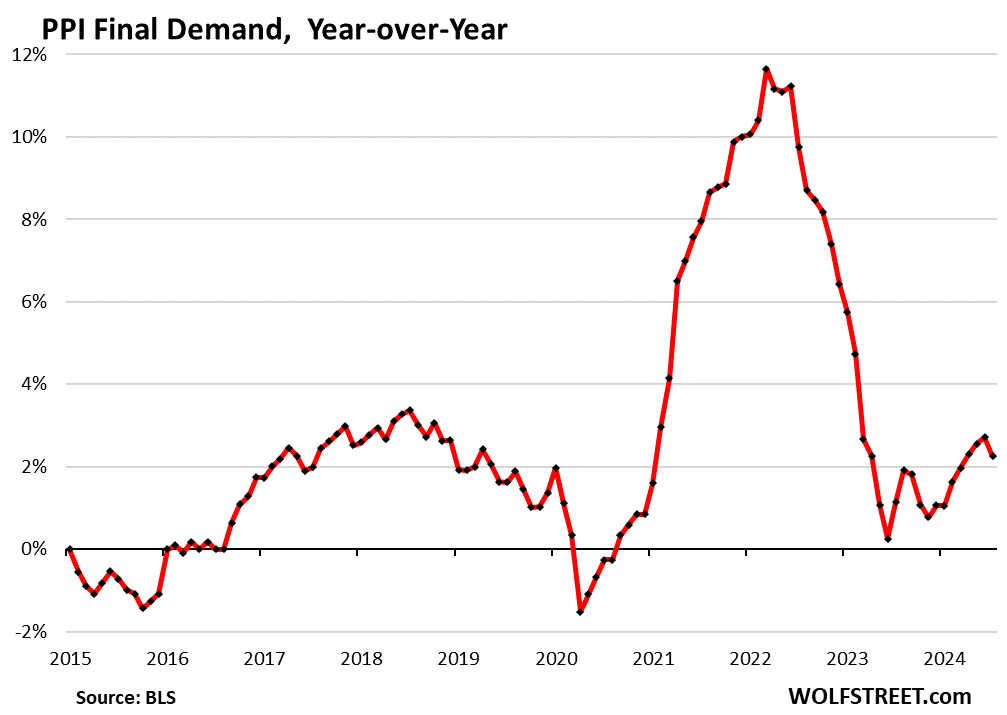
Year-over-year, overall PPI rose by 2.2%, a deceleration from 2.7% in June, which had been the highest since February 2023:

Take the Survey at https://survey.energynewsbeat.com/