


Germany, France, Italy, Spain, Netherlands, Poland, Belgium, Sweden, Ireland, Austria, Norway, Denmark, Romania, Czech Republic, Finland, Portugal
By Wolf Richter for WOLF STREET.
This is our second annual wild ride across sales prices of existing homes of all types (“dwellings”) in the 16 largest economies that are either in the European Union (EU) or in the European Economic Area (EEA), based on data from Eurostat through Q1, released on Friday. The data goes back to 2005 for some countries, and less far for other countries.
Some countries have or had indeed the most splendid housing bubbles, and a few of those have deflated some. Other countries had the most splendid housing bubbles 15 or more years ago. A few didn’t have any housing bubbles at all. And one essentially went nowhere over the past 15 years. So a wild ride across the spectrum.
Biggest decliners from the peak and year of that peak:
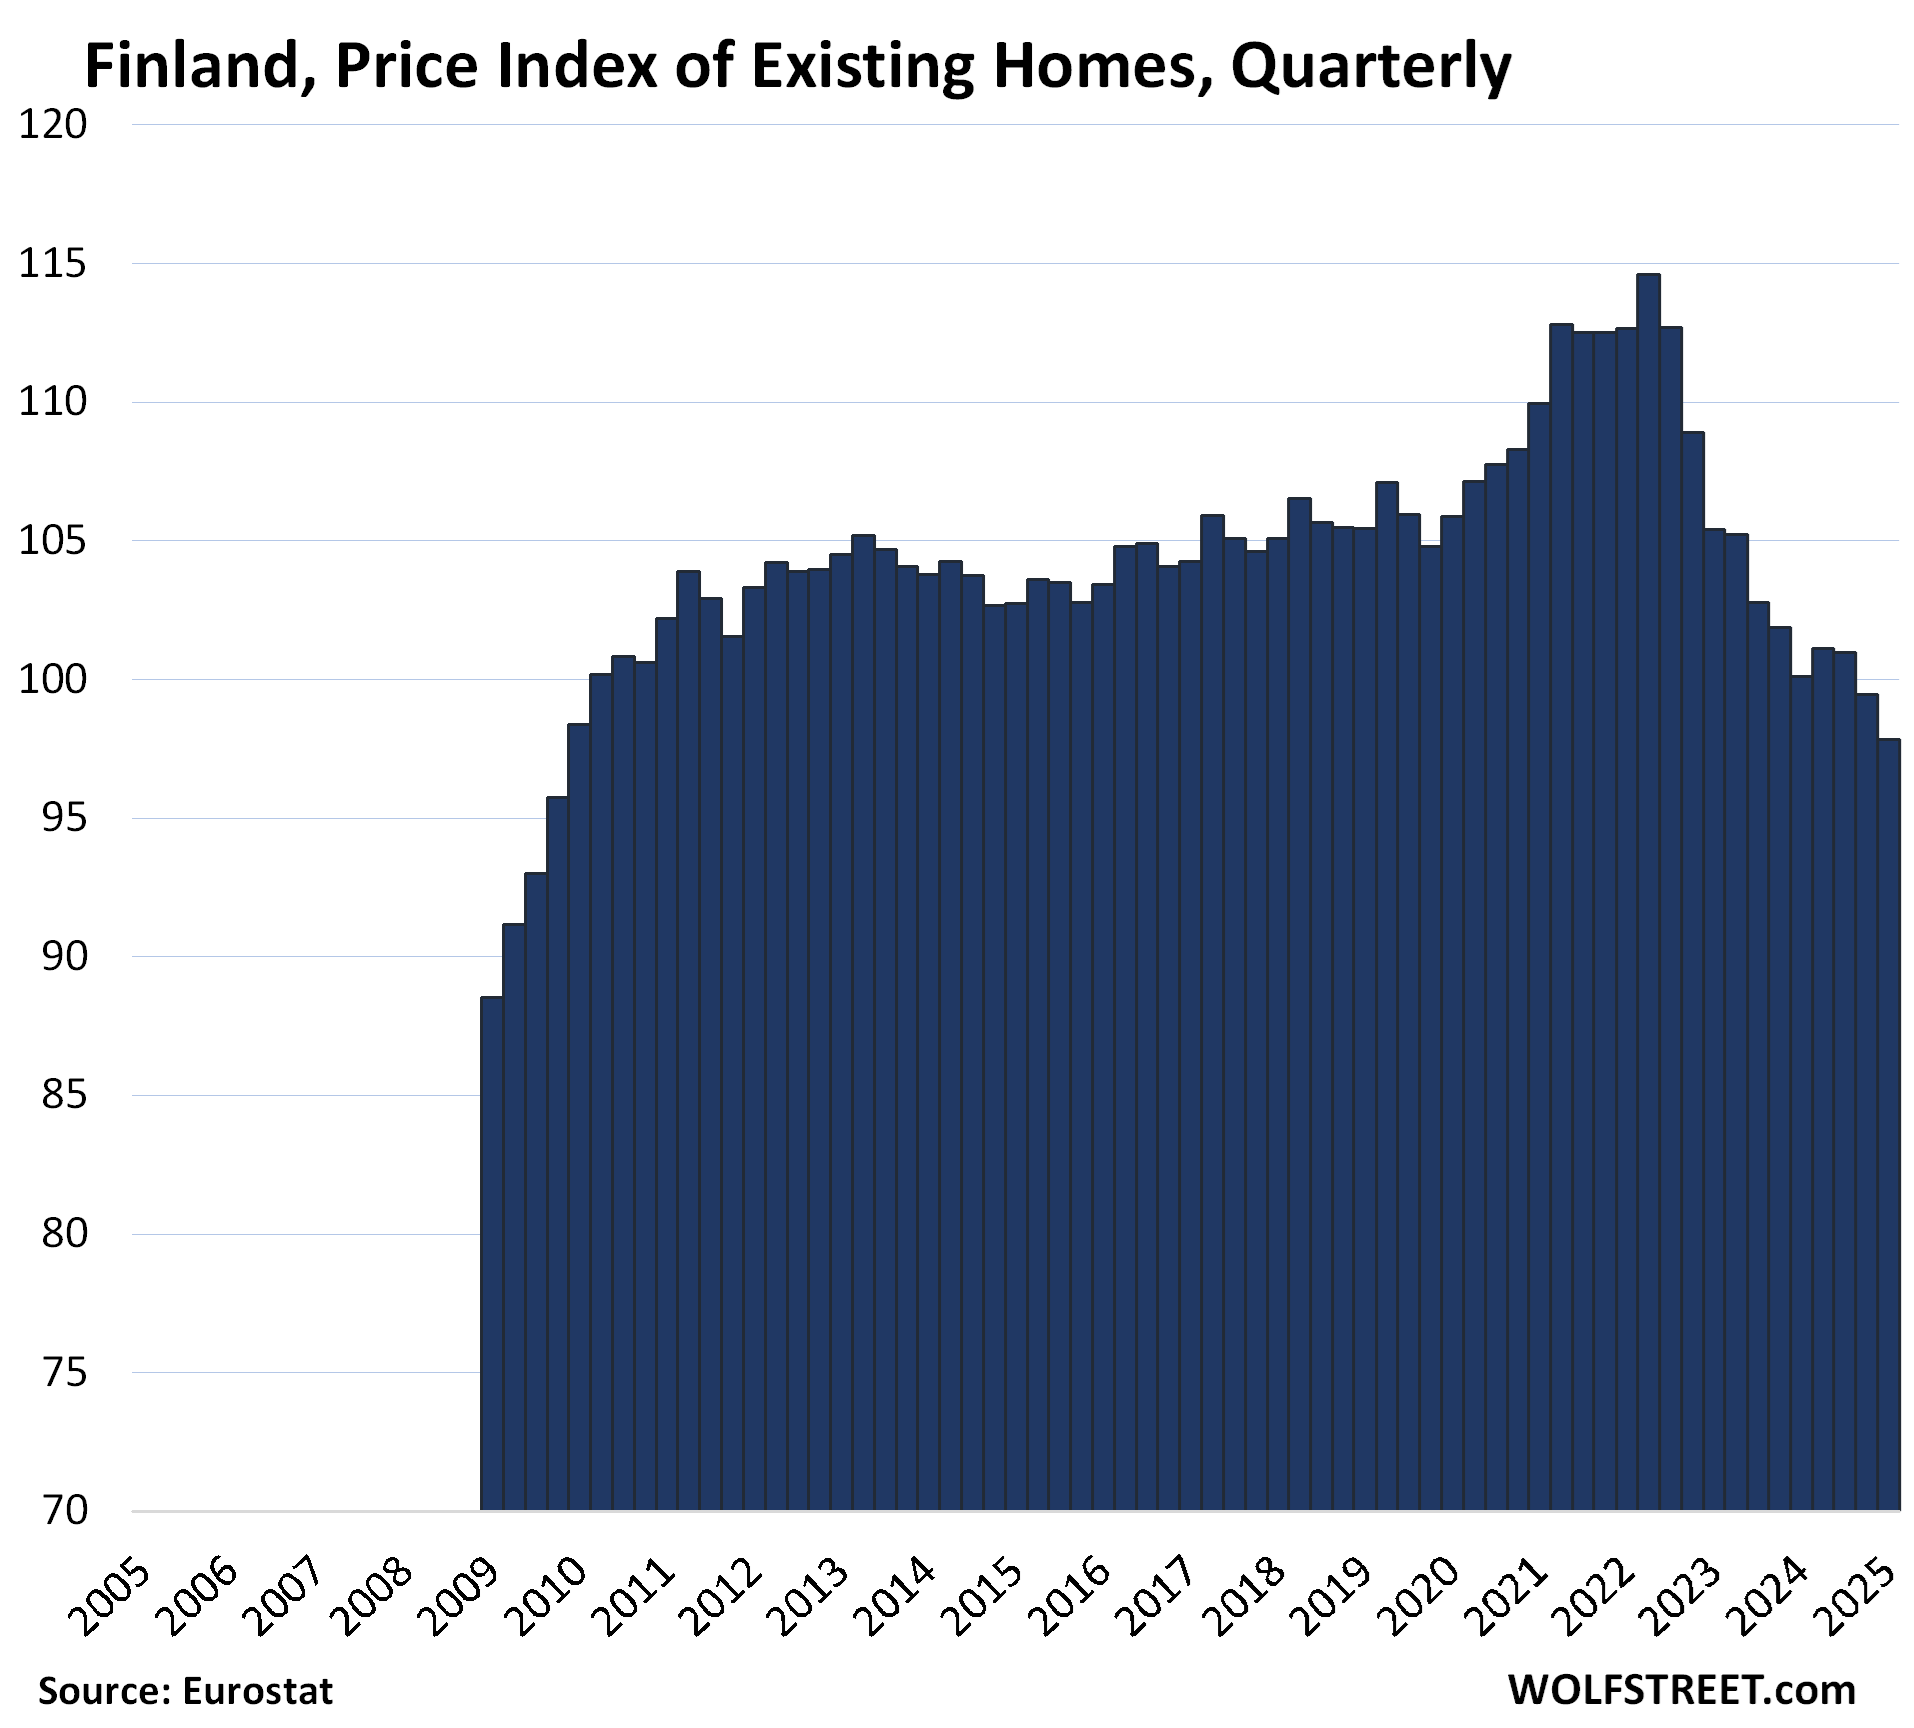
- Finland: -14.6% from Q2 2022
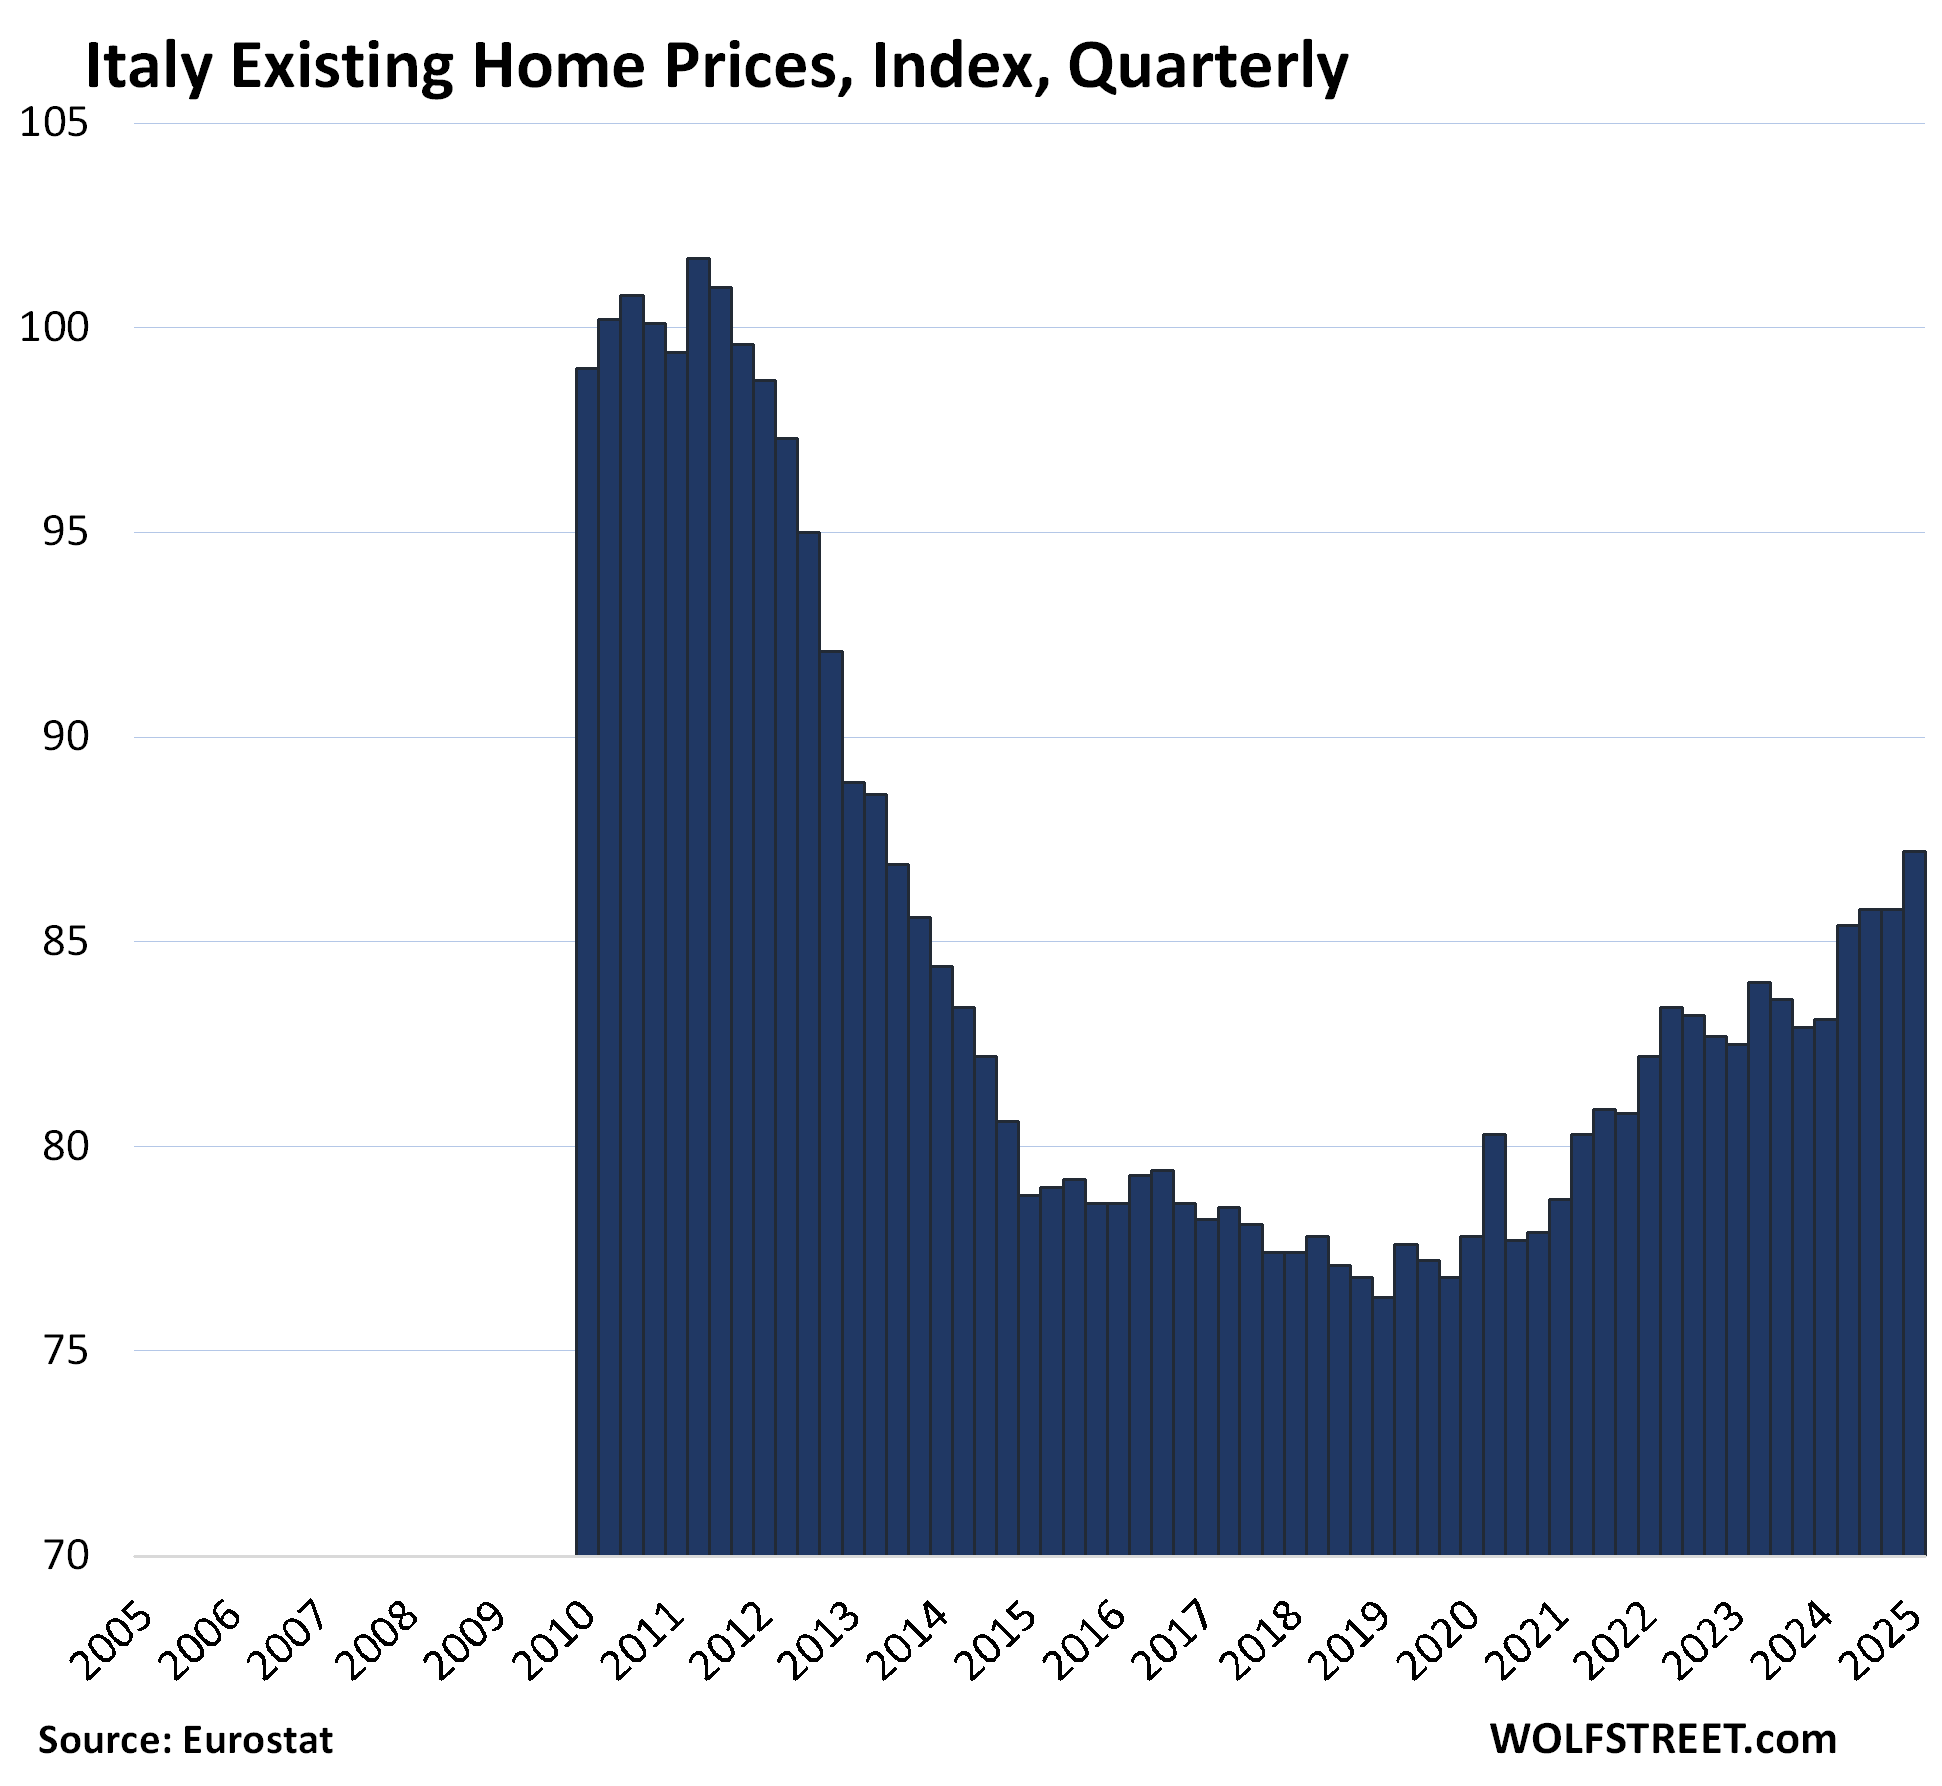
- Italy: -14.3% from Q2 2011
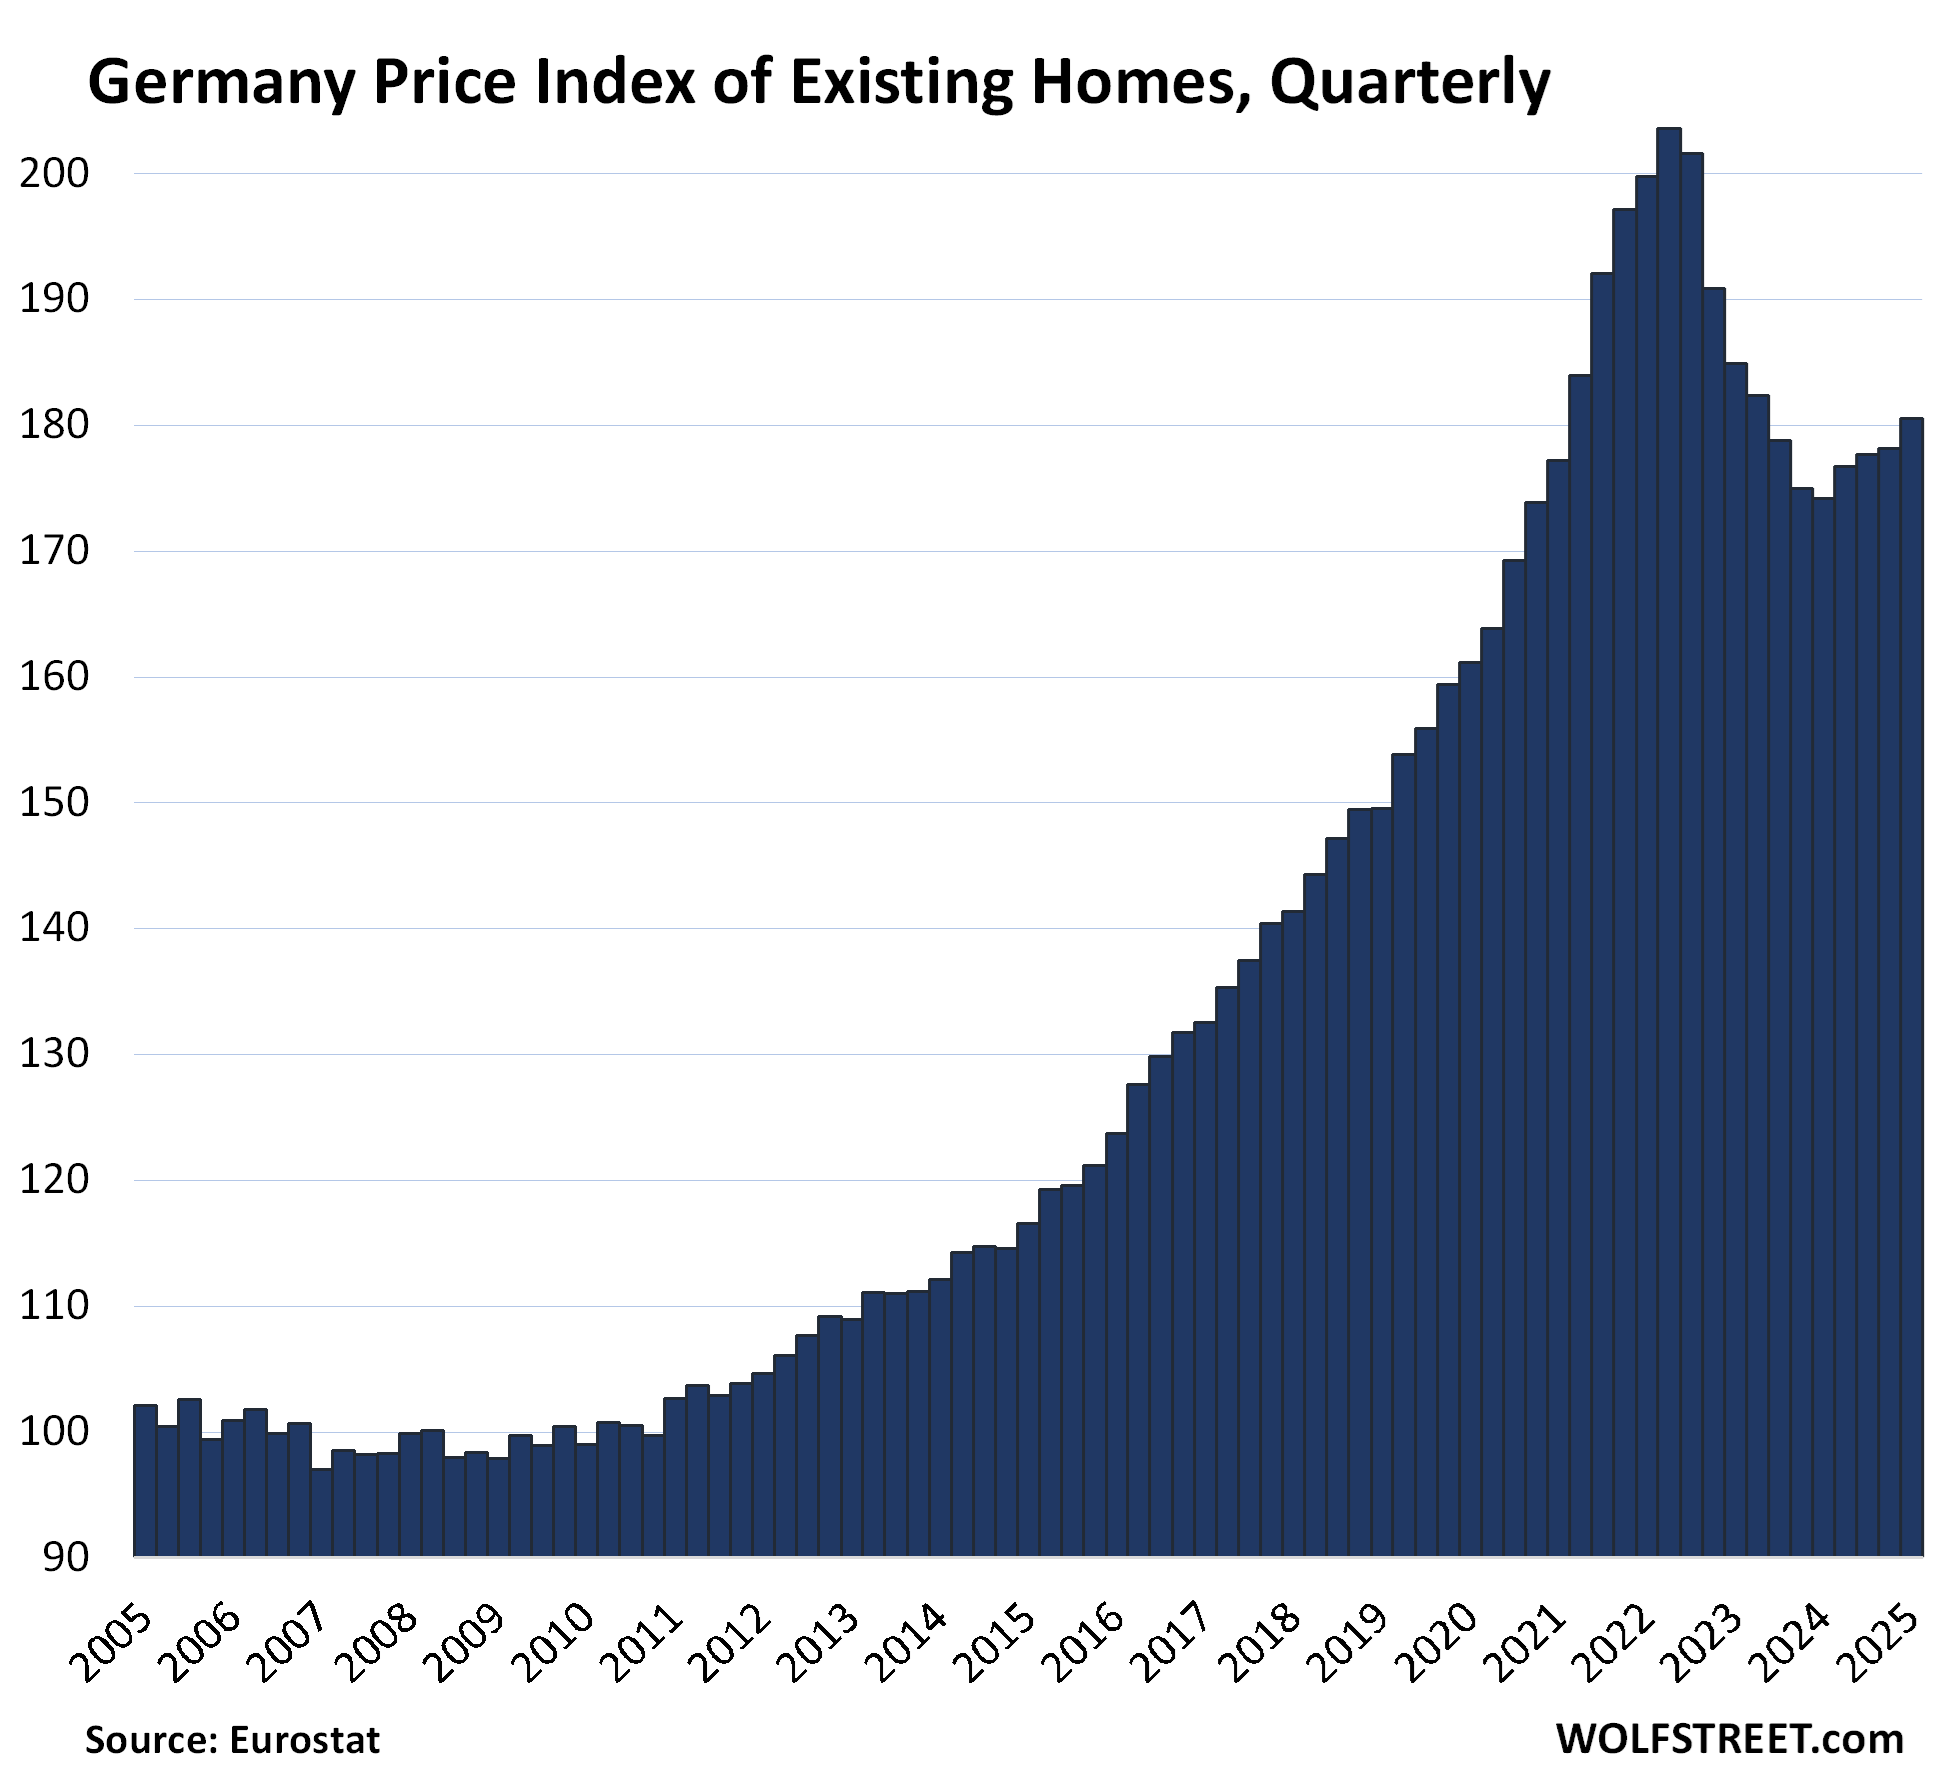
- Germany: -11.3% from Q2 2022
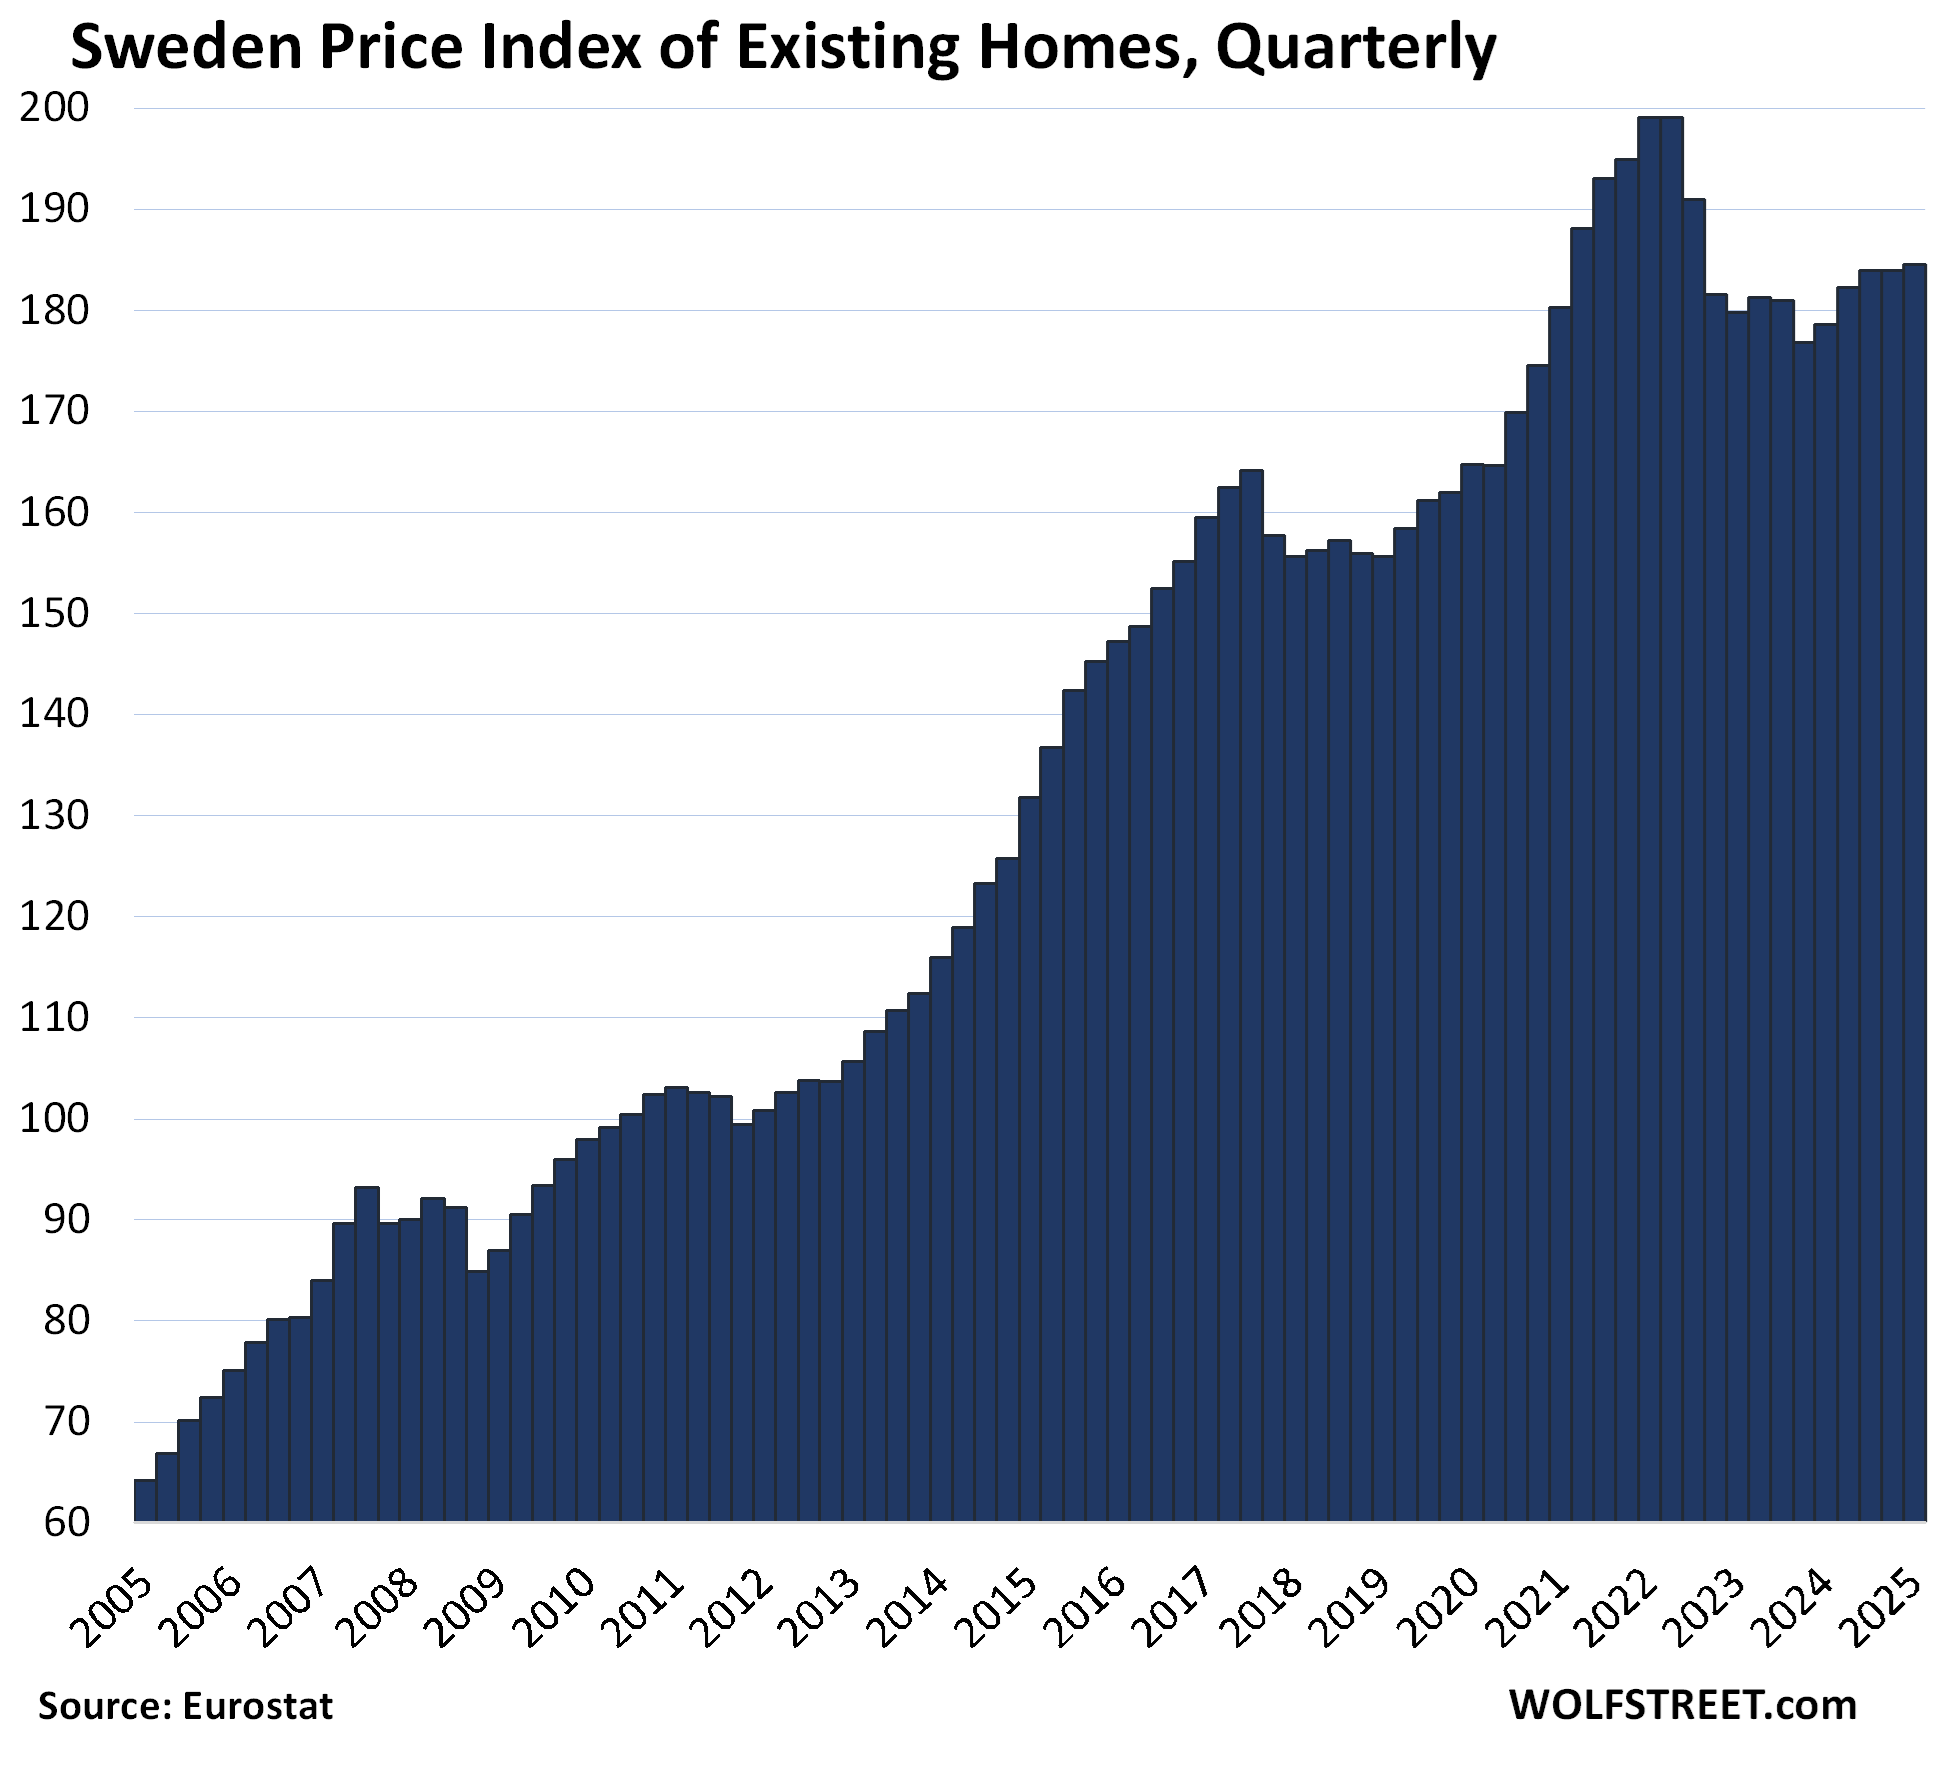
- Sweden: -7.3% from Q2 2022
- Austria: -7.3% from Q3 2022
- France: -6.5% from Q3 2022
Triple-digit gainers from 2010 to their respective peak:
- Czech Republic: +146%
- Portugal: +139%
- Austria: +136%
- Norway: +111%
- Poland: 108%
- Germany: +106%
- Sweden: +103%
The home price indices for the biggest European markets:
The little tables show either three or four columns:
(1) % change from 2010 to the peak, whether the peak was in 2022 or in the current quarter. But in some countries, the peak was before 2010, such as in Italy and Spain, and those markets don’t have that column. (2) Quarter-over-quarter % change. (3) Year-over-year % change. And (4) % change in the current quarter from the peak.
Of the 16 markets, 7 are down from their peaks:
| Finland, Prices of Existing Homes | |||
| 2010 to Peak | QoQ | YoY | From peak |
| 16.5% | -1.6% | -2.3% | -14.6% |
The index fell back to where it had first been in 2010. This is an example of a housing market that really hasn’t gone anywhere in 15 years.

| Italy, Prices of Existing Homes | ||
| QoQ | YoY | From peak |
| 1.63% | 4.9% | -14.3% |
The recovery started during the pandemic.

| Germany, Prices of Existing Homes | |||
| 2010 to Peak | QoQ | YoY | From peak |
| 105.7% | 1.3% | 3.6% | -11.3% |
The index is where it had been in 2021.

| Sweden, Prices of Existing Homes | |||
| 2010 to Peak | QoQ | YoY | From peak |
| 103.2% | 0.3% | 3.3% | -7.3% |
Also back to 2021.

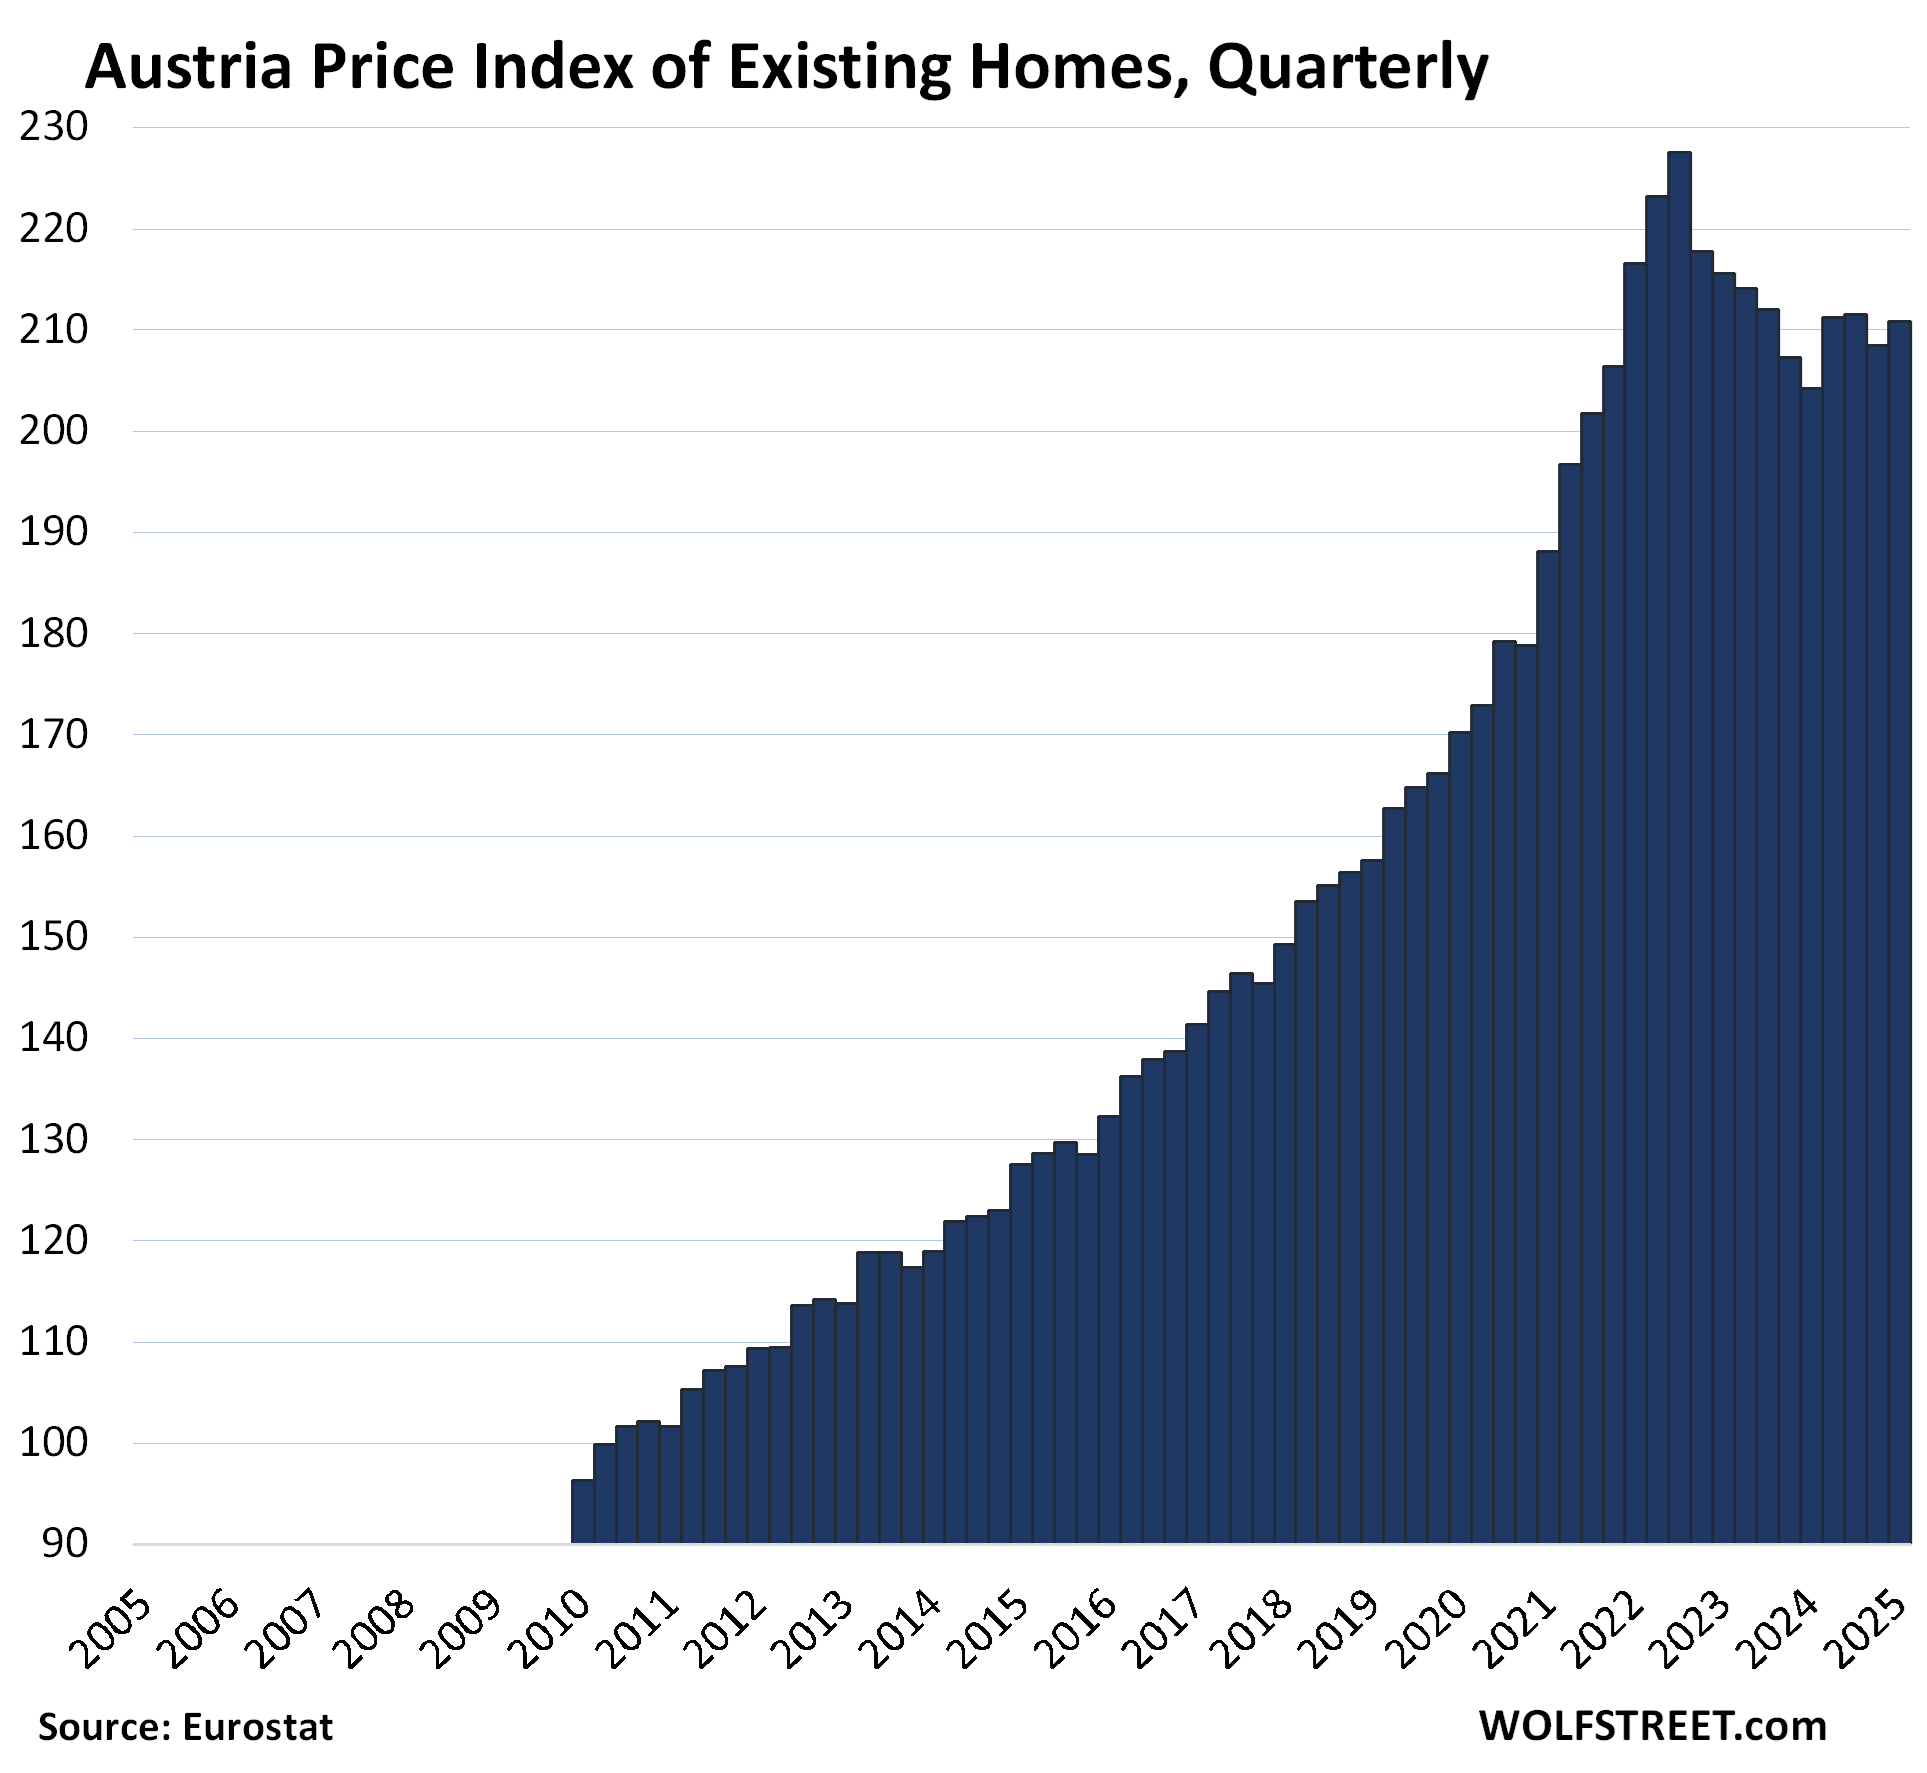
| Austria, Prices of Existing Homes | |||
| 2010 to Peak | QoQ | YoY | From peak |
| 136.2% | 1.1% | 3.3% | -7.3% |
The index is also back where it had been in 2021.

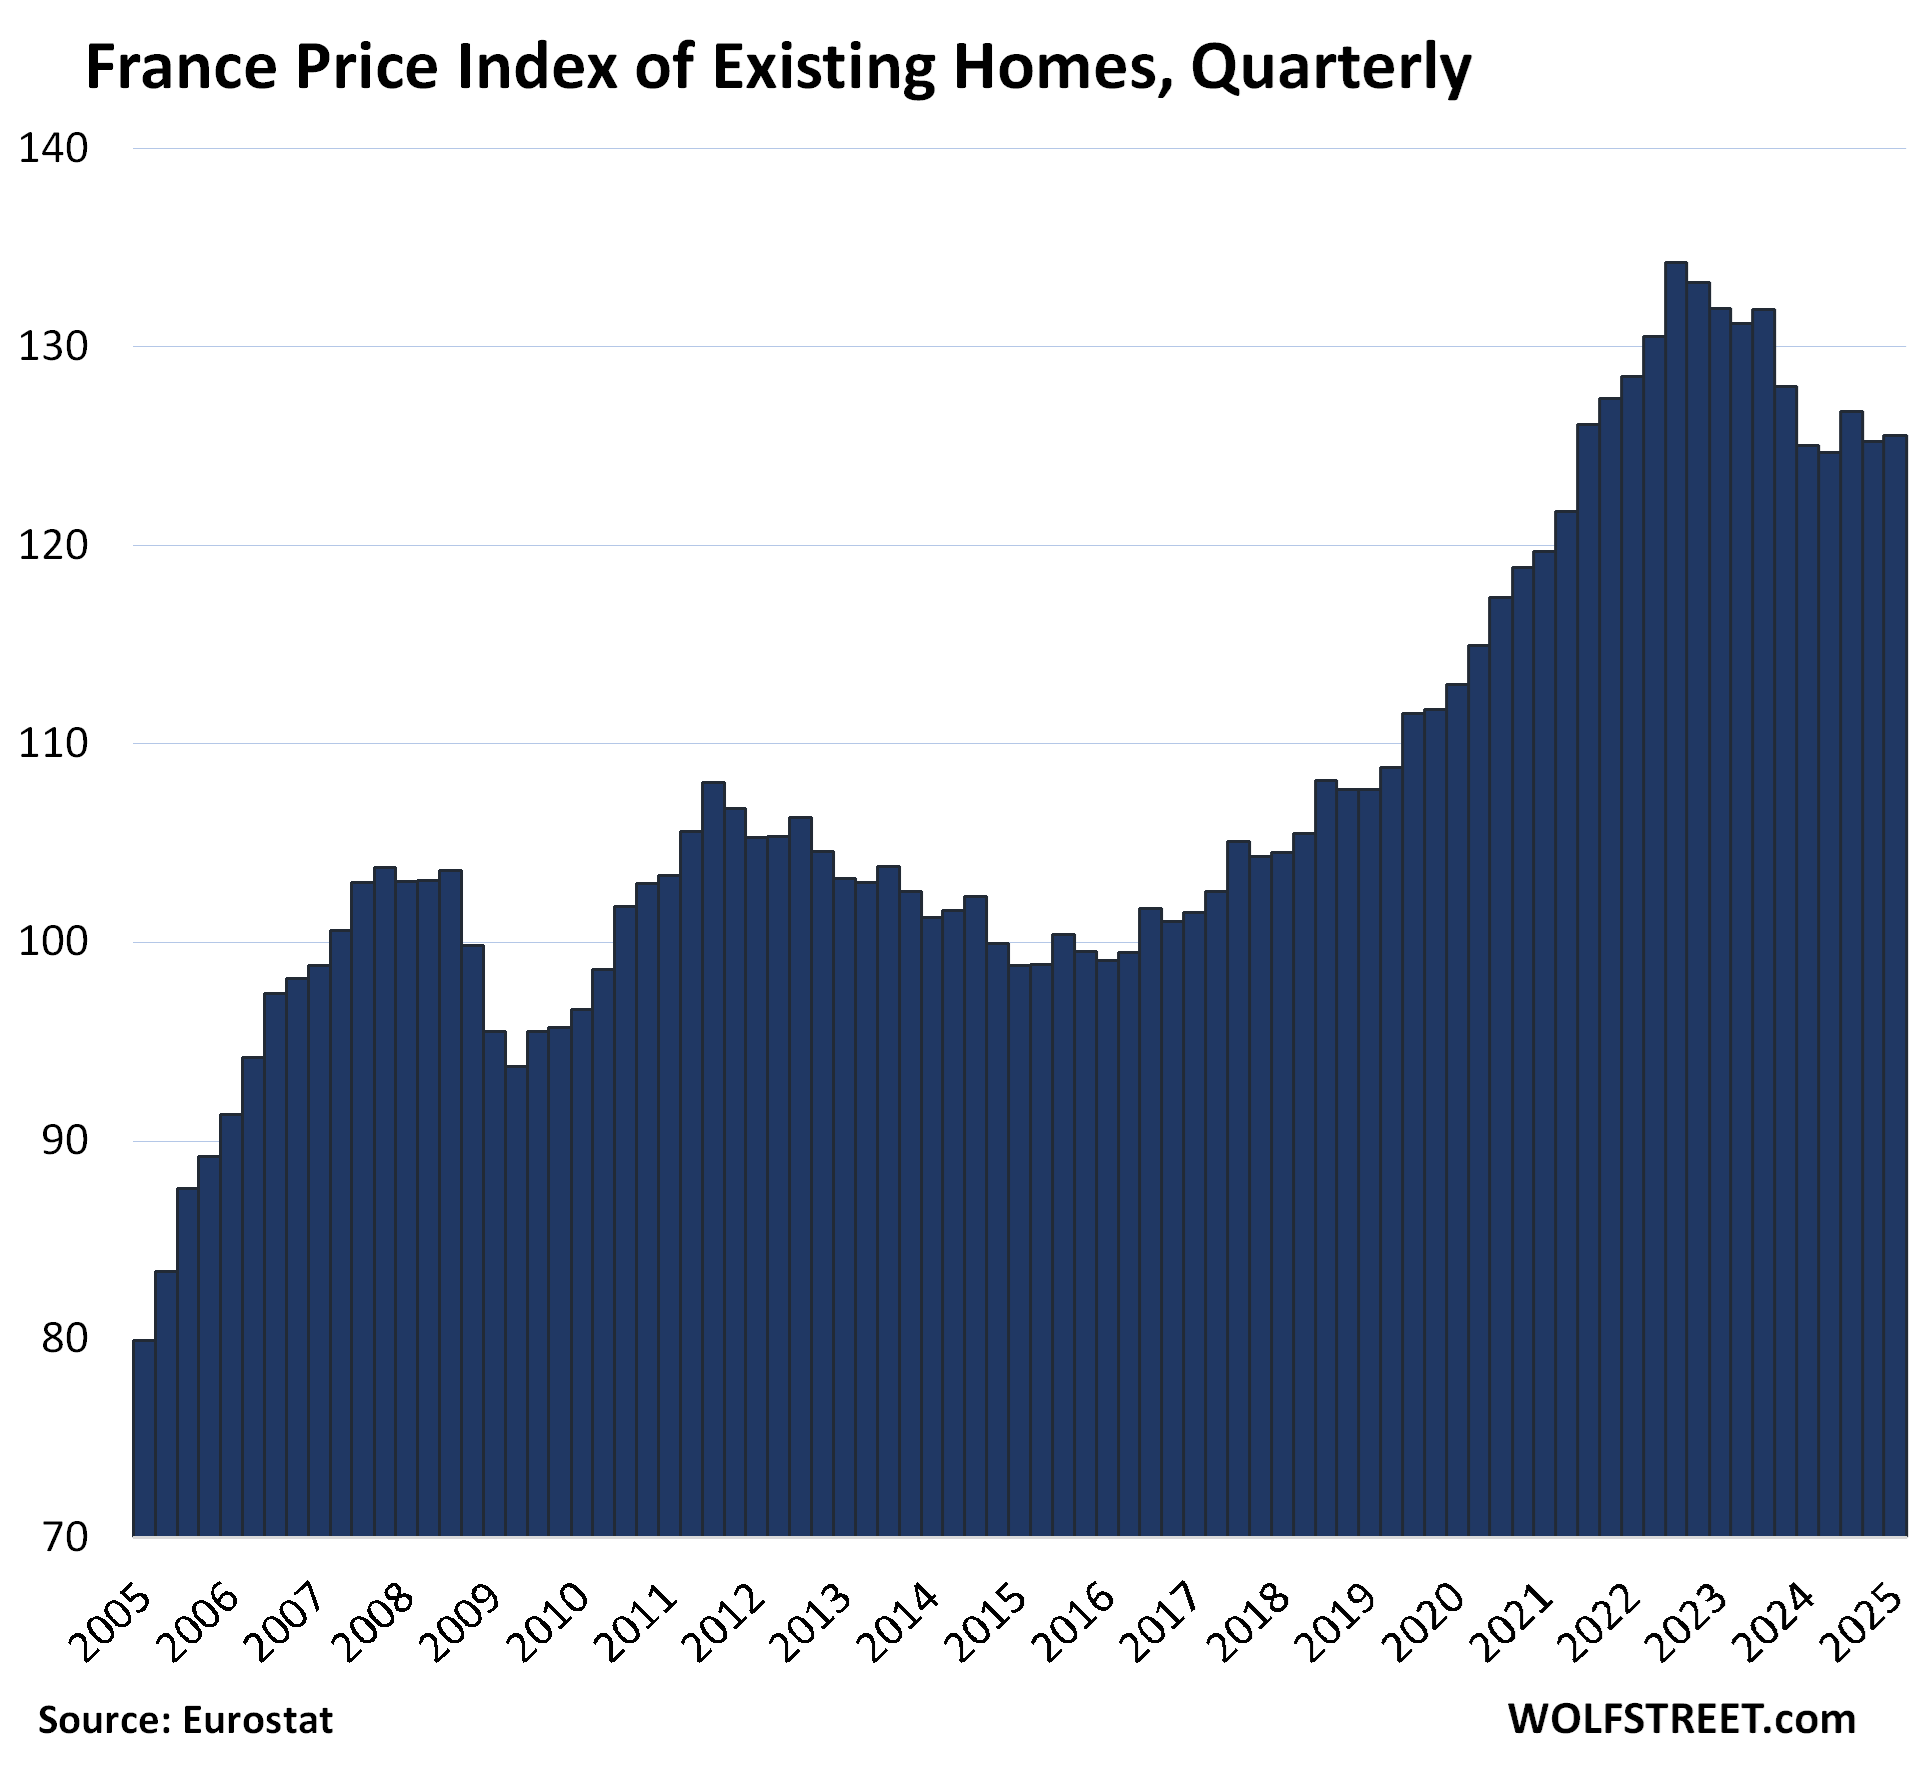
| France, Prices of Existing Homes | |||
| 2010 to Peak | QoQ | YoY | From peak |
| 39.0% | 0.3% | 0.4% | -6.5% |

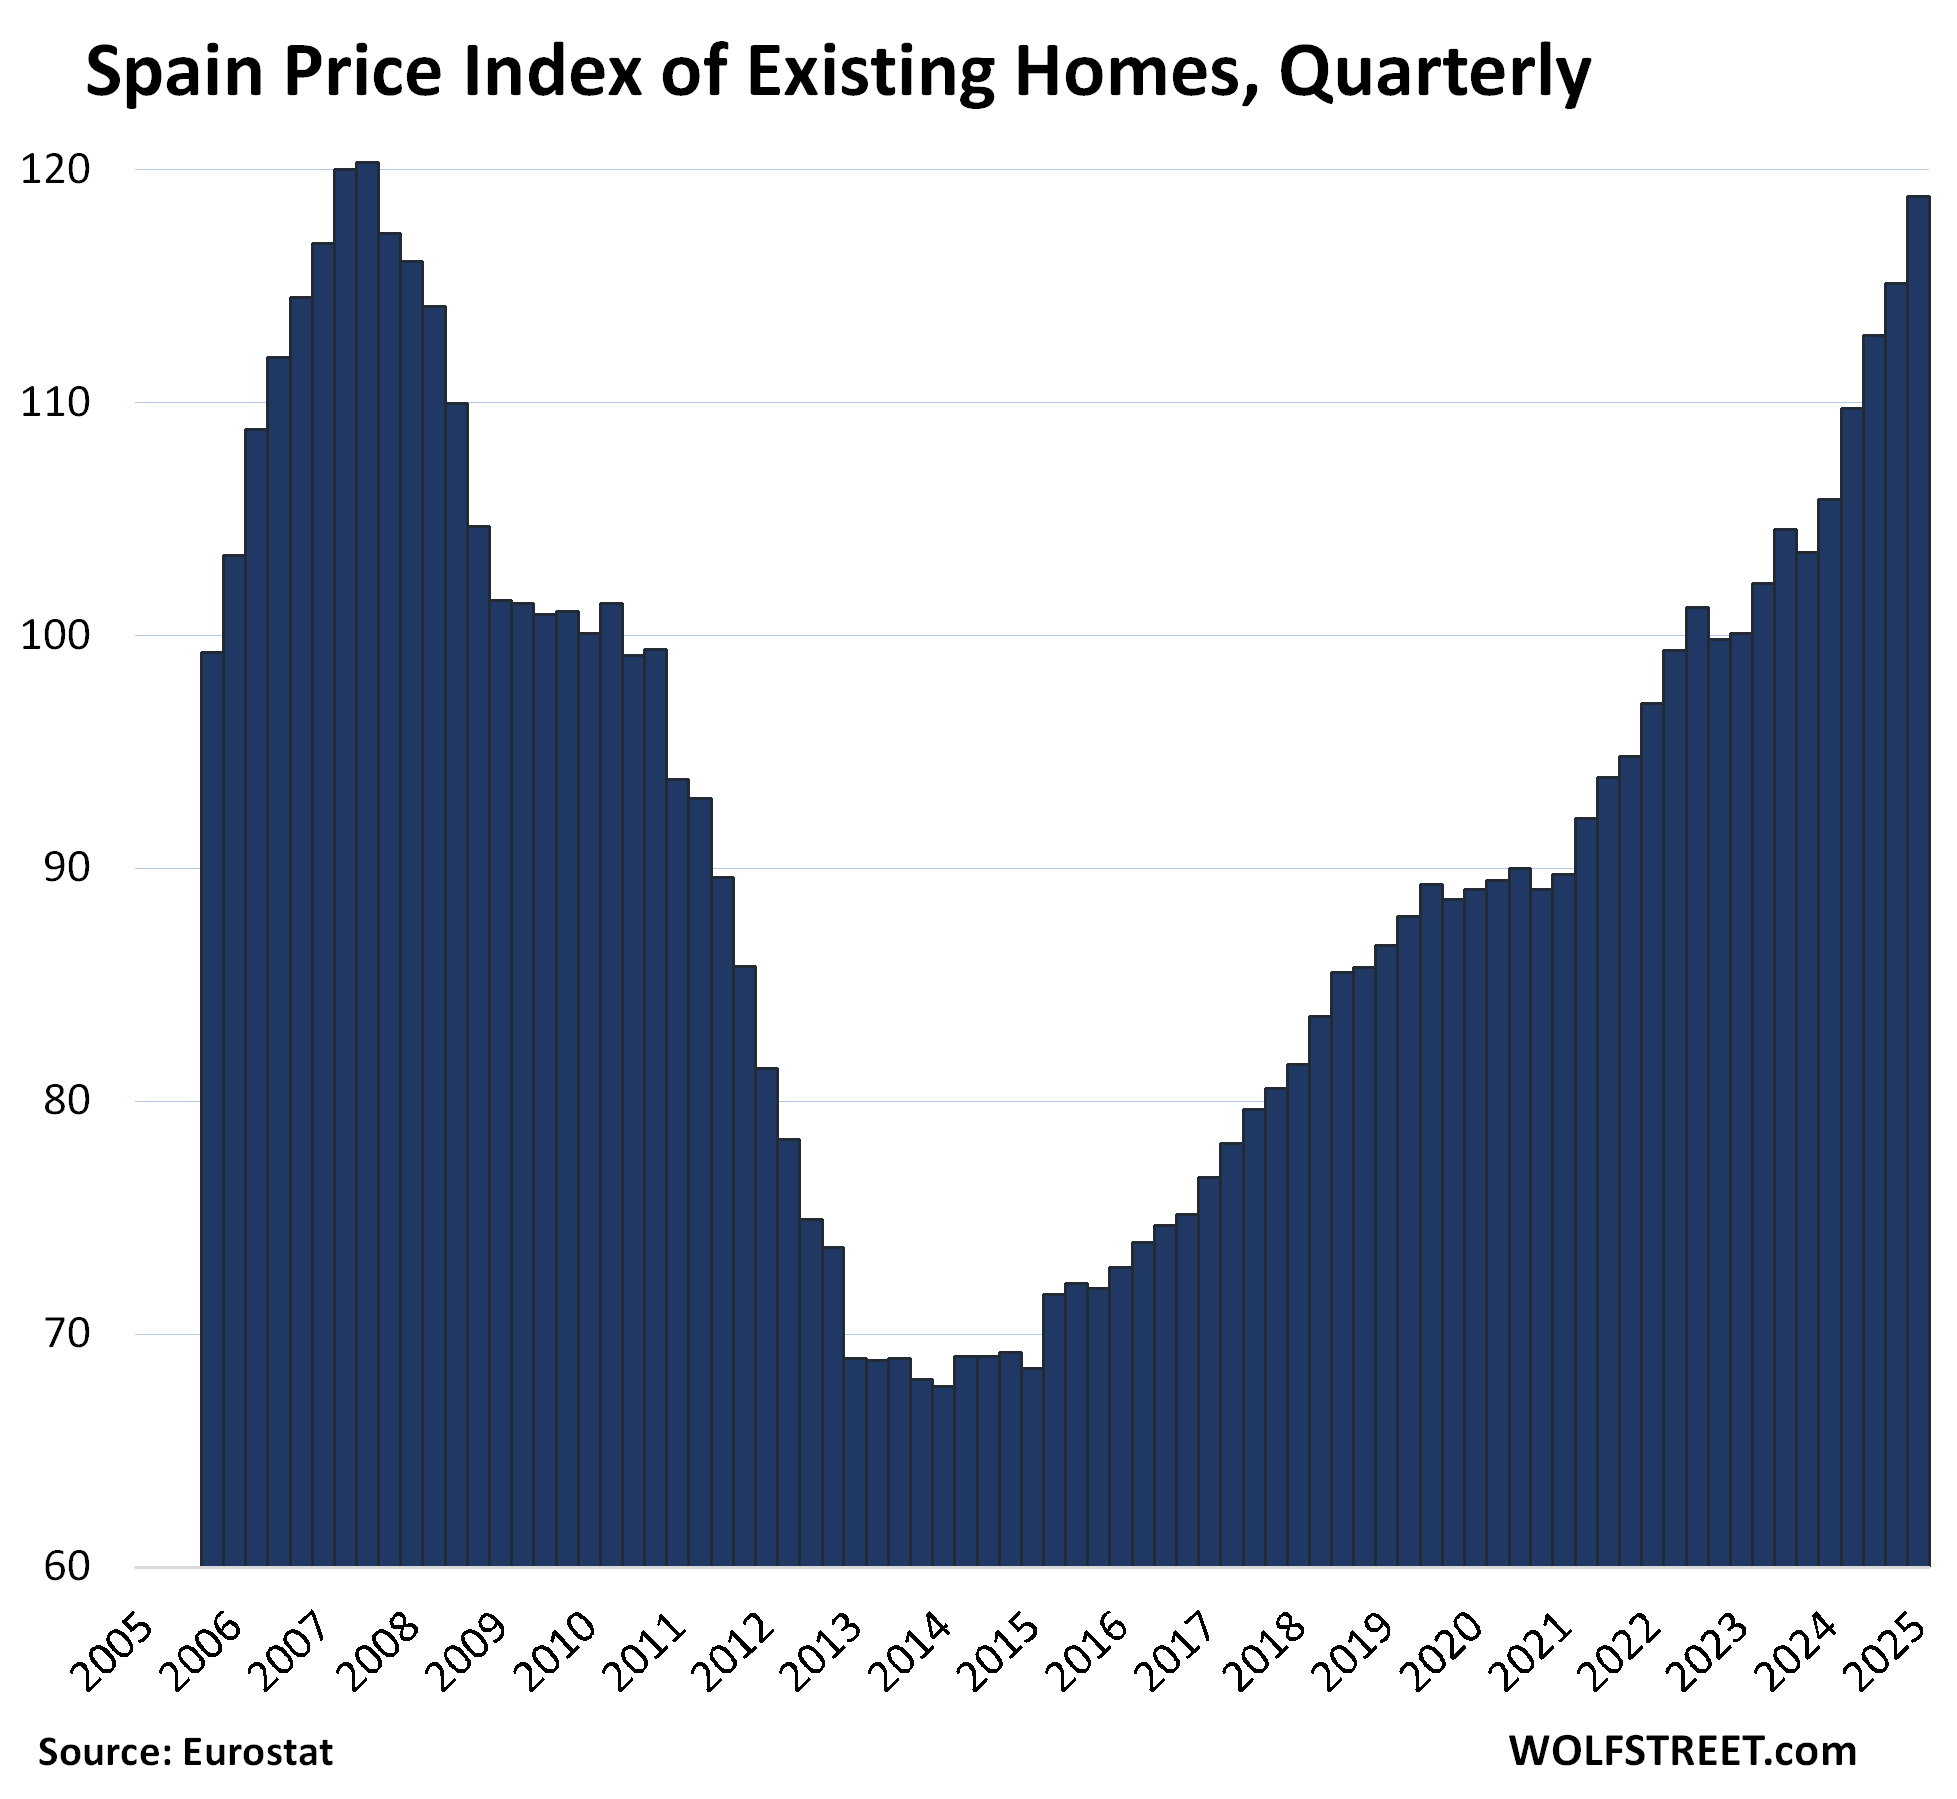
| Spain, Prices of Existing Homes | ||
| QoQ | YoY | From peak |
| 3.2% | 12.3% | -1.2% |
Home prices are almost back to the peak 18 years ago.

Of the 16 markets, the other 9 have made new highs:
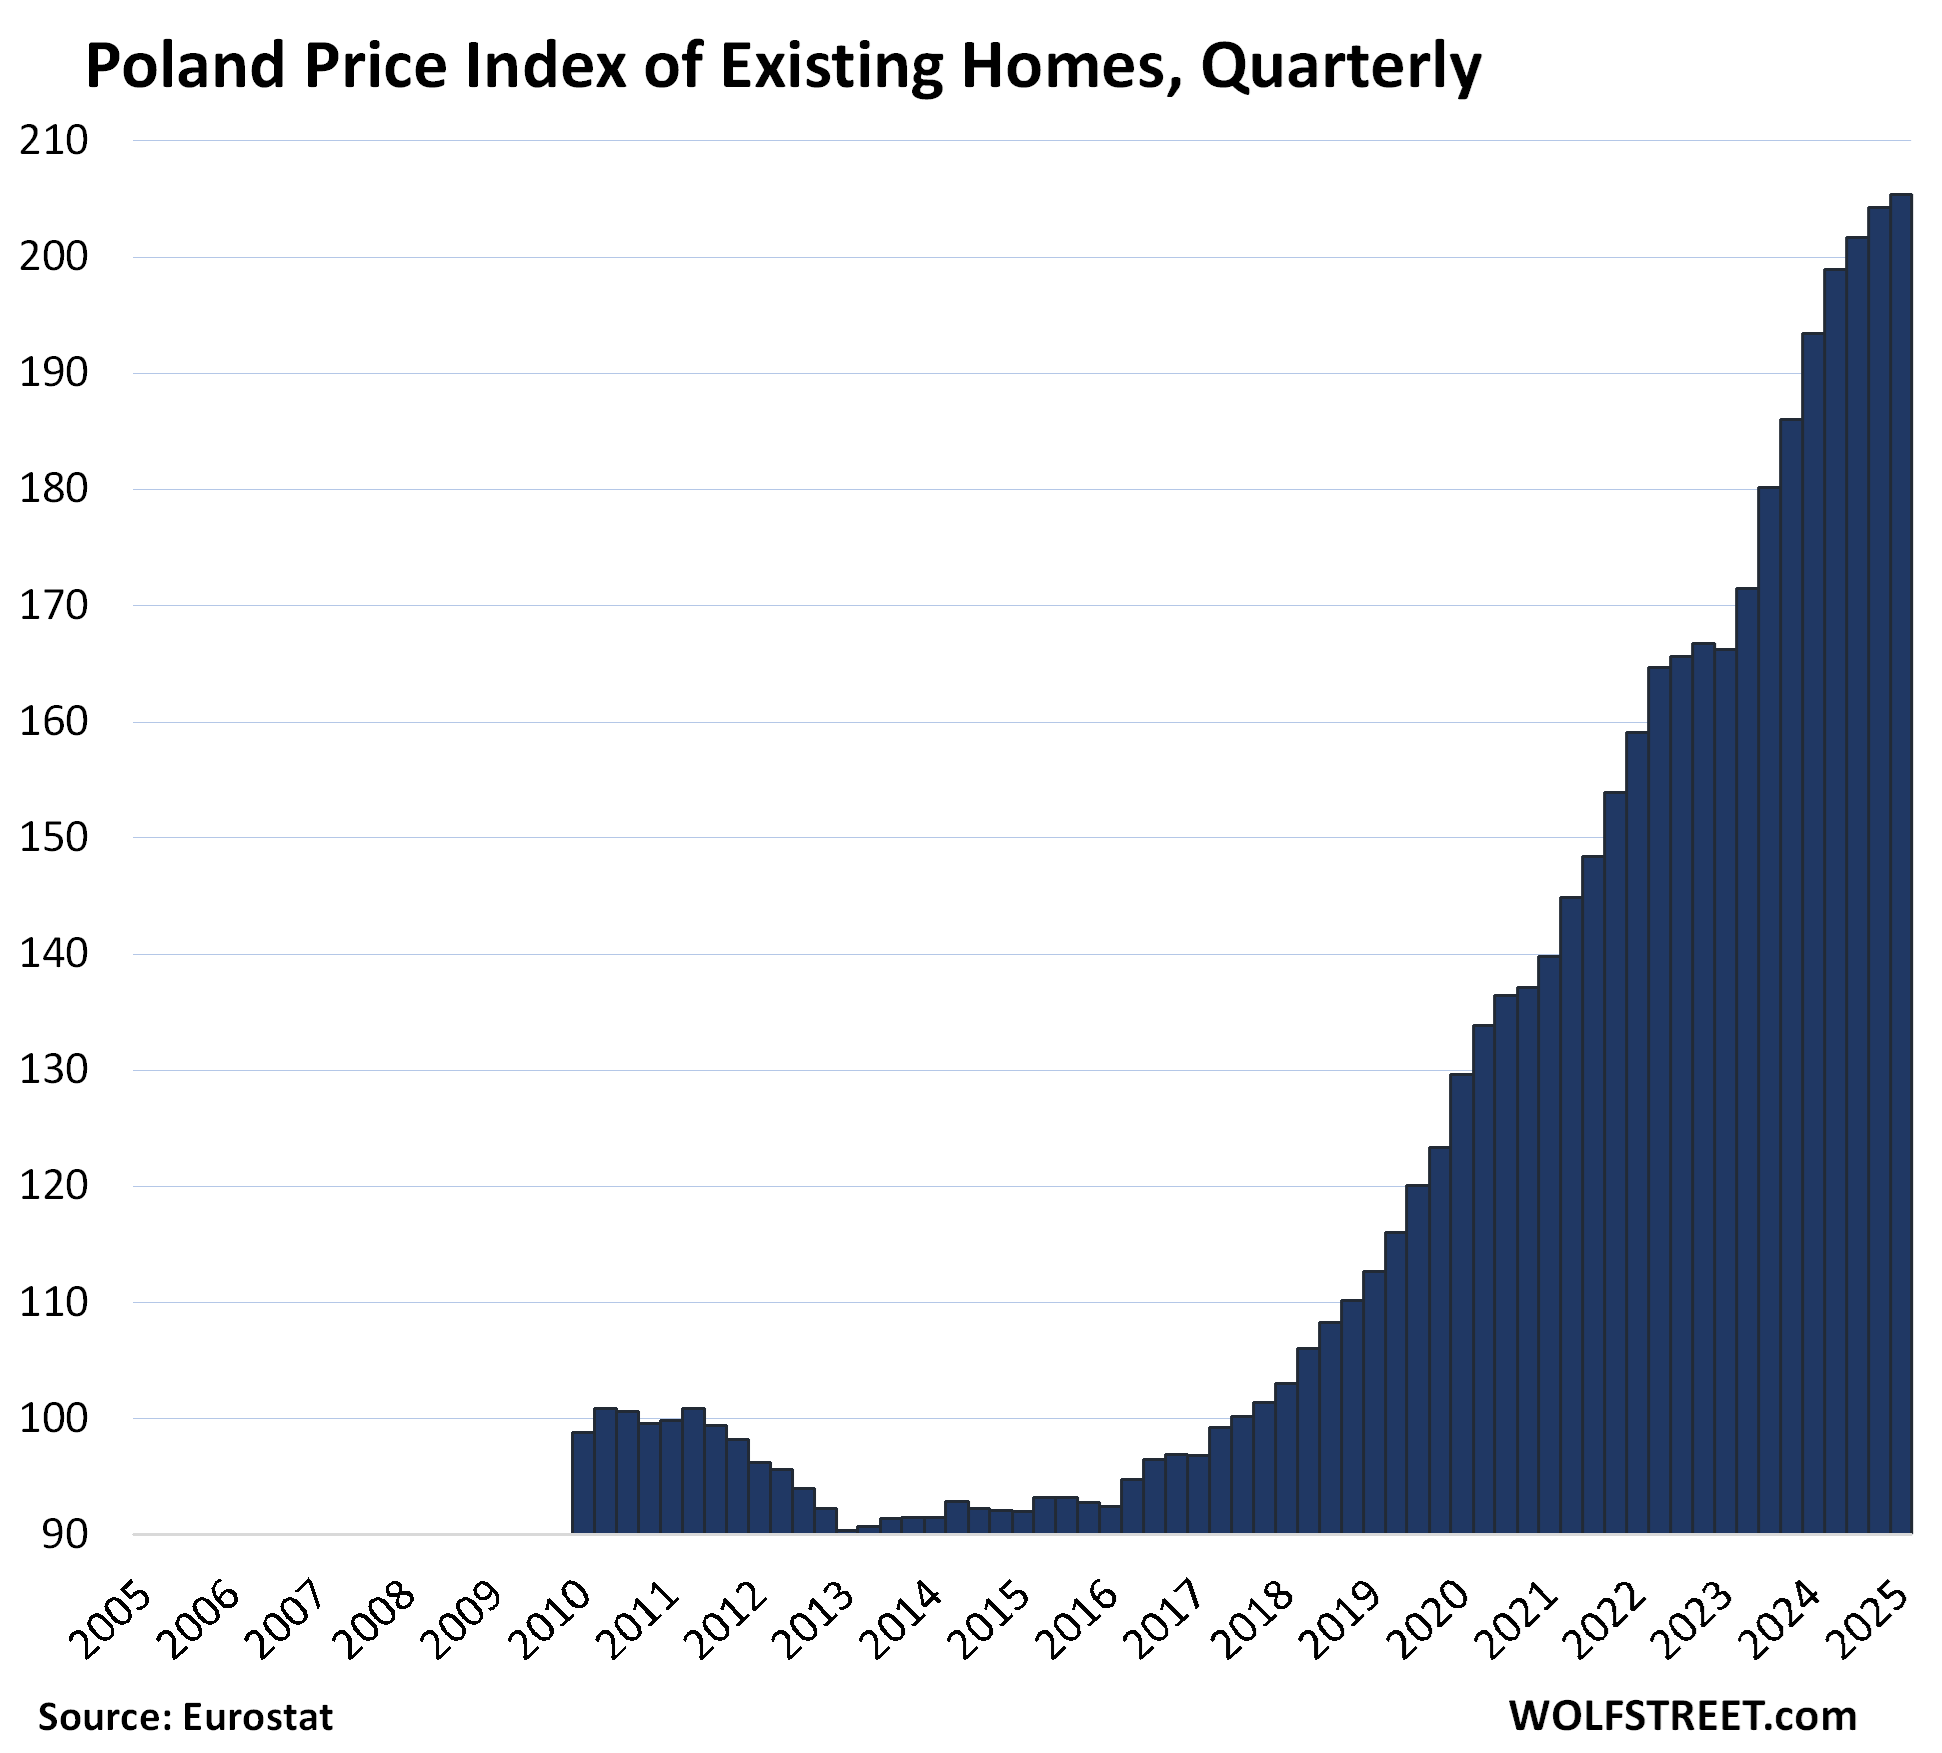
| Poland, Prices of Existing Homes | |||
| 2010 to Peak | QoQ | YoY | |
| 107.8% | 0.5% | 6.2% | New high |
The Eurostat data for Poland begins in 2010:

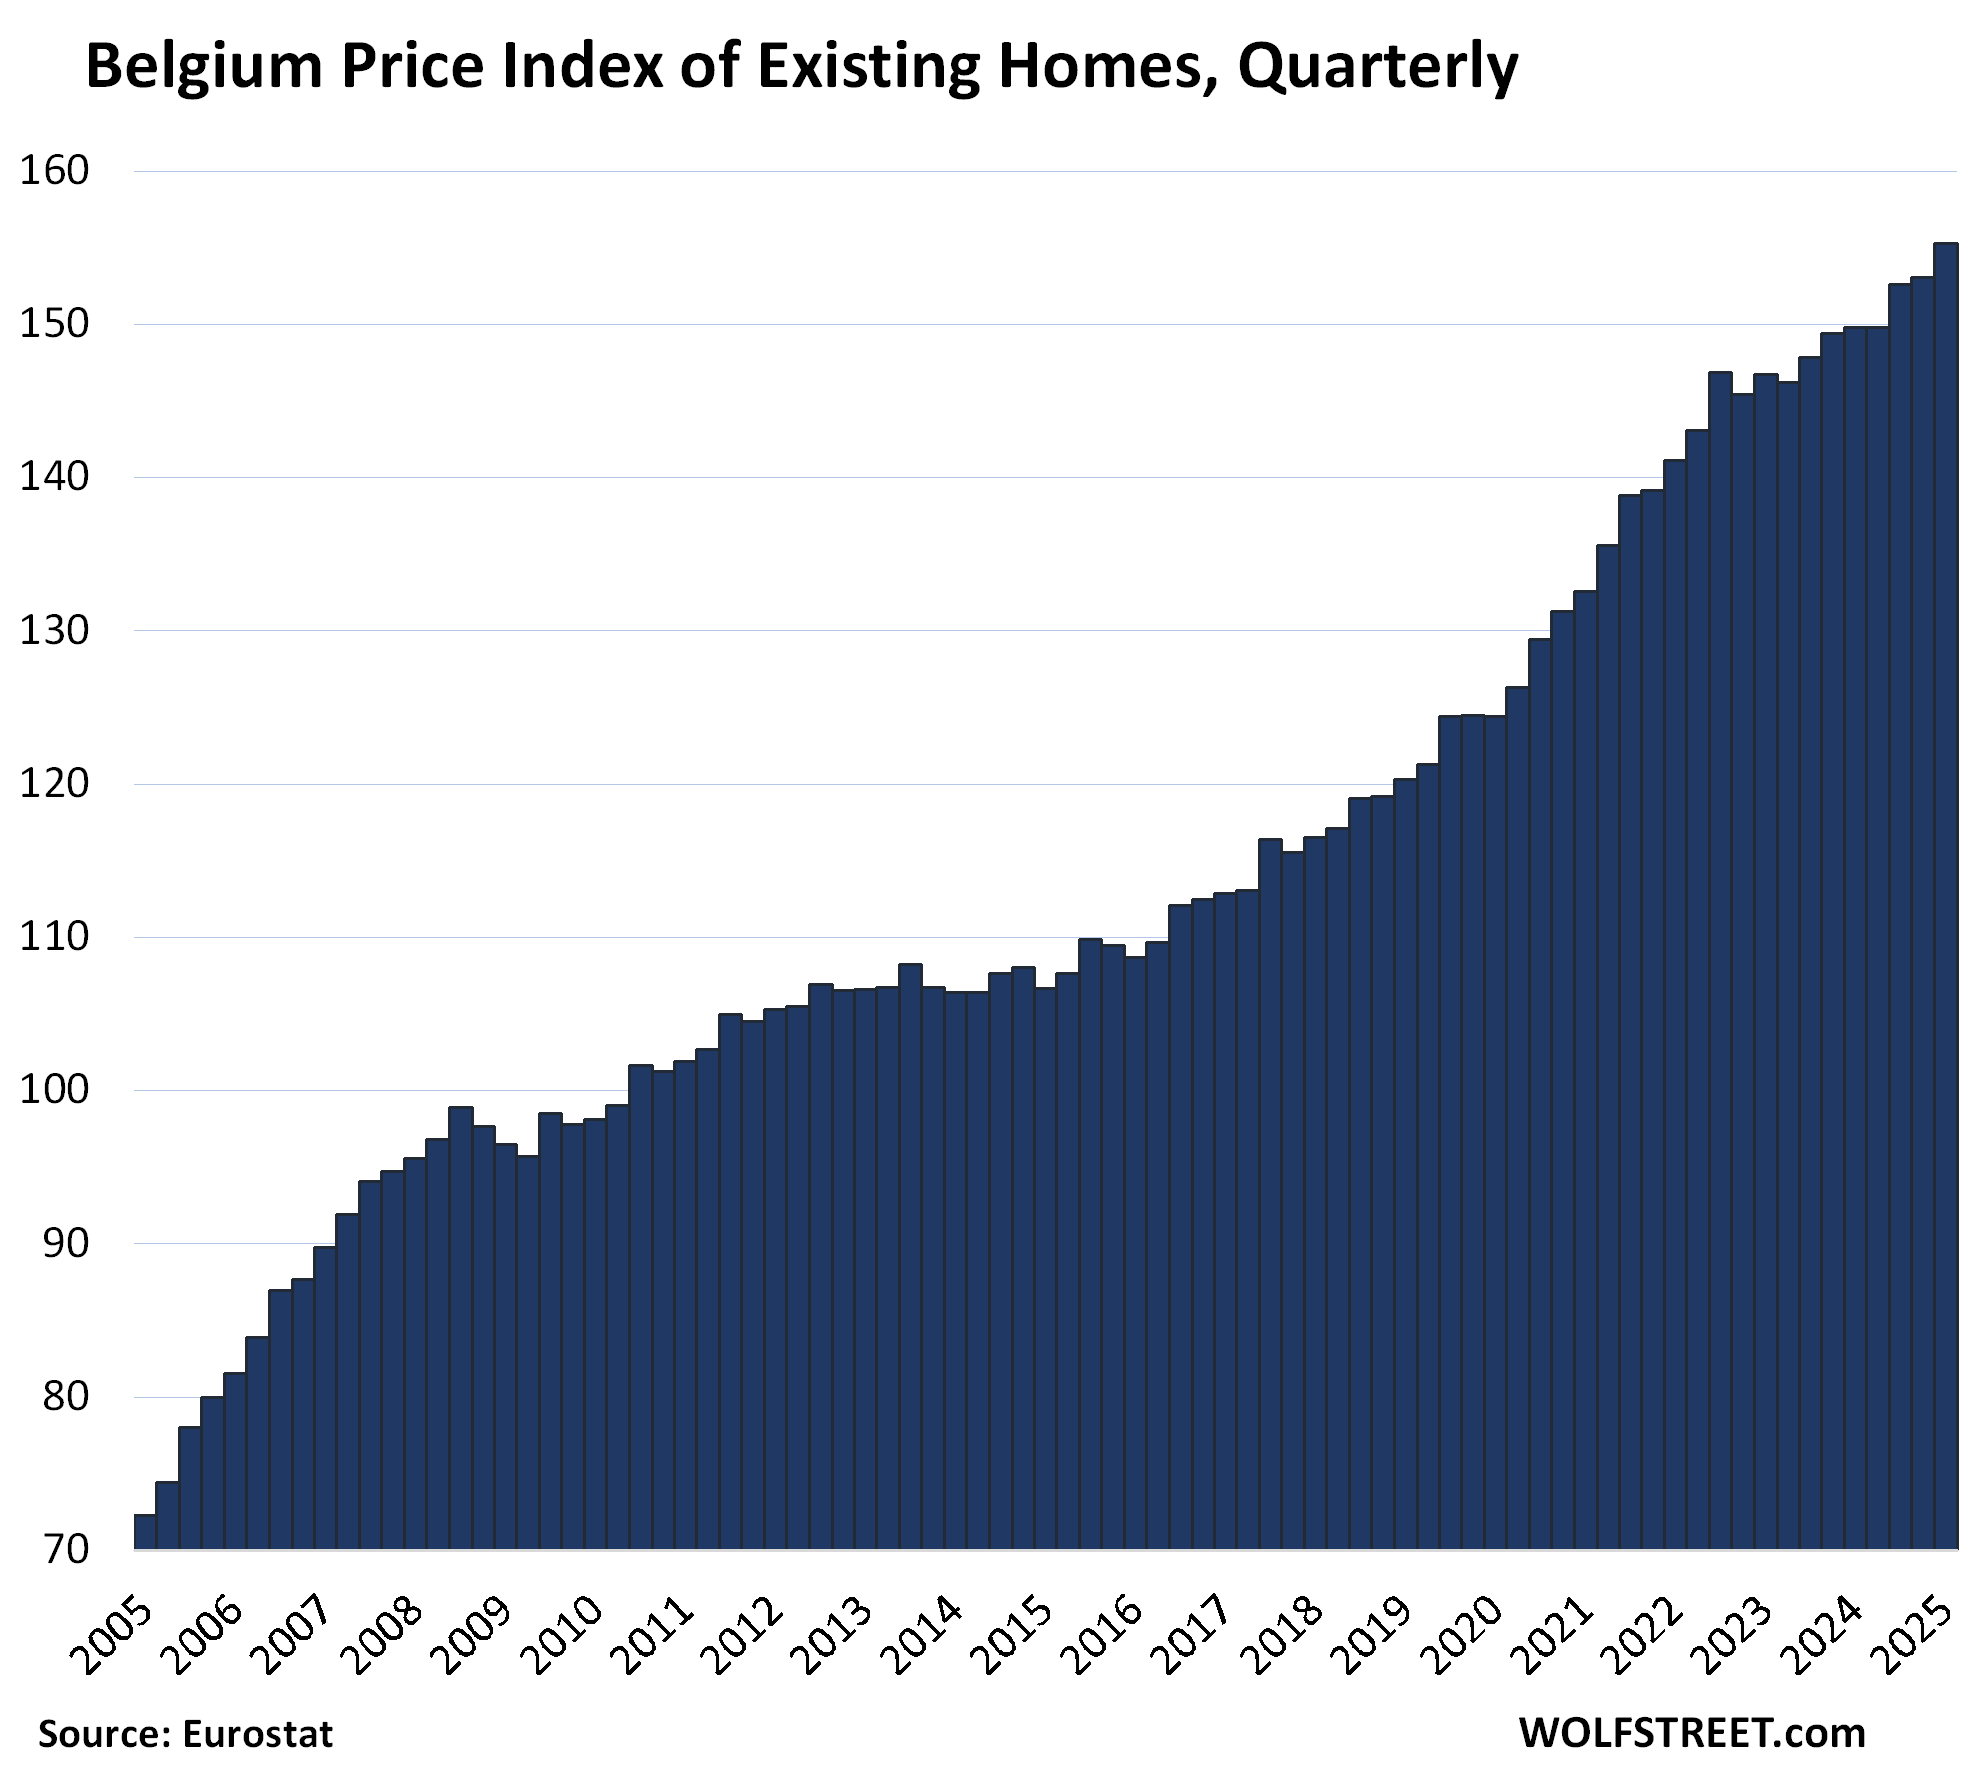
| Belgium, Prices of Existing Homes | |||
| 2010 to Peak | QoQ | YoY | |
| 58.2% | 1.4% | 3.6% | New high |

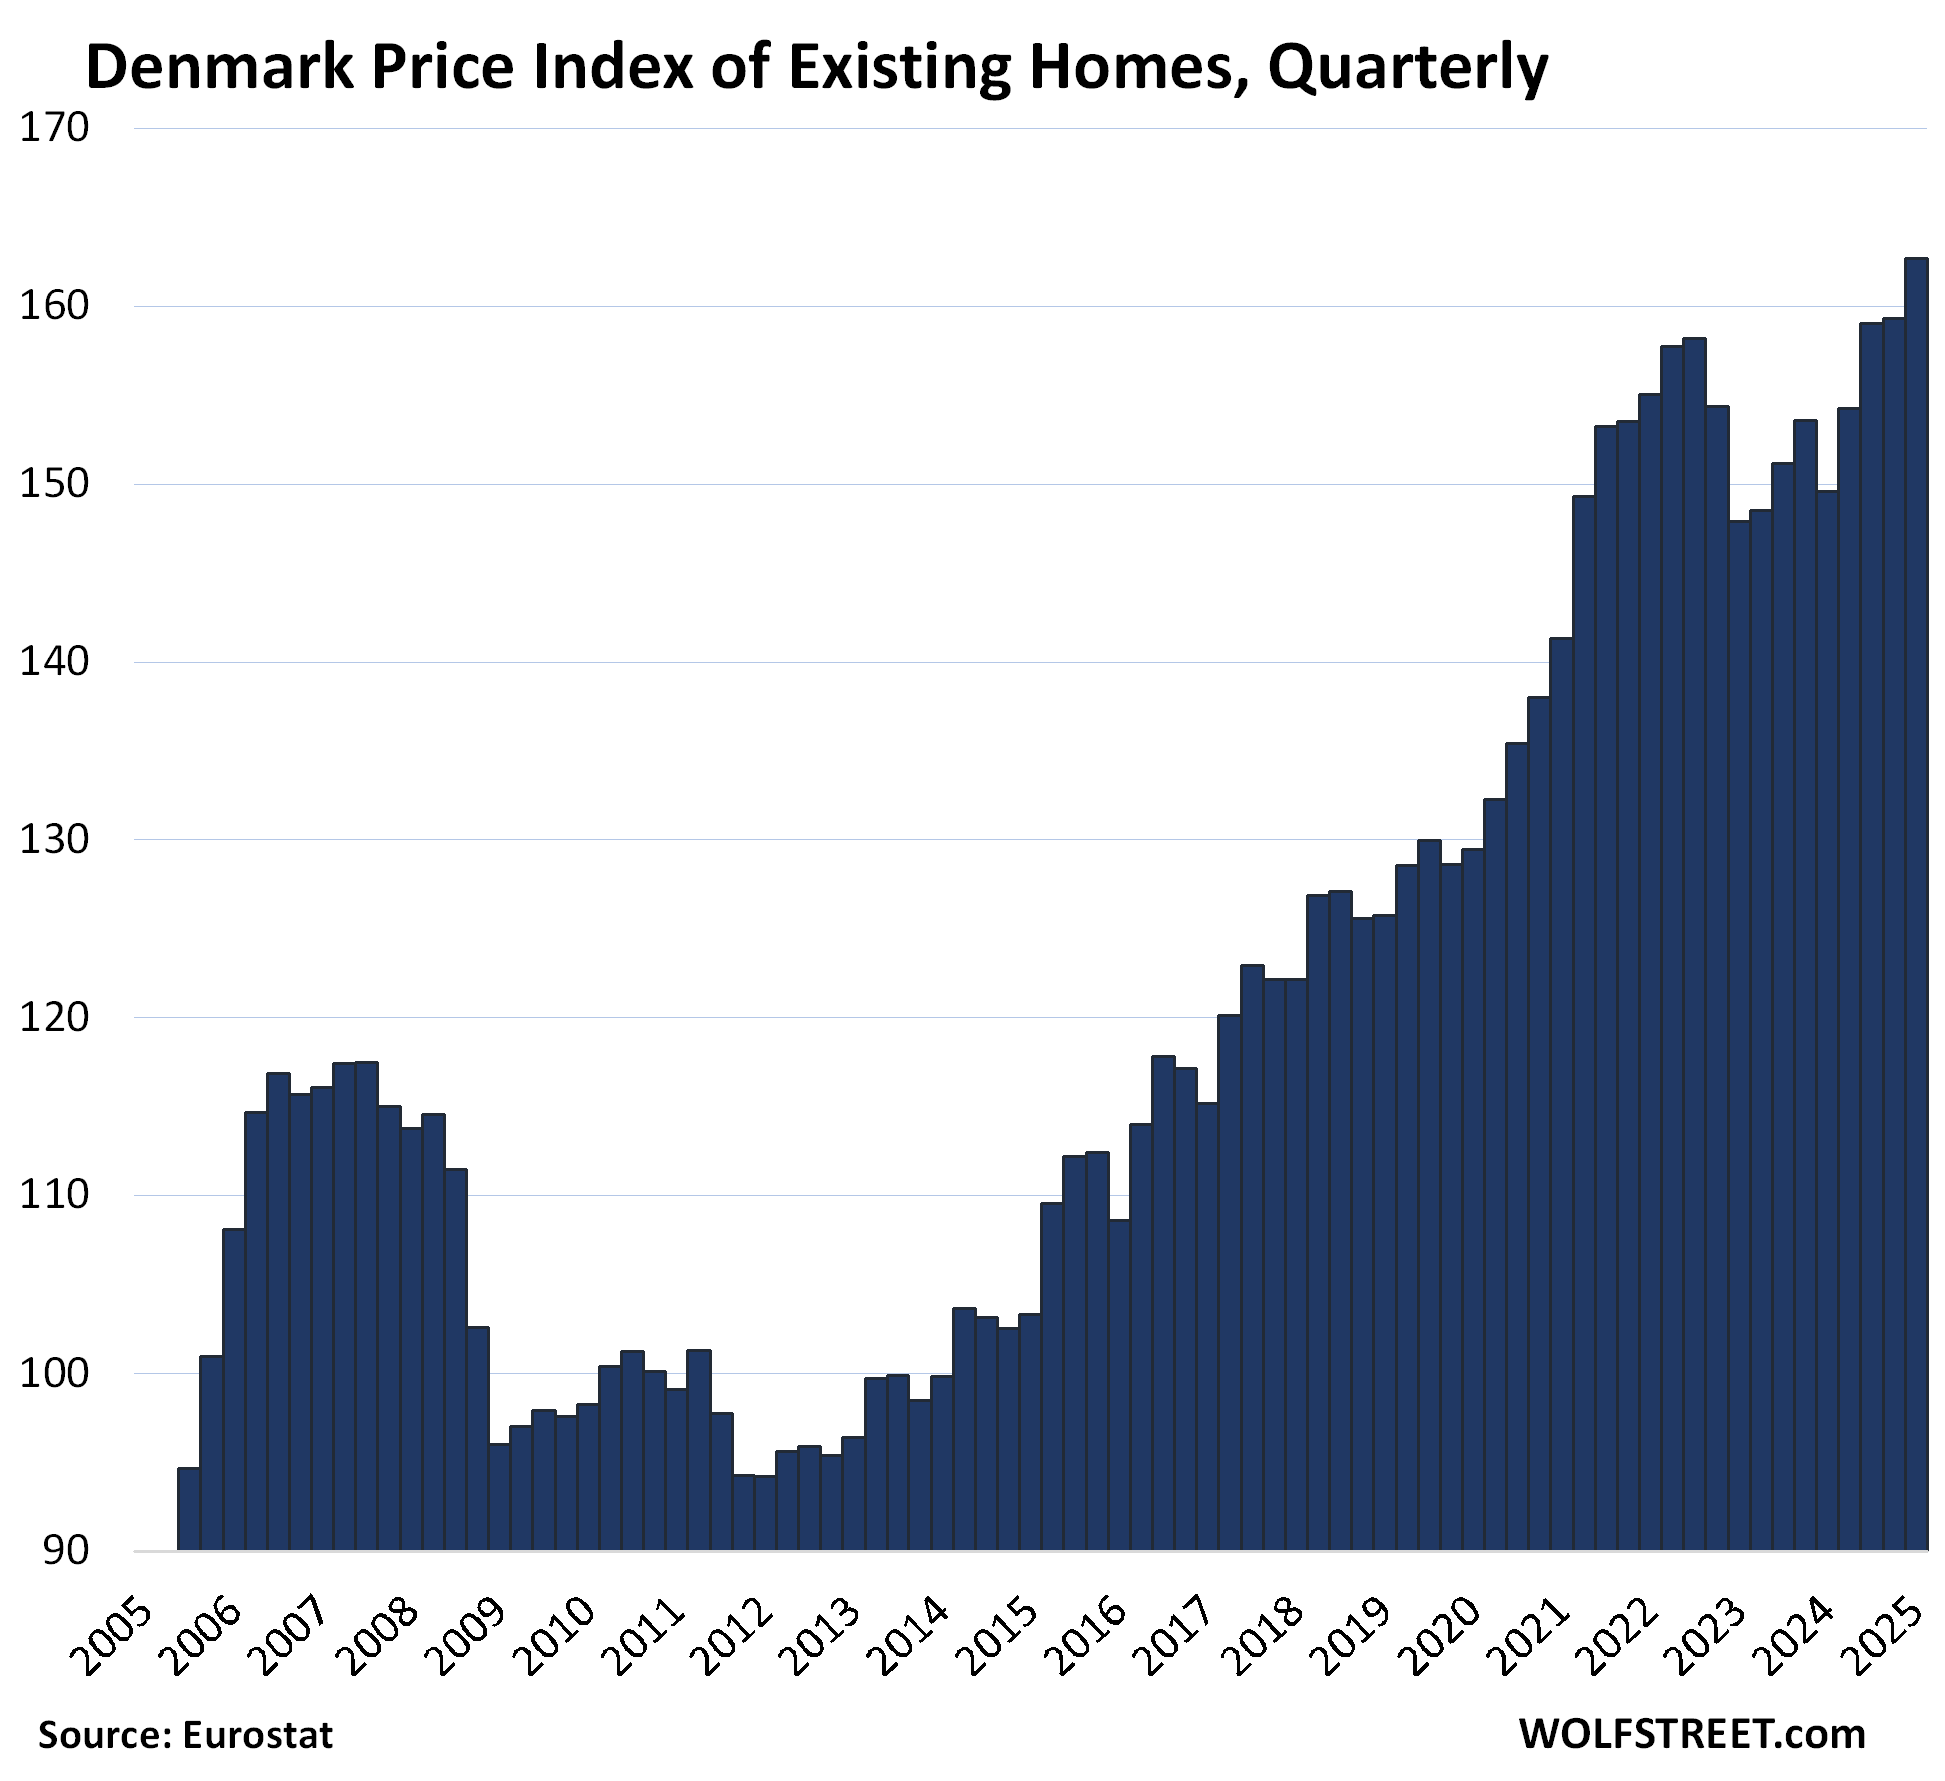
| Denmark, Prices of Existing Homes | |||
| 2010 to Peak | QoQ | YoY | |
| 65.5% | 2.1% | 8.8% | New High |

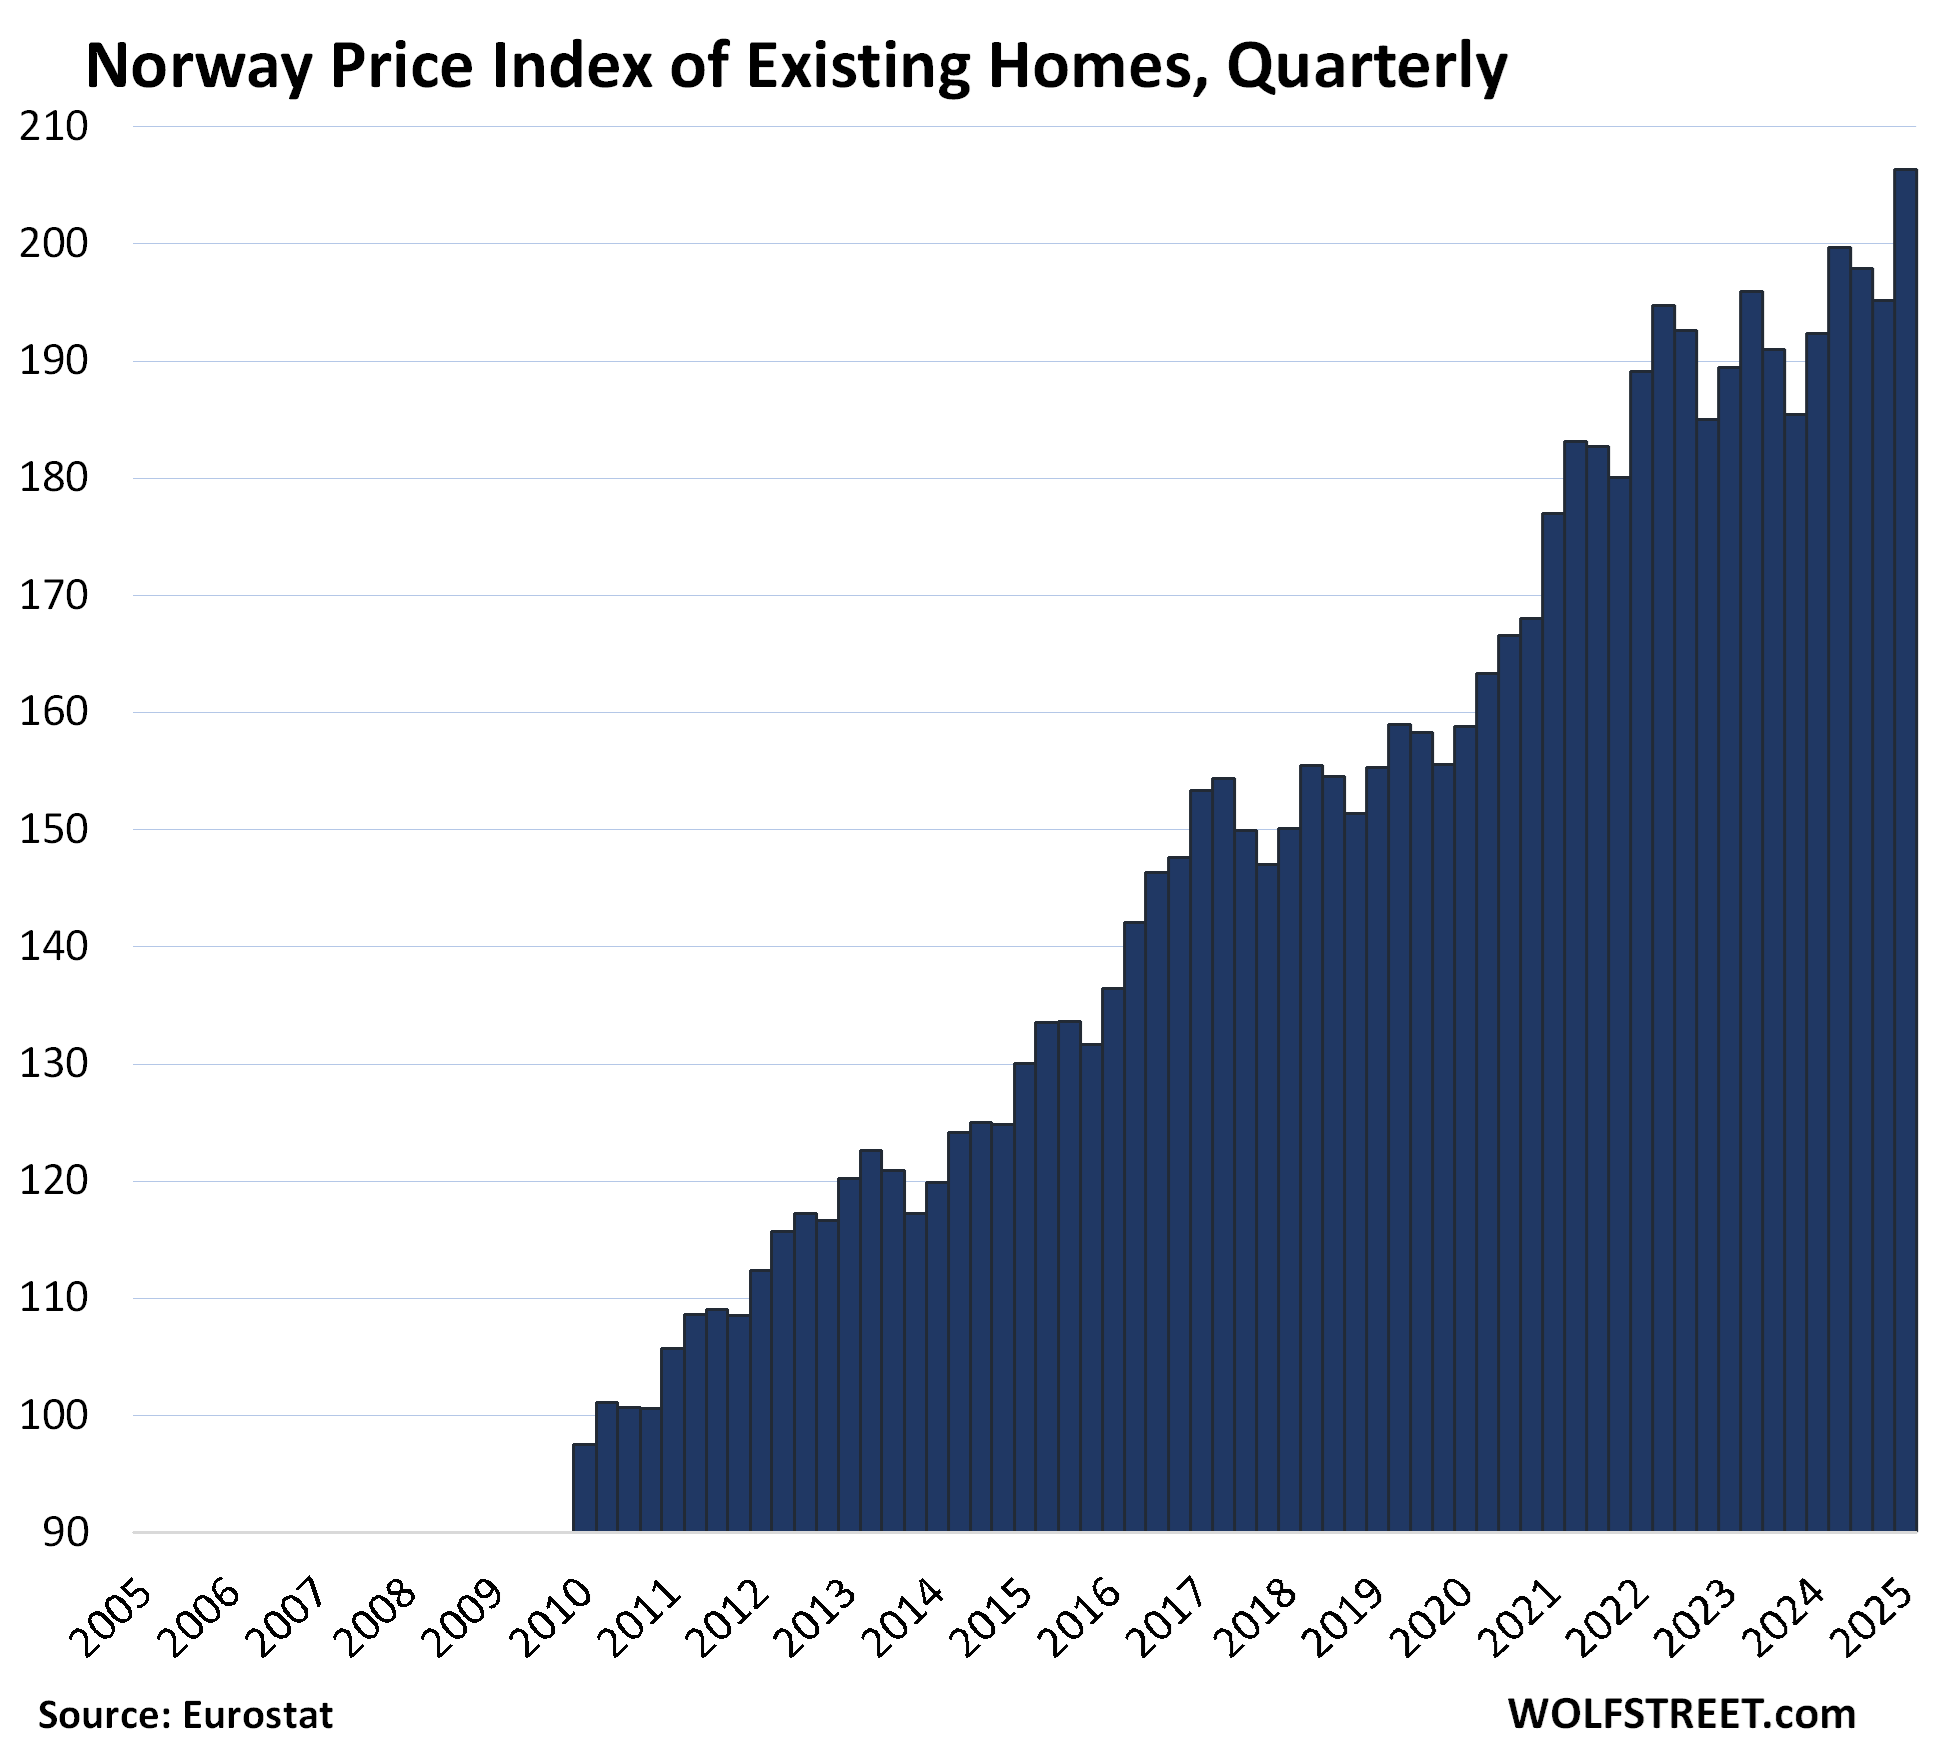
| Norway, Prices of Existing Homes | |||
| 2010 to Peak | QoQ | YoY | |
| 111.5% | 5.7% | 7.3% | New High |

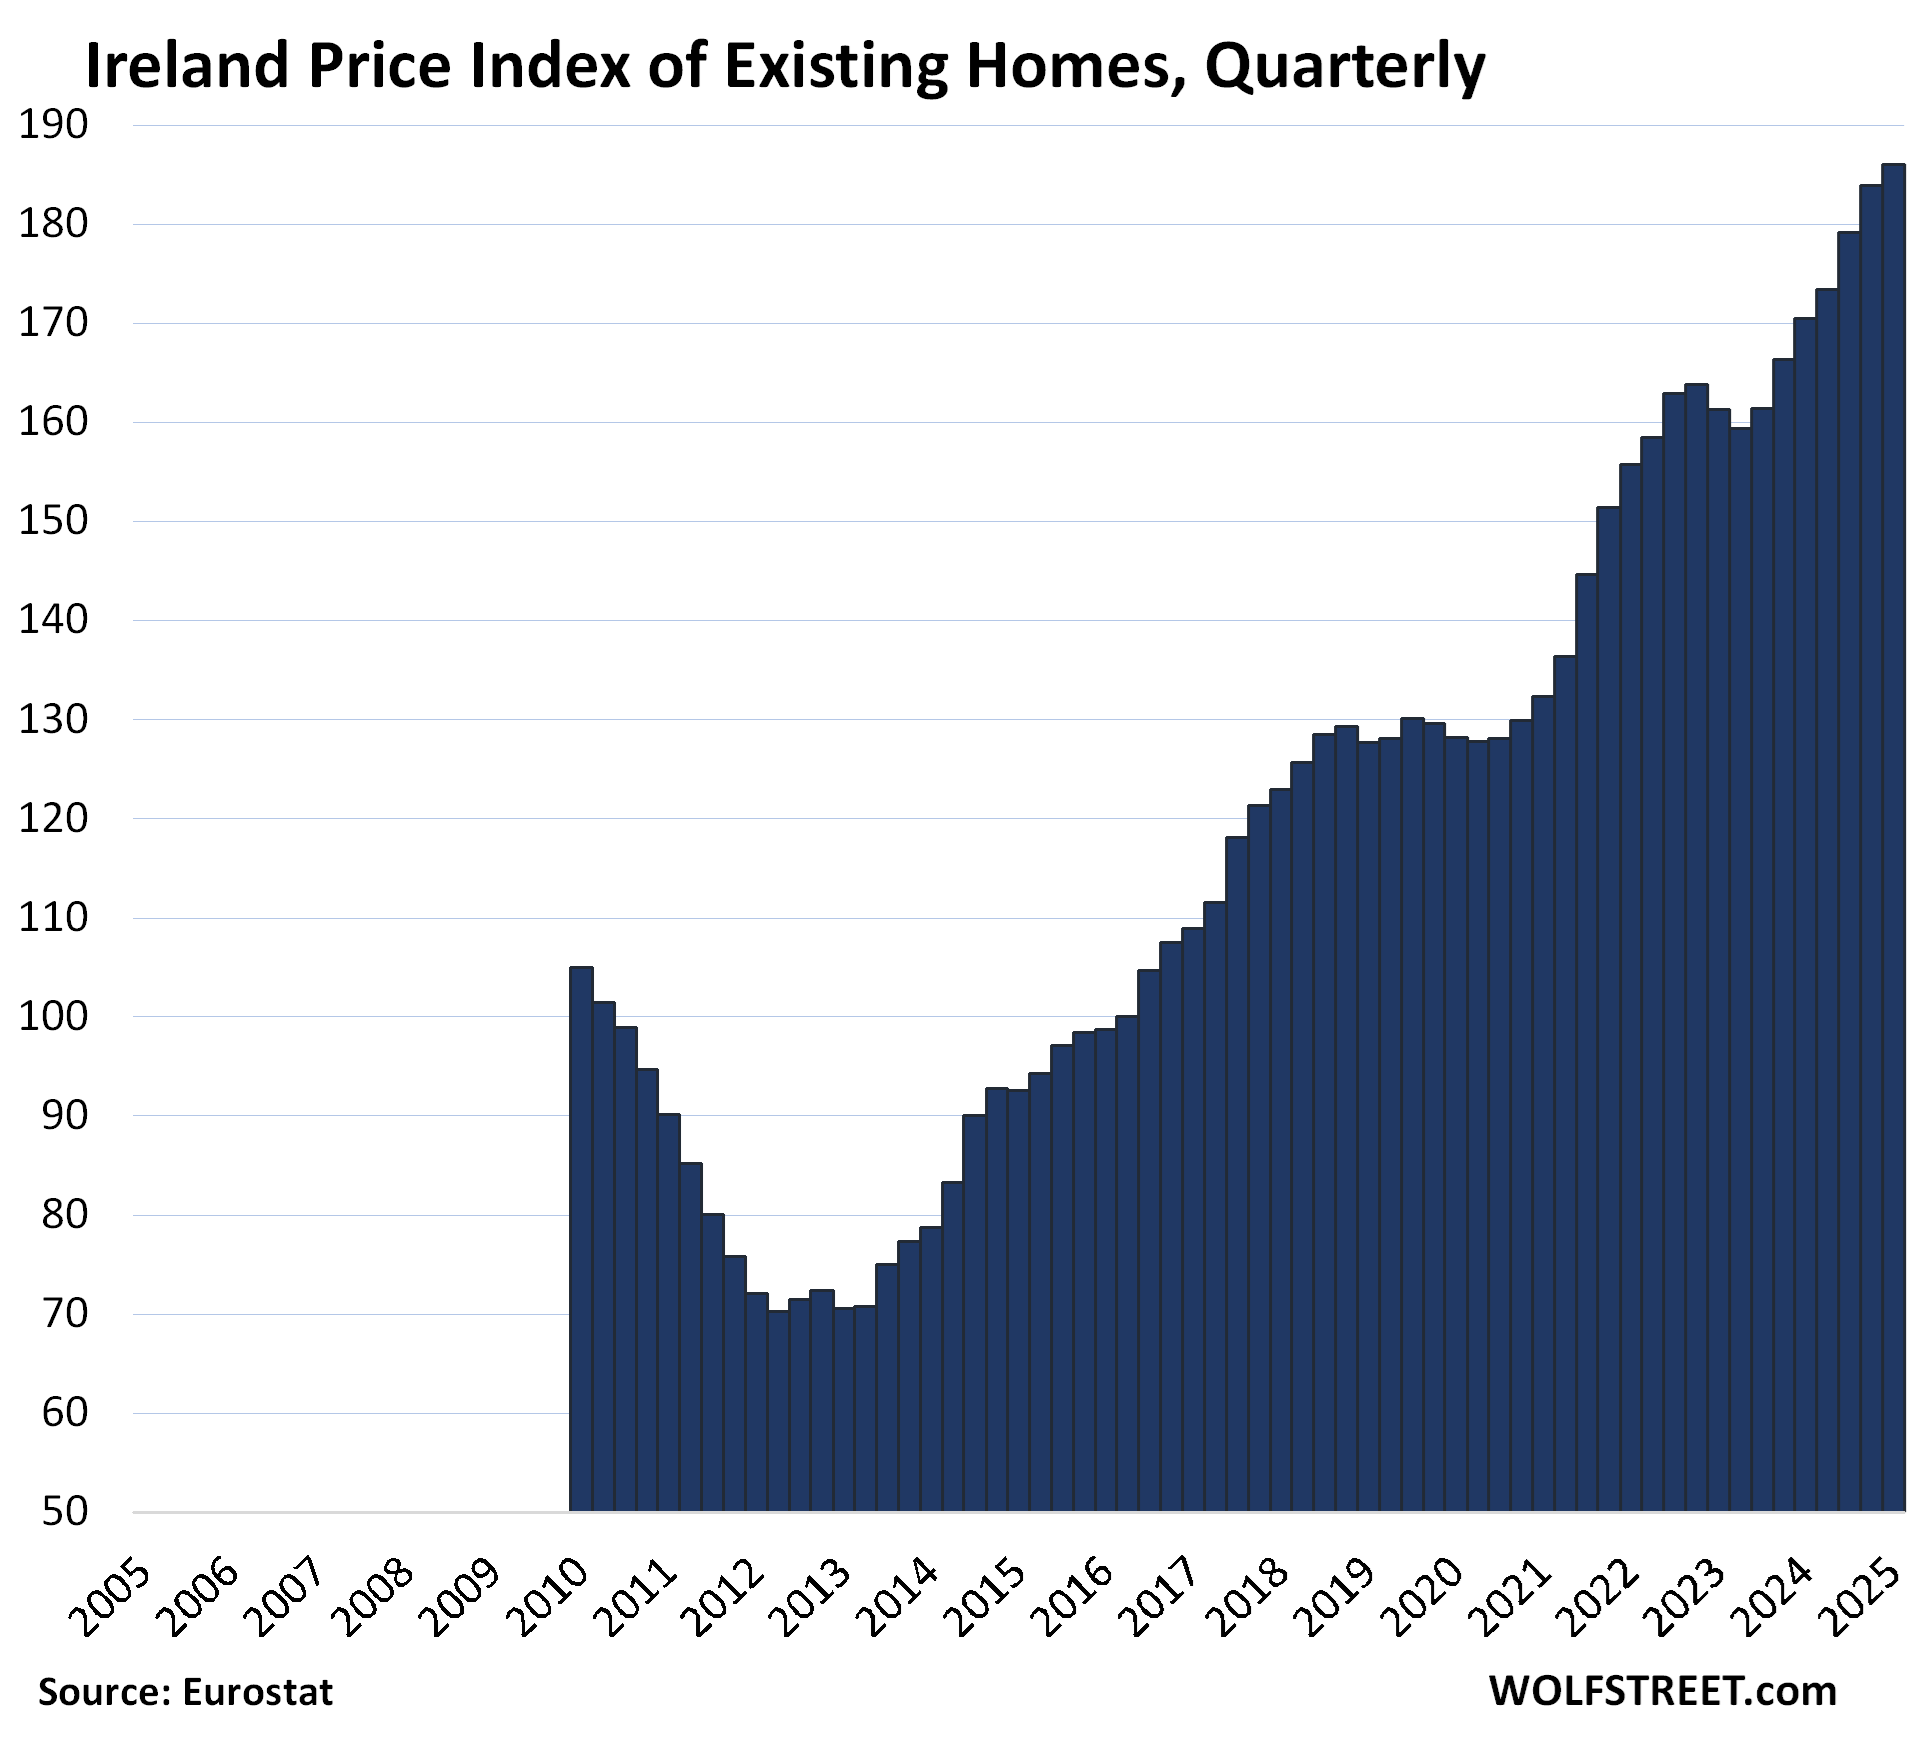
| Ireland, Prices of Existing Homes | |||
| 2010 to Peak | QoQ | YoY | |
| 77.2% | 1.1% | 9.1% | New High |
The Eurostat data only goes back to 2010, and Ireland’s troubles started earlier. But within the data, from 2010 to 2012, the index plunged by 33%.

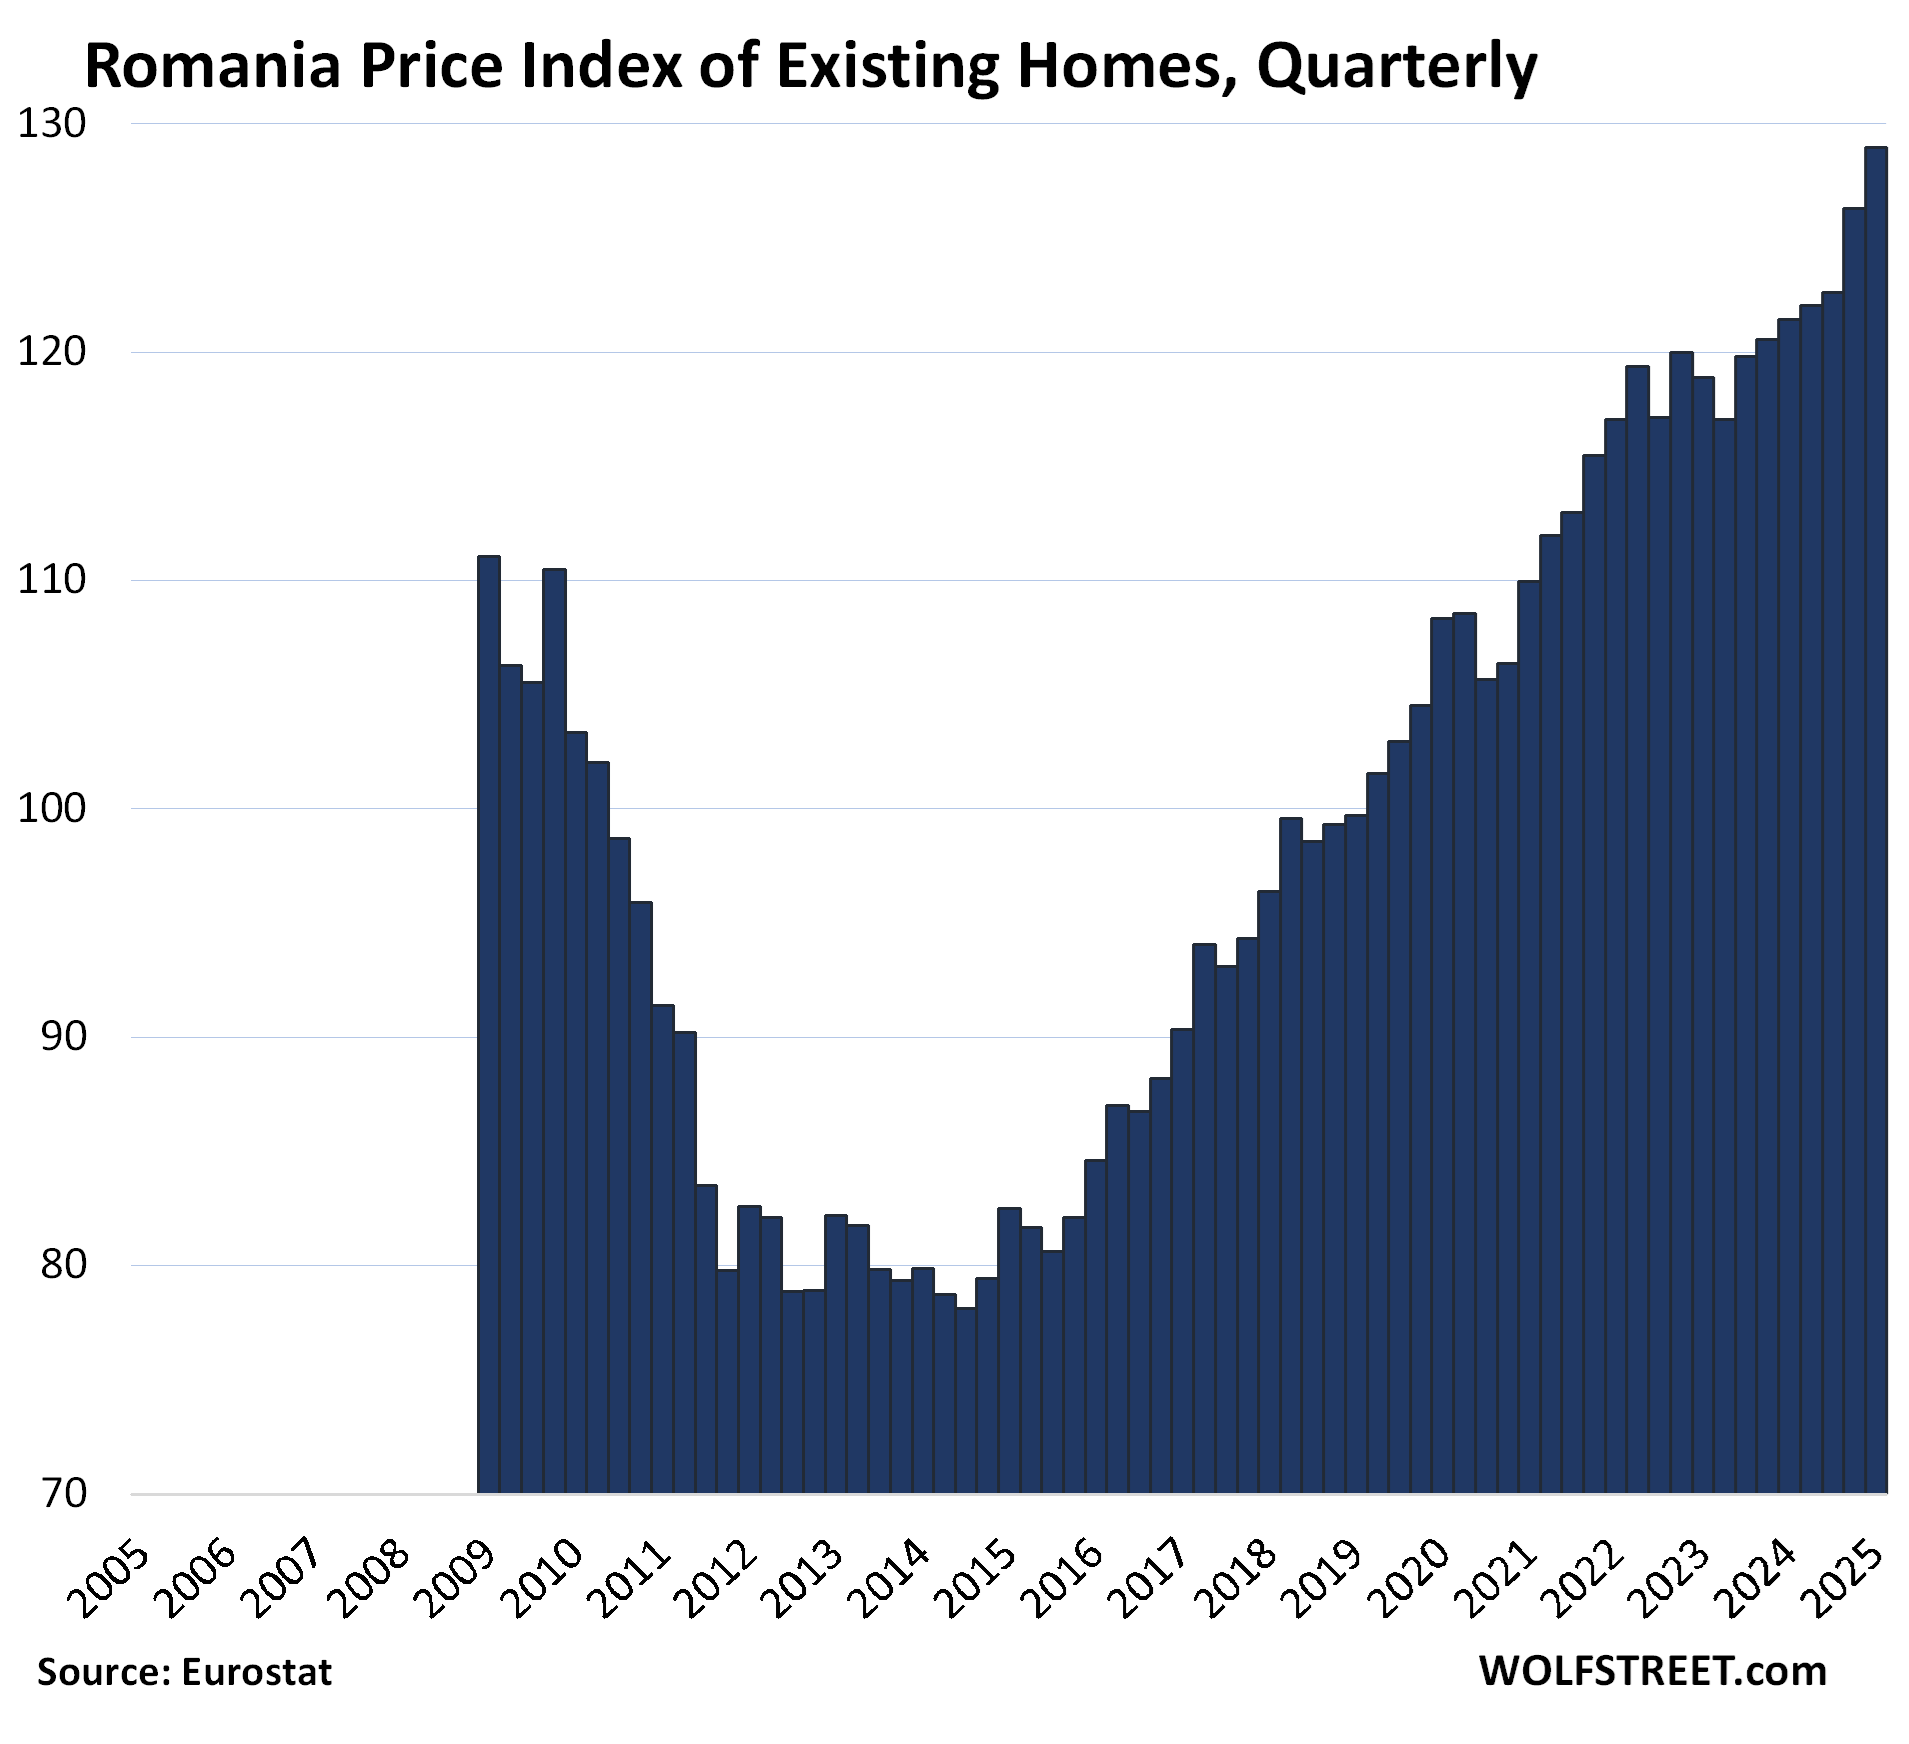
| Romania, Prices of Existing Homes | |||
| 2010 to Peak | QoQ | YoY | |
| 24.8% | 2.1% | 6.2% | New high |

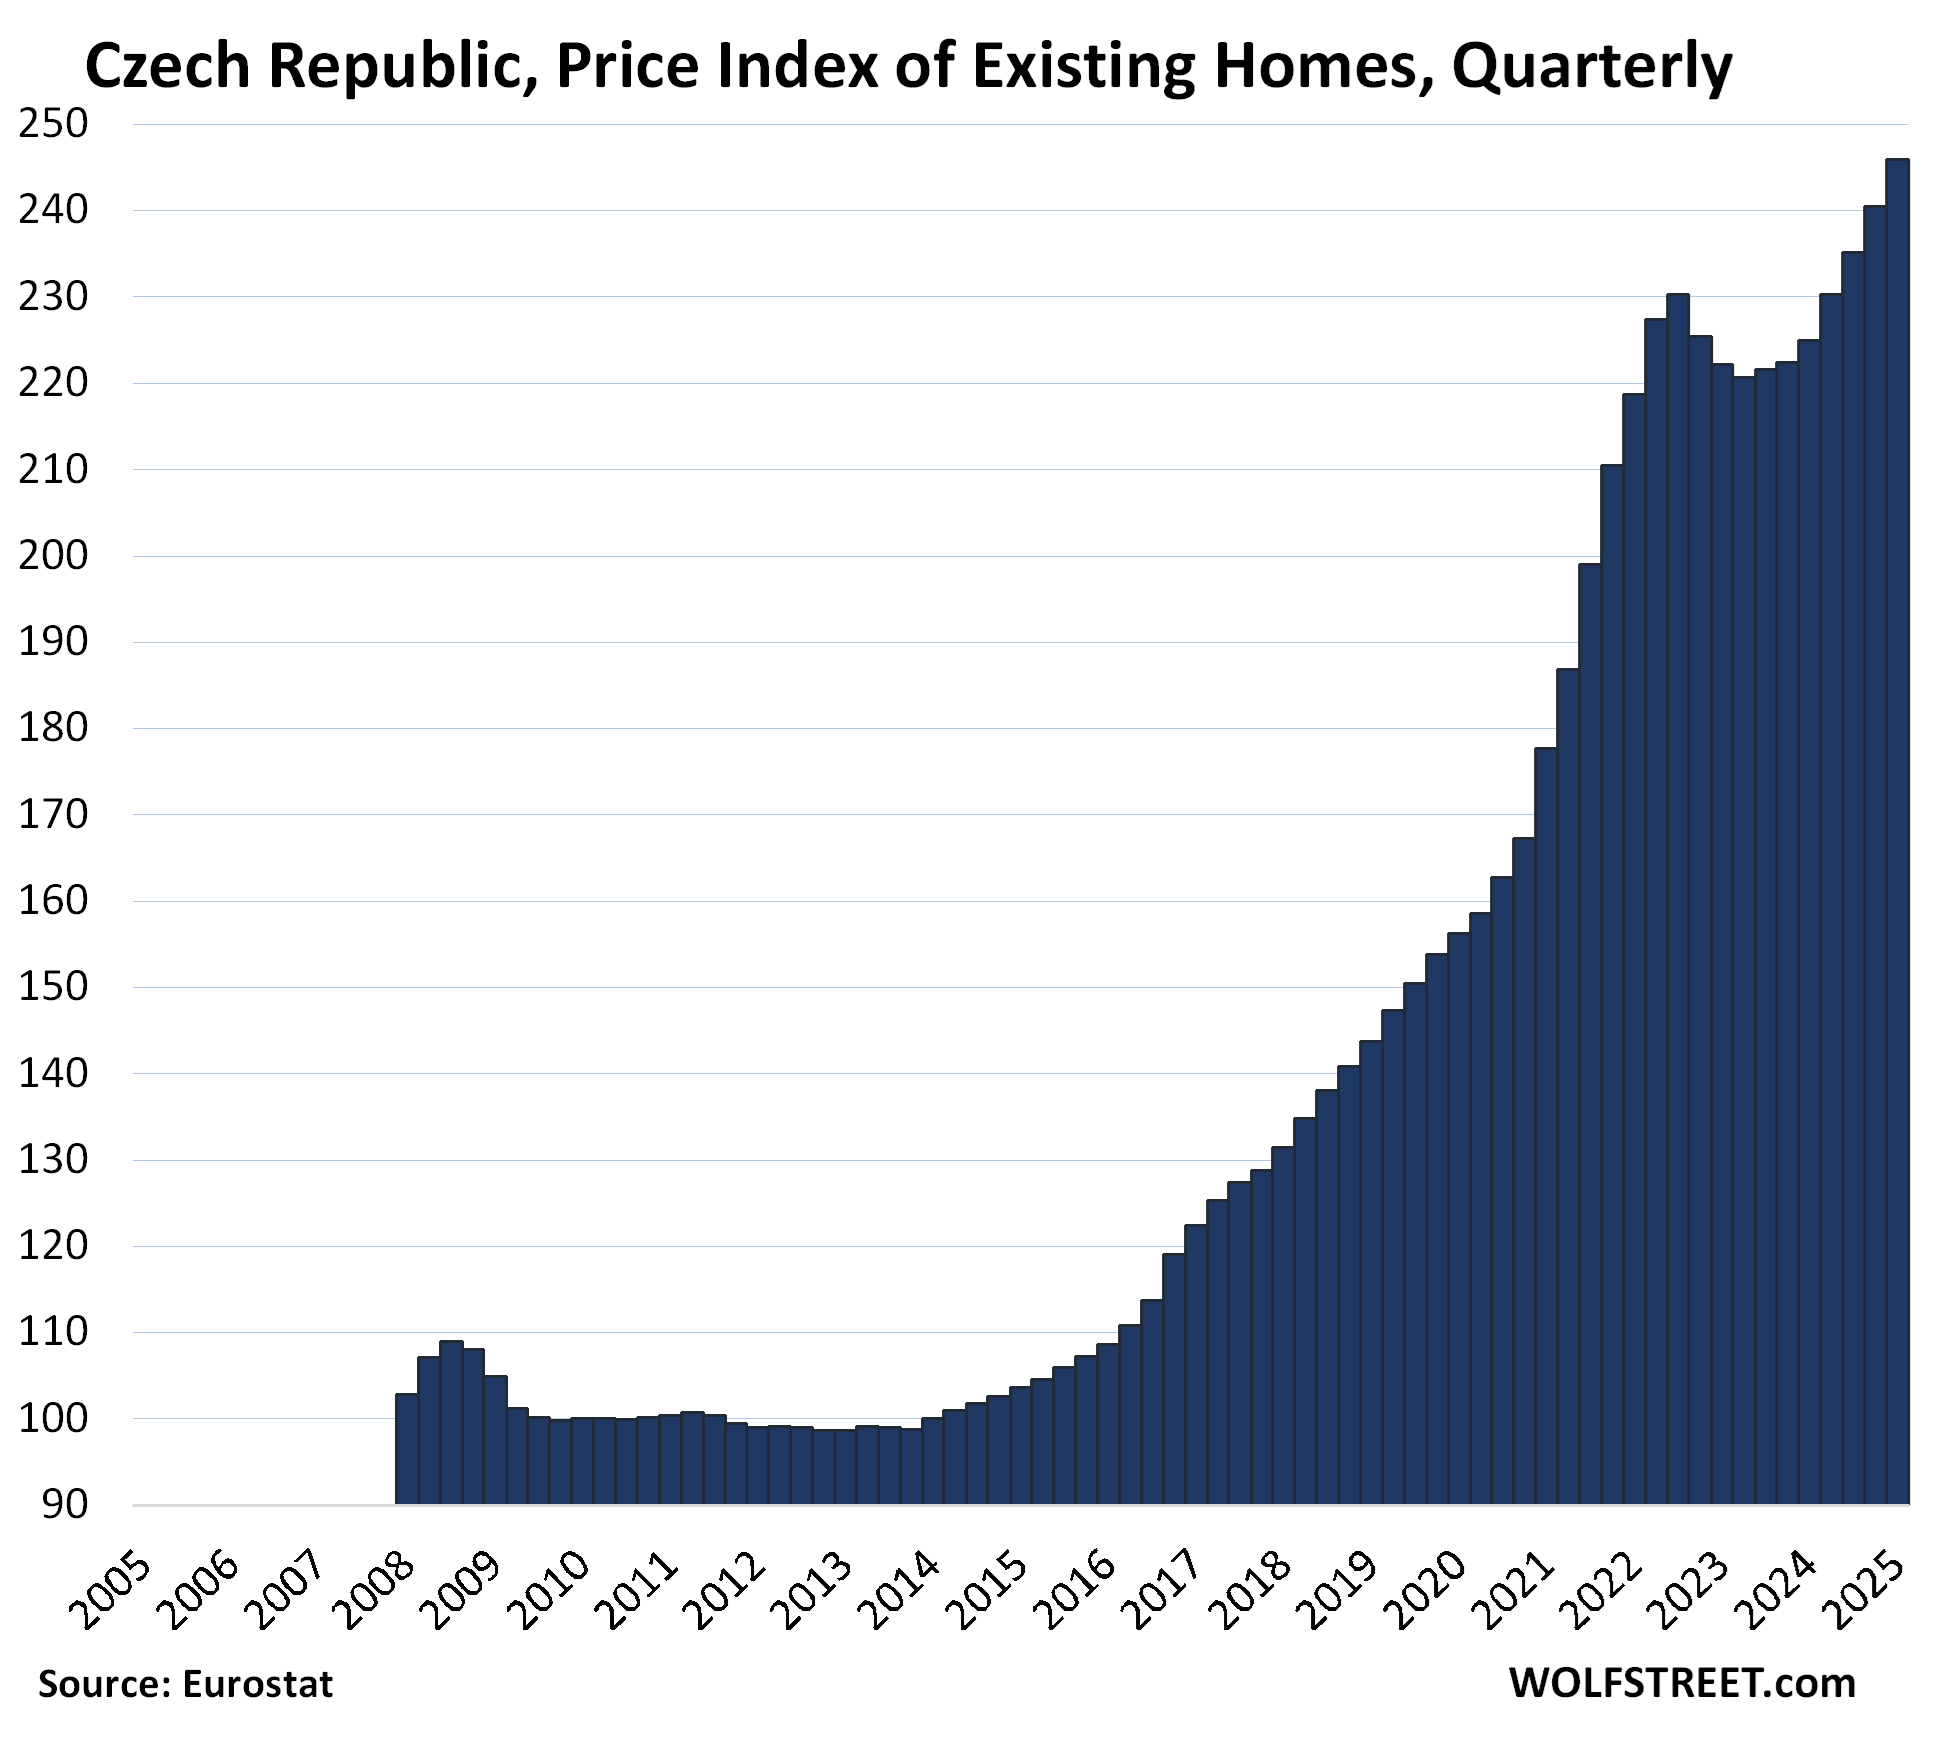
| Czech Republic, Prices of Existing Homes | |||
| 2010 to Peak | QoQ | YoY | |
| 145.9% | 2.2% | 9.3% | New high |

| Portugal, Prices of Existing Homes | |||
| 2010 to Peak | QoQ | YoY | |
| 139.1% | 5.3% | 17.0% | New high |
From 2010 to 2013, the index fell by nearly 20%. From that low point in 2013, the index has nearly tripled.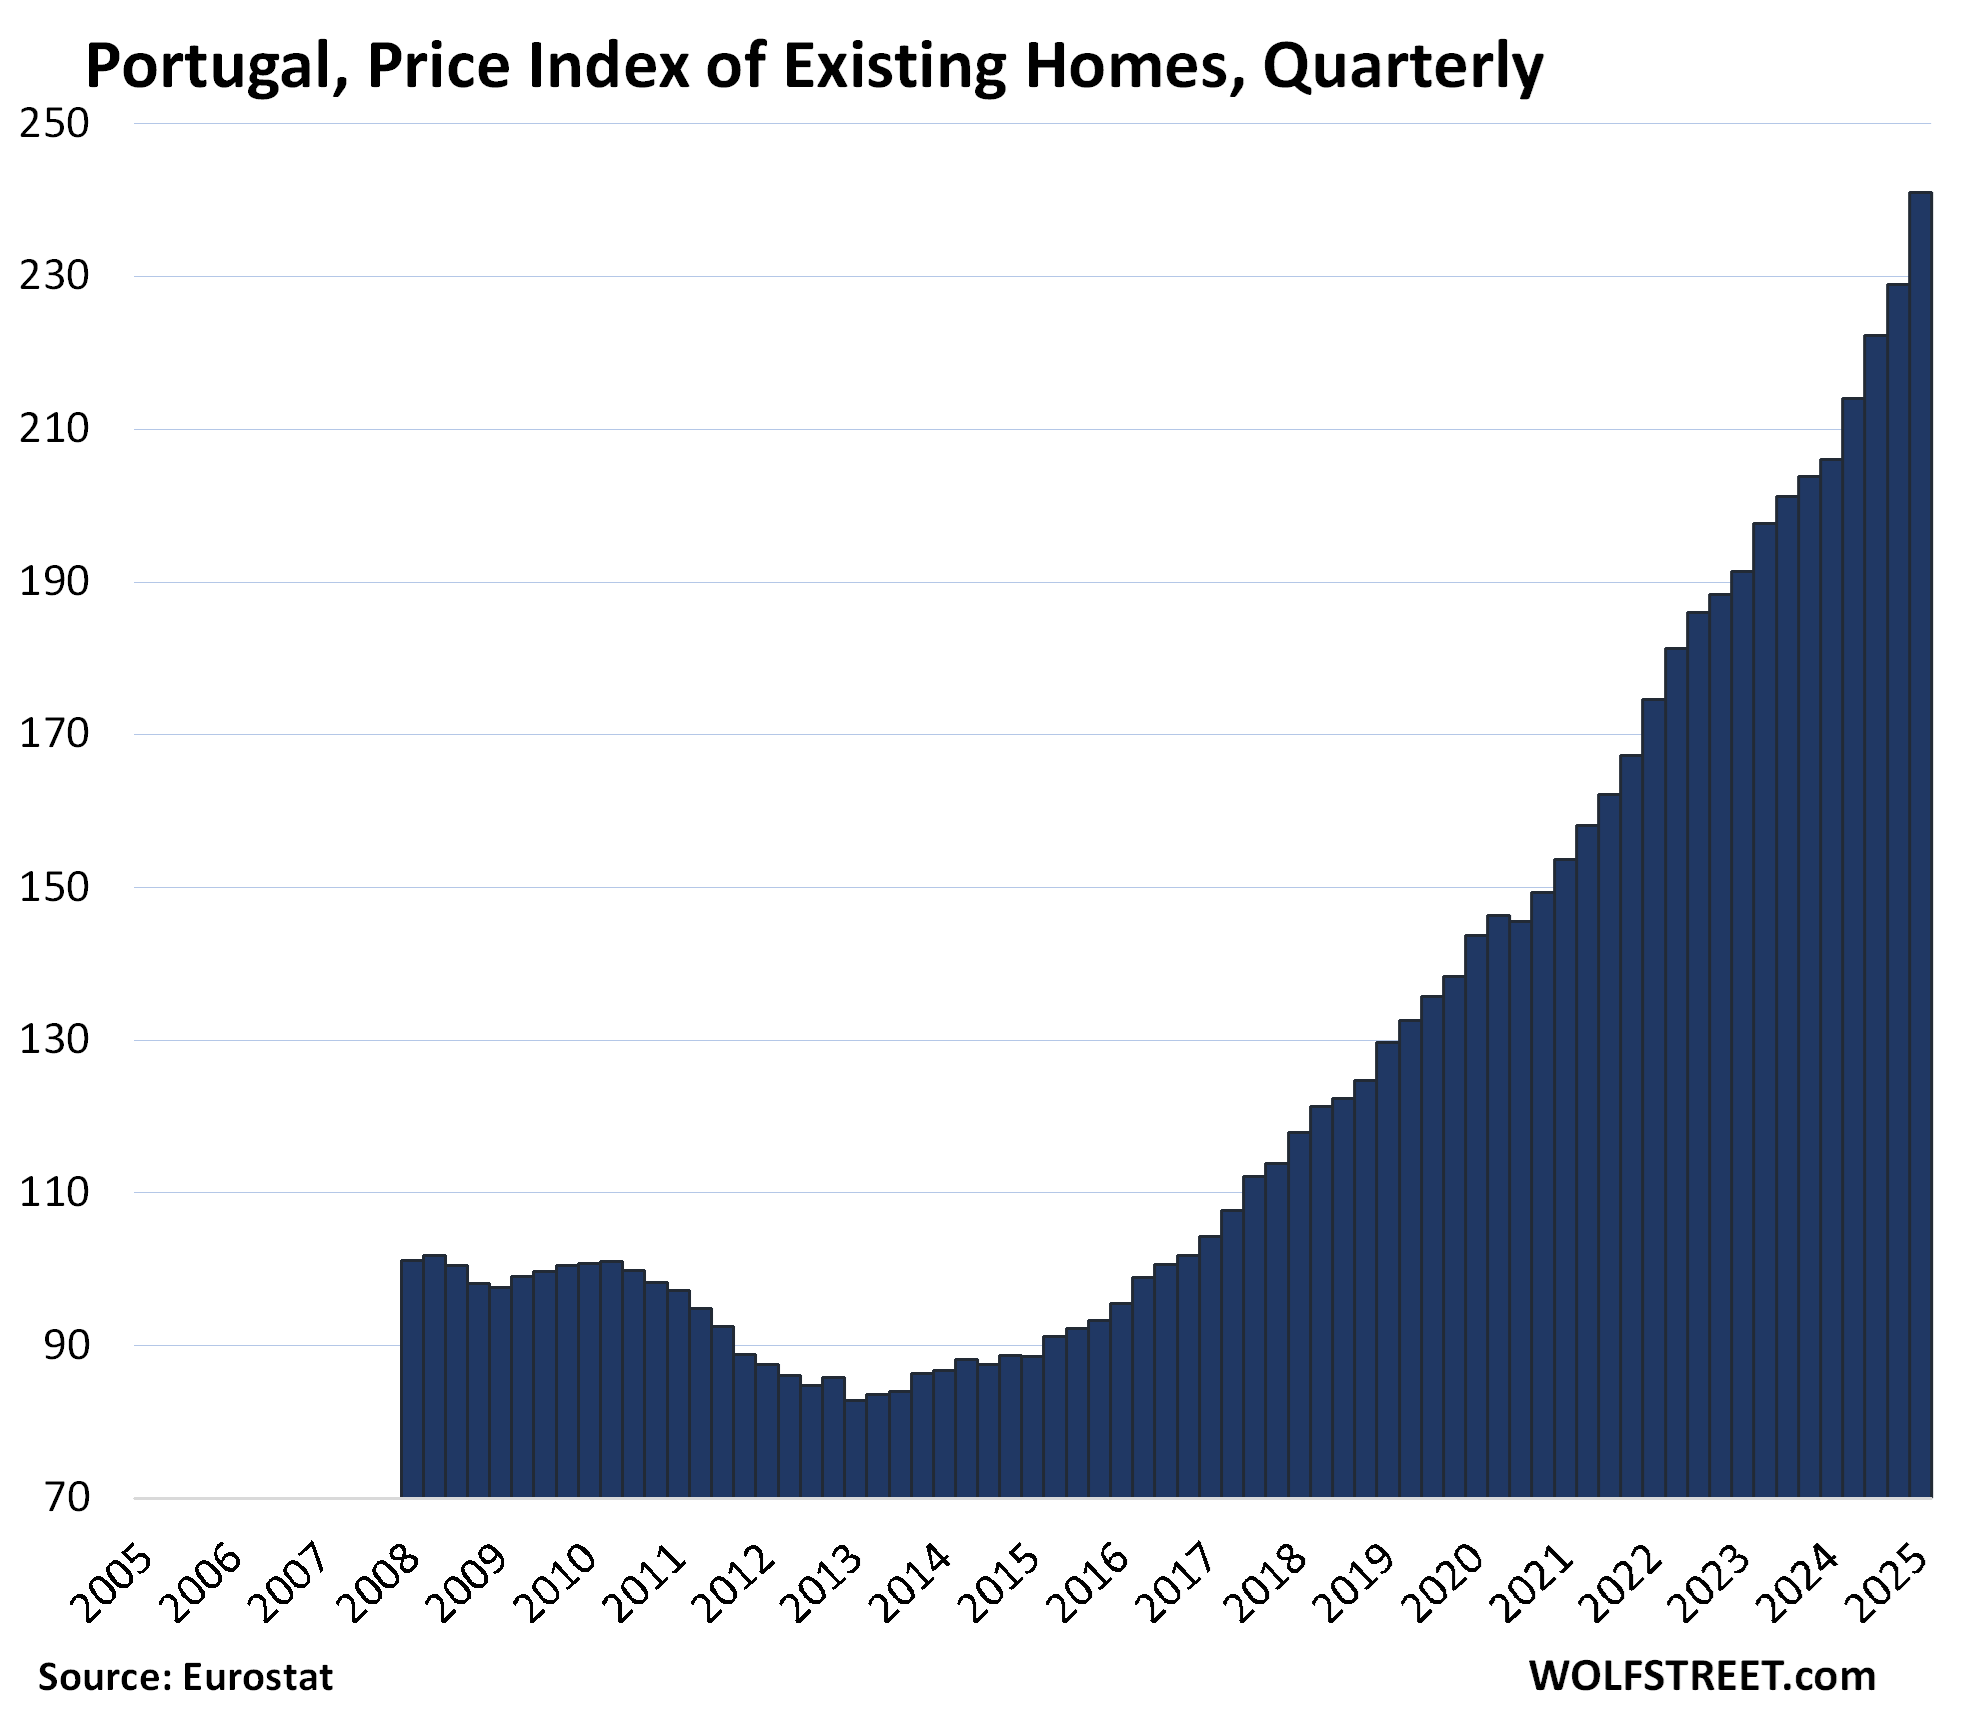

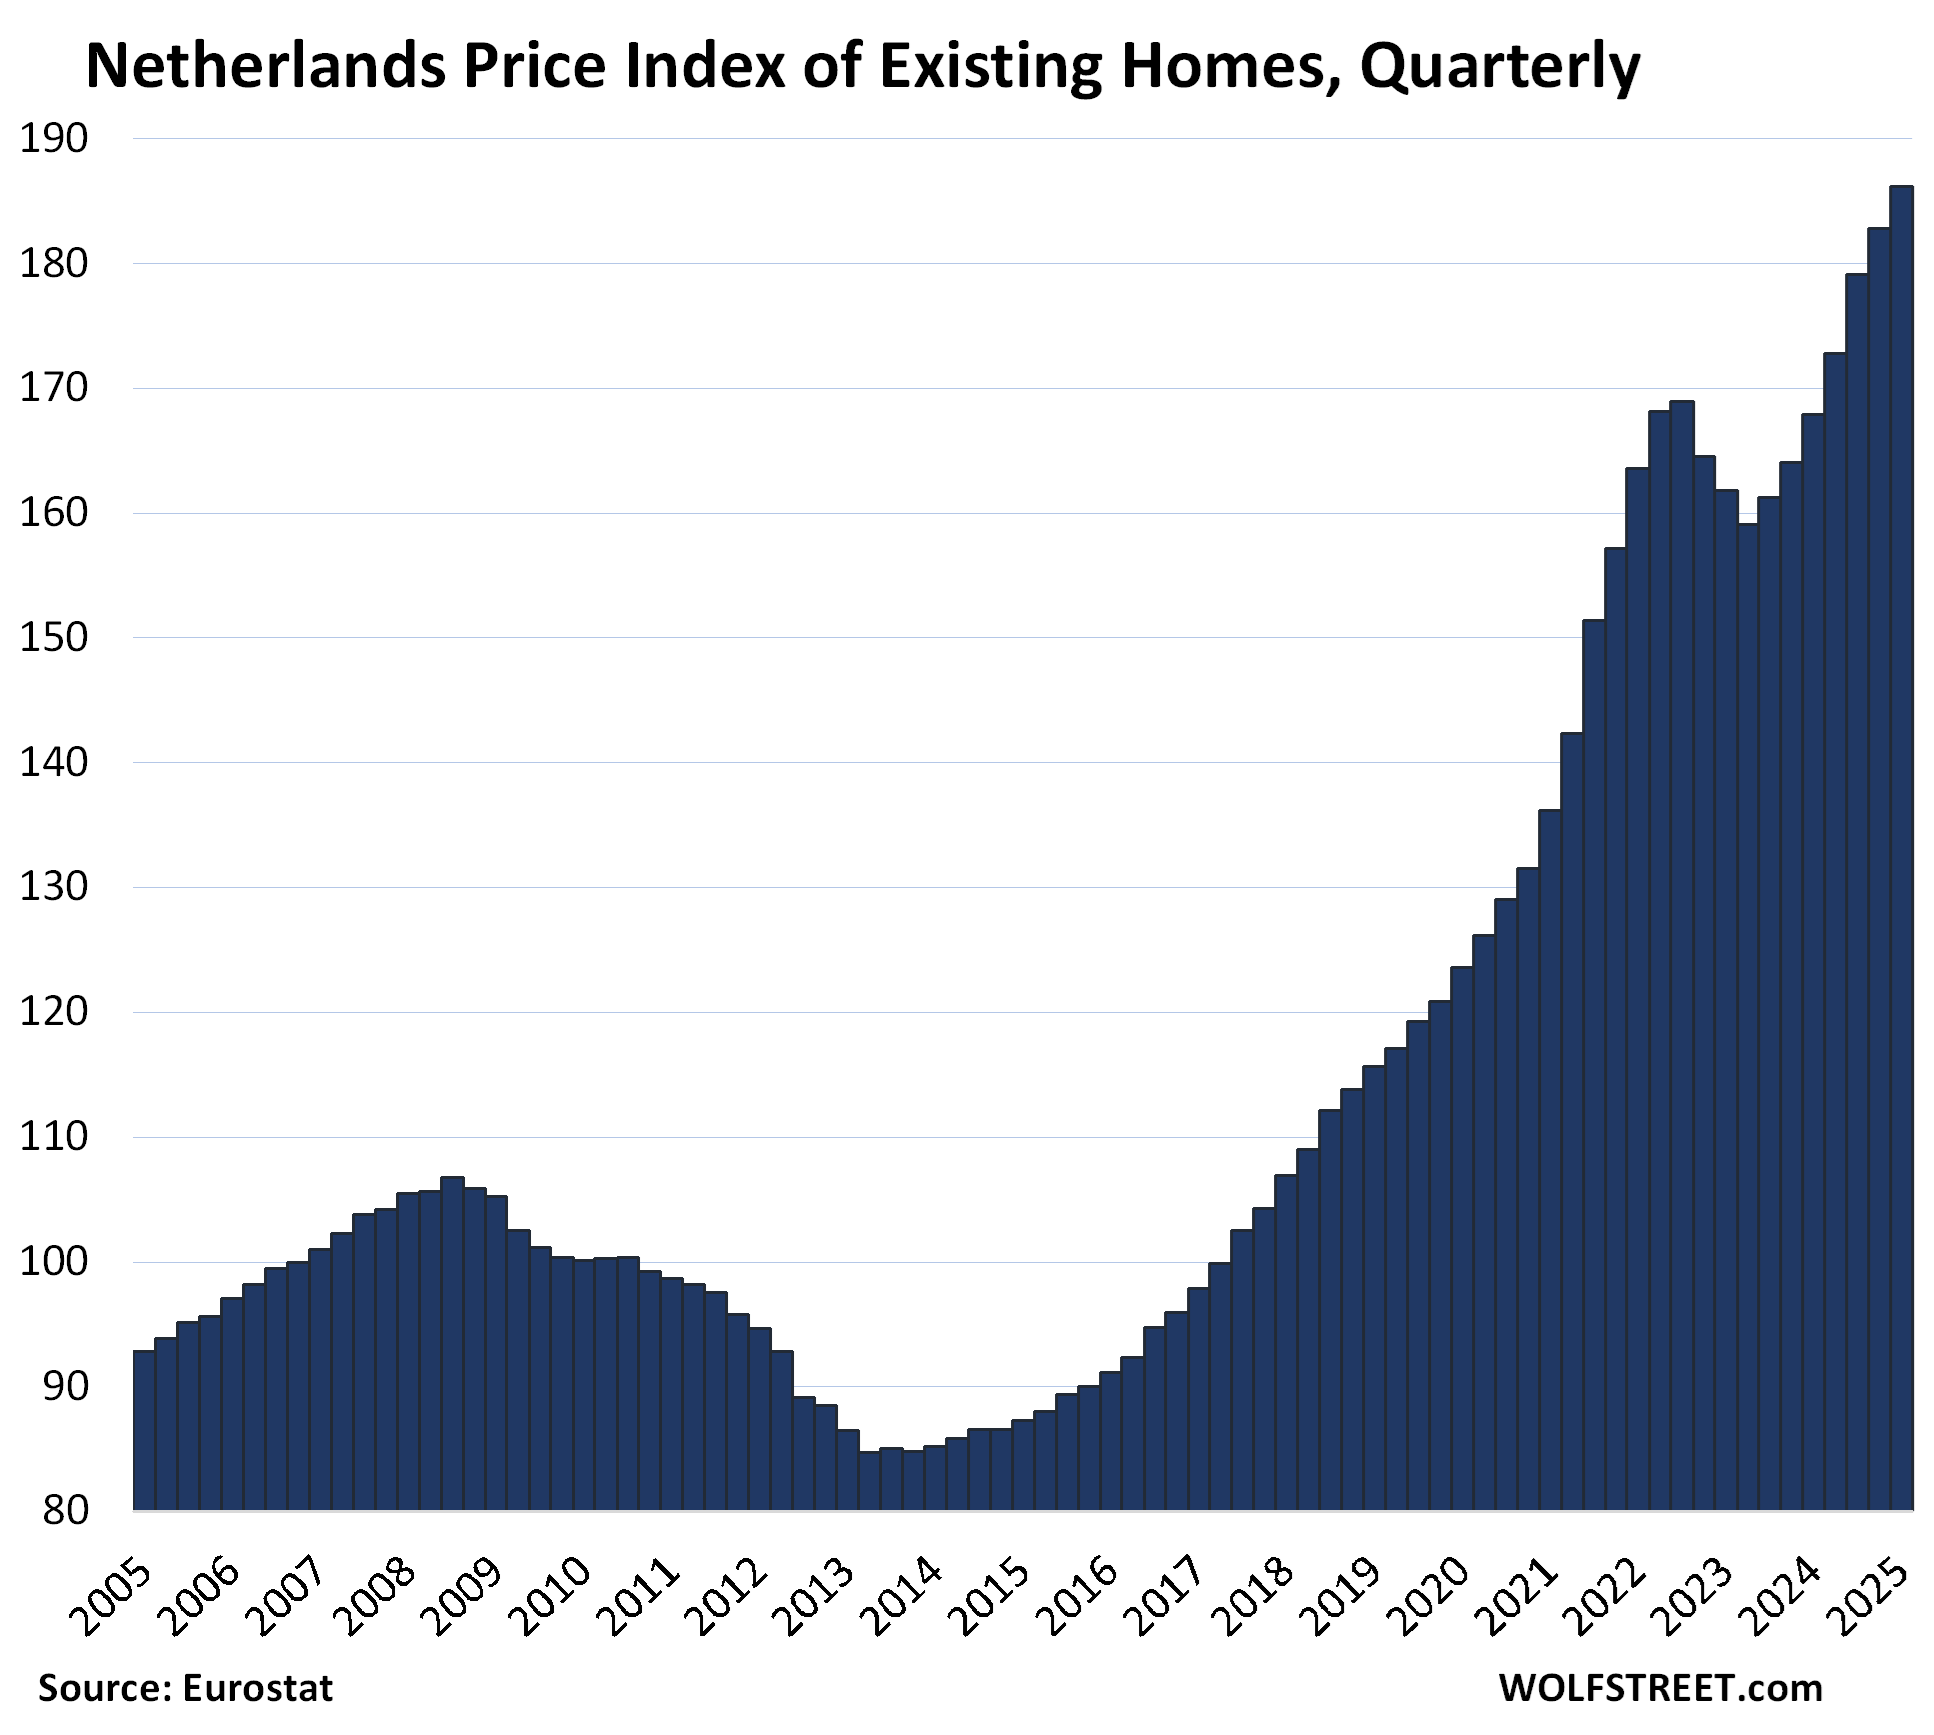
| Netherlands, Prices of Existing Homes | |||
| 2010 to Peak | QoQ | YoY | |
| 85.9% | 1.8% | 10.9% | New high |

Enjoy reading WOLF STREET and want to support it? You can donate. I appreciate it immensely. Click on the mug to find out how:


![]()
