Consider this fact: Three of every five barrels of crude oil produced in the U.S. are exported, either as crude oil or in the form of gasoline, diesel, jet fuel or other petroleum products. Sure, large volumes of crude and products are still being imported, but the net import number is dwindling toward zero — and if you count NGLs (ethane, propane, etc.) in the liquid fuels balance, the U.S. has been a net exporter since 2020. Yes, folks, exports are now calling the shots, and the role of exports is only going to become larger over the next few years. In today’s RBN blog, we discuss highlights from our new Drill Down Report on crude oil and product exports and why they matter more now than ever.
Before the Shale Revolution changed everything, exports of U.S.-sourced crude oil and petroleum products registered only as blips on the radar, a few hundred thousand barrels a day in total. But the sharp rise in U.S. oil production through the 2010s — and, importantly, the lifting of the ban on most crude exports in December 2015 — ushered in a new era. Lately, it’s become a regular thing to see 4 MMb/d or more of oil shipped out of marine terminals along the Gulf Coast, and refineries — especially those in Texas and Louisiana — are exporting a substantial portion of their output too.
As we say in our new Drill Down Report on crude oil and product exports, these shipments to foreign lands are now calling the shots — and having remarkable impacts on U.S. liquid fuel flow patterns, price differentials, infrastructure utilization and, to a great extent, the winners and losers in crude oil and product markets. And things are only going to get more intense as export economics increasingly determine which pipelines, refineries and port facilities capture production growth from the Permian and other basins.
You may say, “Wait … three out of five barrels are exported? How can that be?” This is how we came up with that: In 2022, the U.S. produced 11.8 MMb/d of crude oil and exported 3.5 MMb/d of crude and 3.6 MMb/d of petroleum products — 7.1 MMb/d of crude and products exports in total, or 60% of crude production. Of course, some of those petroleum products are produced from the 6.3 MMb/d of crude oil the U.S. imports or are made available for export due to 1.9 MMb/d of product imports. But even if we add those volumes into the balance, the U.S. was a net importer of only 1.1 MMb/d of crude and petroleum products last year. As U.S. crude production continues to grow, that number is falling inexorably toward zero and beyond — to a world where the U.S. is a net exporter of crude and products no matter how you slice and dice the numbers.
Big-time exports of crude and products are not just about “energy independence” bragging rights. Export markets now determine where crudes flow, which pipelines get the throughput, and the price that different crudes can command in the marketplace. Since the earliest days of U.S. oil and gas, it was domestic refineries and downstream demand that were the dominant market forces in liquid fuels markets. But no longer. Now, with a sizable chunk of marginal barrels moving overseas, exports have taken on a much more important market role.
Here are three examples of how exports have already had a huge impact on the markets — we’ll start with crude oil production in the all-important Permian Basin. In just the past five years, Permian crude oil production has grown by 60%, from 3.5 MMb/d in 2018 to 5.3 MMb/d in 2022 and 5.6 MMb/d in the first four-plus months of 2023. As shown in Figure 1, almost all Permian barrels move to one of four major markets: Cushing, Beaumont, Houston and Corpus Christi.
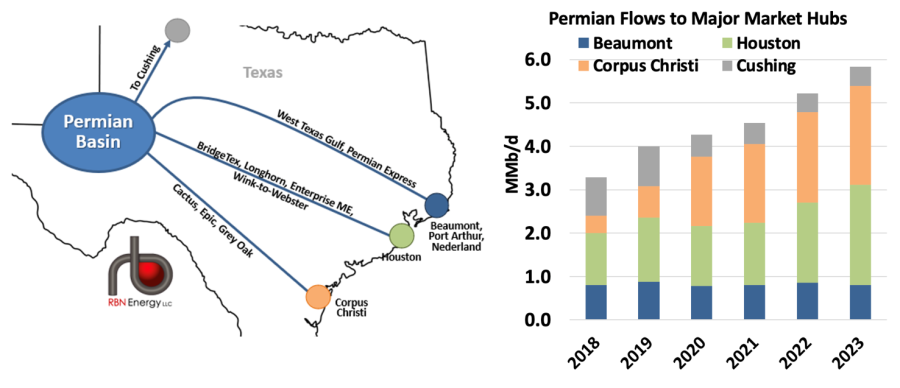
Figure 1. Permian Crude Flows Corridors and Volumes (2023 stats for January through early May). Source: RBN
But over the five years, there has been a significant shift in the proportion of barrels going to each of these markets, illustrated in the bar chart to the right. Back in 2018, 37% of Permian outbound flows went to Houston (green segments), 27% moved to Cushing (gray bar segments), 25% to Beaumont (blue segments), and only a meager 12% to Corpus Christi (orange segments). Fast forward to the first four months of 2023, and Corpus was receiving 39% of flows, and Cushing only 8%. What happened? Of course, it was exports or, to be more accurate, access to export markets. In the second half of 2019, three new pipelines (Cactus II, EPIC Crude and Gray Oak) were completed to bring Permian crudes to new and expanding export docks in Corpus Christi. Almost immediately those pipelines started to fill, not only because of attractive export economics but also due to minimum volume commitments (MVCs) made by shippers on the pipelines and dock facilities that incentivized volumes to move on that corridor. A lot more crude would have moved in that direction if Permian production growth had not been slowed in 2020 by the COVID meltdown.
As for export economics, they are influenced to a considerable degree by the ability of marine terminals to at least partially load Very Large Crude Carriers (VLCCs). Increasing Corpus Christi export volumes are coming mostly from two terminals — Enbridge Ingleside Energy Center (EIEC) and South Texas Gateway (STG), each of which can load up to 1.25 MMb/d of crude oil into a 2-MMbbl VLCC, minimizing the reverse lightering needed to fill a supertanker to the brim. (Soon they’ll be able to load up to 1.6 MMb/d). That cost-efficiency edge has become increasingly important since the Russia/Ukraine war redirected crude flows into much less efficient routings, which has had the effect of blowing out ship charter rates, especially for ships smaller than the massive VLCCs, like Suezmax and Aframax vessels, which are often used for reverse-lightering (see Berth in Reverse).
Figure 2 shows the dramatic increase in VLCC loadings at supertanker-capable terminals along the Gulf Coast over the past few months. In 2020 and 2021, an average of 10 VLCCs per month moved out of these facilities (orange line), mostly from Enbridge’s Ingleside terminal (purple layer), but increasingly from STG (green layer) as that new facility ramped up volumes. But in 2022 and especially in early 2023, direct VLCC loadings reached a whole new level — averaging 17 per month last year and 24 in the first four-plus months of 2023, including a record 40 in April.
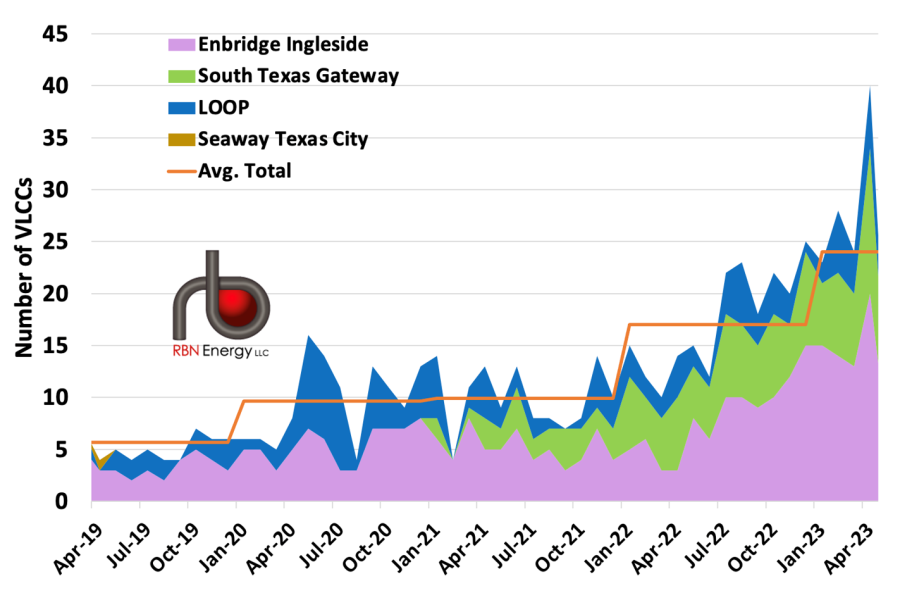
Figure 2. Direct-Loaded USGC VLCC Shipments. Source: RBN Crude Voyager
And here’s a third example, related to the two above. With more Permian barrels being pulled to Corpus Christi by new pipeline capacity and VLCC economics, barrels are being drawn away from pipelines that would otherwise have been moving those barrels to other export facilities, primarily those in Houston. Thus, flows on pipes from the Permian into Houston have been well below capacity. The resultant pipeline capacity surplus did what overcapacity always does: it crushed the price differential between the source of supply (the Permian) and the market (Houston), represented in the graphs in Figure 3 by the spread between the Midland price of WTI versus the price at Magellan East Houston (MEH).
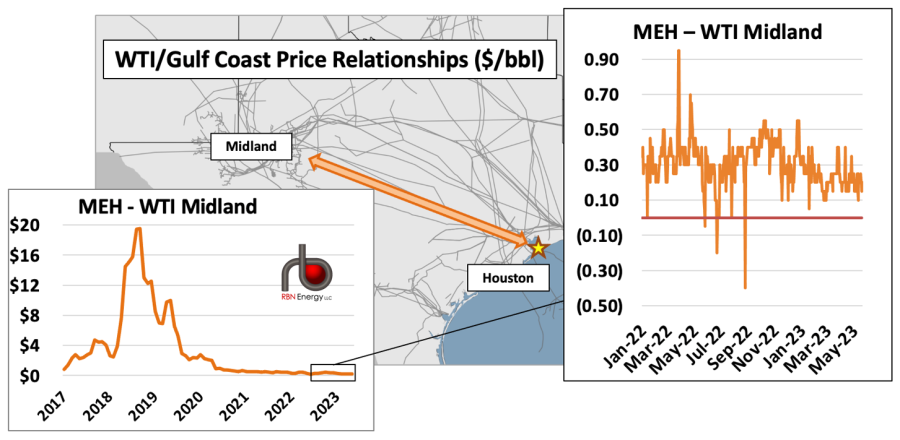
Figure 3. WTI/Houston Price Relationship. Sources: Bloomberg, RBN
The differential that soared up to $20/bbl back in 2018 (peak in graph to lower left) averaged a paltry $0.50/bbl in 2021 as the combo Wink-to-Webster (W2W) pipeline (that includes the Enterprise Midland‐to‐ECHO 3 pipe as an undivided interest) started to ramp up. Then things got even skinnier. In February 2022 the full 1.5-MMb/d capacity of W2W came entirely online, without nearly enough Permian crude to fill the pipe. The right graph in Figure 3 shows what happened to the differential — over the past 14-plus months it has fallen substantially and occasionally flipped negative, meaning Permian crude is sometimes priced higher in Midland than Houston.
There’s much more to the story, of course, which we discuss in detail in our new Drill Down Report. There’s also a products-exports angle. The U.S. is the world’s largest exporter of the “Big 3” petroleum products — gasoline, diesel/gasoil and jet fuel/kerosene — but it still imports significant volumes of those very same products. That paradox, which is not unlike the U.S.’s need to both export and import various grades of crude oil, is tied to a mismatch between where the product is produced and where it is consumed.
Again, we delve into product exports (and imports) in the Drill Down. But the simple version of the story is that PADD 3, which is primarily composed of the Gulf Coast states, is long all of the “Big 3” products and accounts for the lion’s share of U.S. product exports (gray layer in right graph in Figure 4). In turn, PADD 1 (East Coast) accounts for about three-quarters of U.S. product imports (dark-blue layer in left graph). Those imports are needed because PADD 3 movements to PADD 1 are limited by pipeline capacity, and the two major pipelines traveling from the Gulf Coast to the East Coast (Colonial and the former Plantation Pipeline, now called the Products Pipeline) are generally full, which leaves PADD 1 in need of barrels.
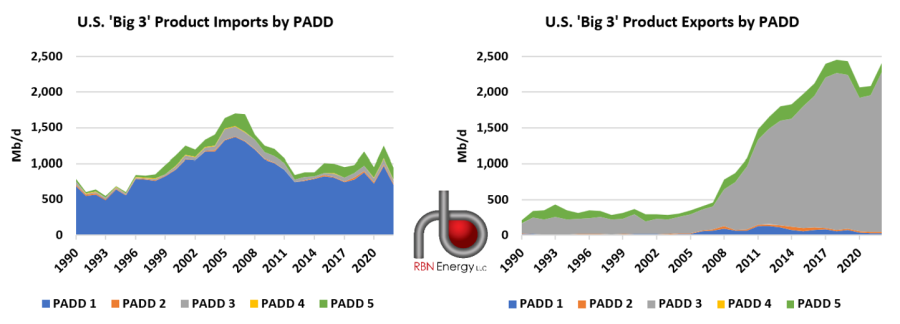
Figure 4. U.S. “Big 3” Product Imports and Exports by PADD. Source: EIA
But PADDs 1 and 3 aren’t the only regions where imports and exports don’t line up. PADD 5 (West Coast; green layer in both graphs) imports the second-highest volume of products — primarily jet fuel and gasoline — while also exporting products, largely due to a mismatch between where product is produced and where it is consumed, along with increasing biomass-based diesel consumption that is displacing petroleum diesel. PADD 2 (Midwest; orange layers) and PADD 4 (Rockies; yellow layers) also conduct comparatively small volumes of import-and-export trade with Canada.
Looking at the long-term trend in exports (right graph in Figure 4), one can clearly see the strong growth in U.S. product shipments since around 2007 — just before product demand collapsed during the Great Recession of 2007-09. Over the following years, PADD 3 refiners demonstrated their strong competitive advantage relative to foreign players and were able to tap into new export markets, primarily in Latin America, while refinery utilization south of the border deteriorated and a number of refineries in much of the developed world — including Europe, U.S. PADDs 1 and 5, Japan and Australia — were shuttered.
The competitive advantage of PADD 3 refiners was further strengthened in the 2010s by the growth of U.S. shale crude production, which allowed for further refinery expansion, even as domestic demand for the “Big 3” products stayed well below pre-Great Recession levels. Export growth stumbled a bit in 2019, due largely to increased competition from refiners abroad, especially in China, the Middle East and India, before falling dramatically in 2020 due to COVID. The challenging environment of 2020 and 2021 led to a wave of shutdowns across the U.S., with the closures extending even to large, formerly profitable refineries in PADD 3.
Despite these closures, 2022 exports nearly returned to pre-COVID highs due both to decreased domestic demand and capacity creep. It’s likely that 2023 will show continued growth in exports due to the startup of new refinery projects (particularly ExxonMobil’s Beaumont, TX, expansion) and continued capacity creep before a brief step backward in exports next year, due primarily to the pending closure of LyondellBassel’s Houston refinery. Beyond 2024, limited (if any) U.S. demand growth for the “Big 3” petroleum products means that the U.S. will need to export increasing volumes of all three commodities or face further reductions in domestic refinery production.