


Update on an ugly situation.
By Wolf Richter for WOLF STREET.
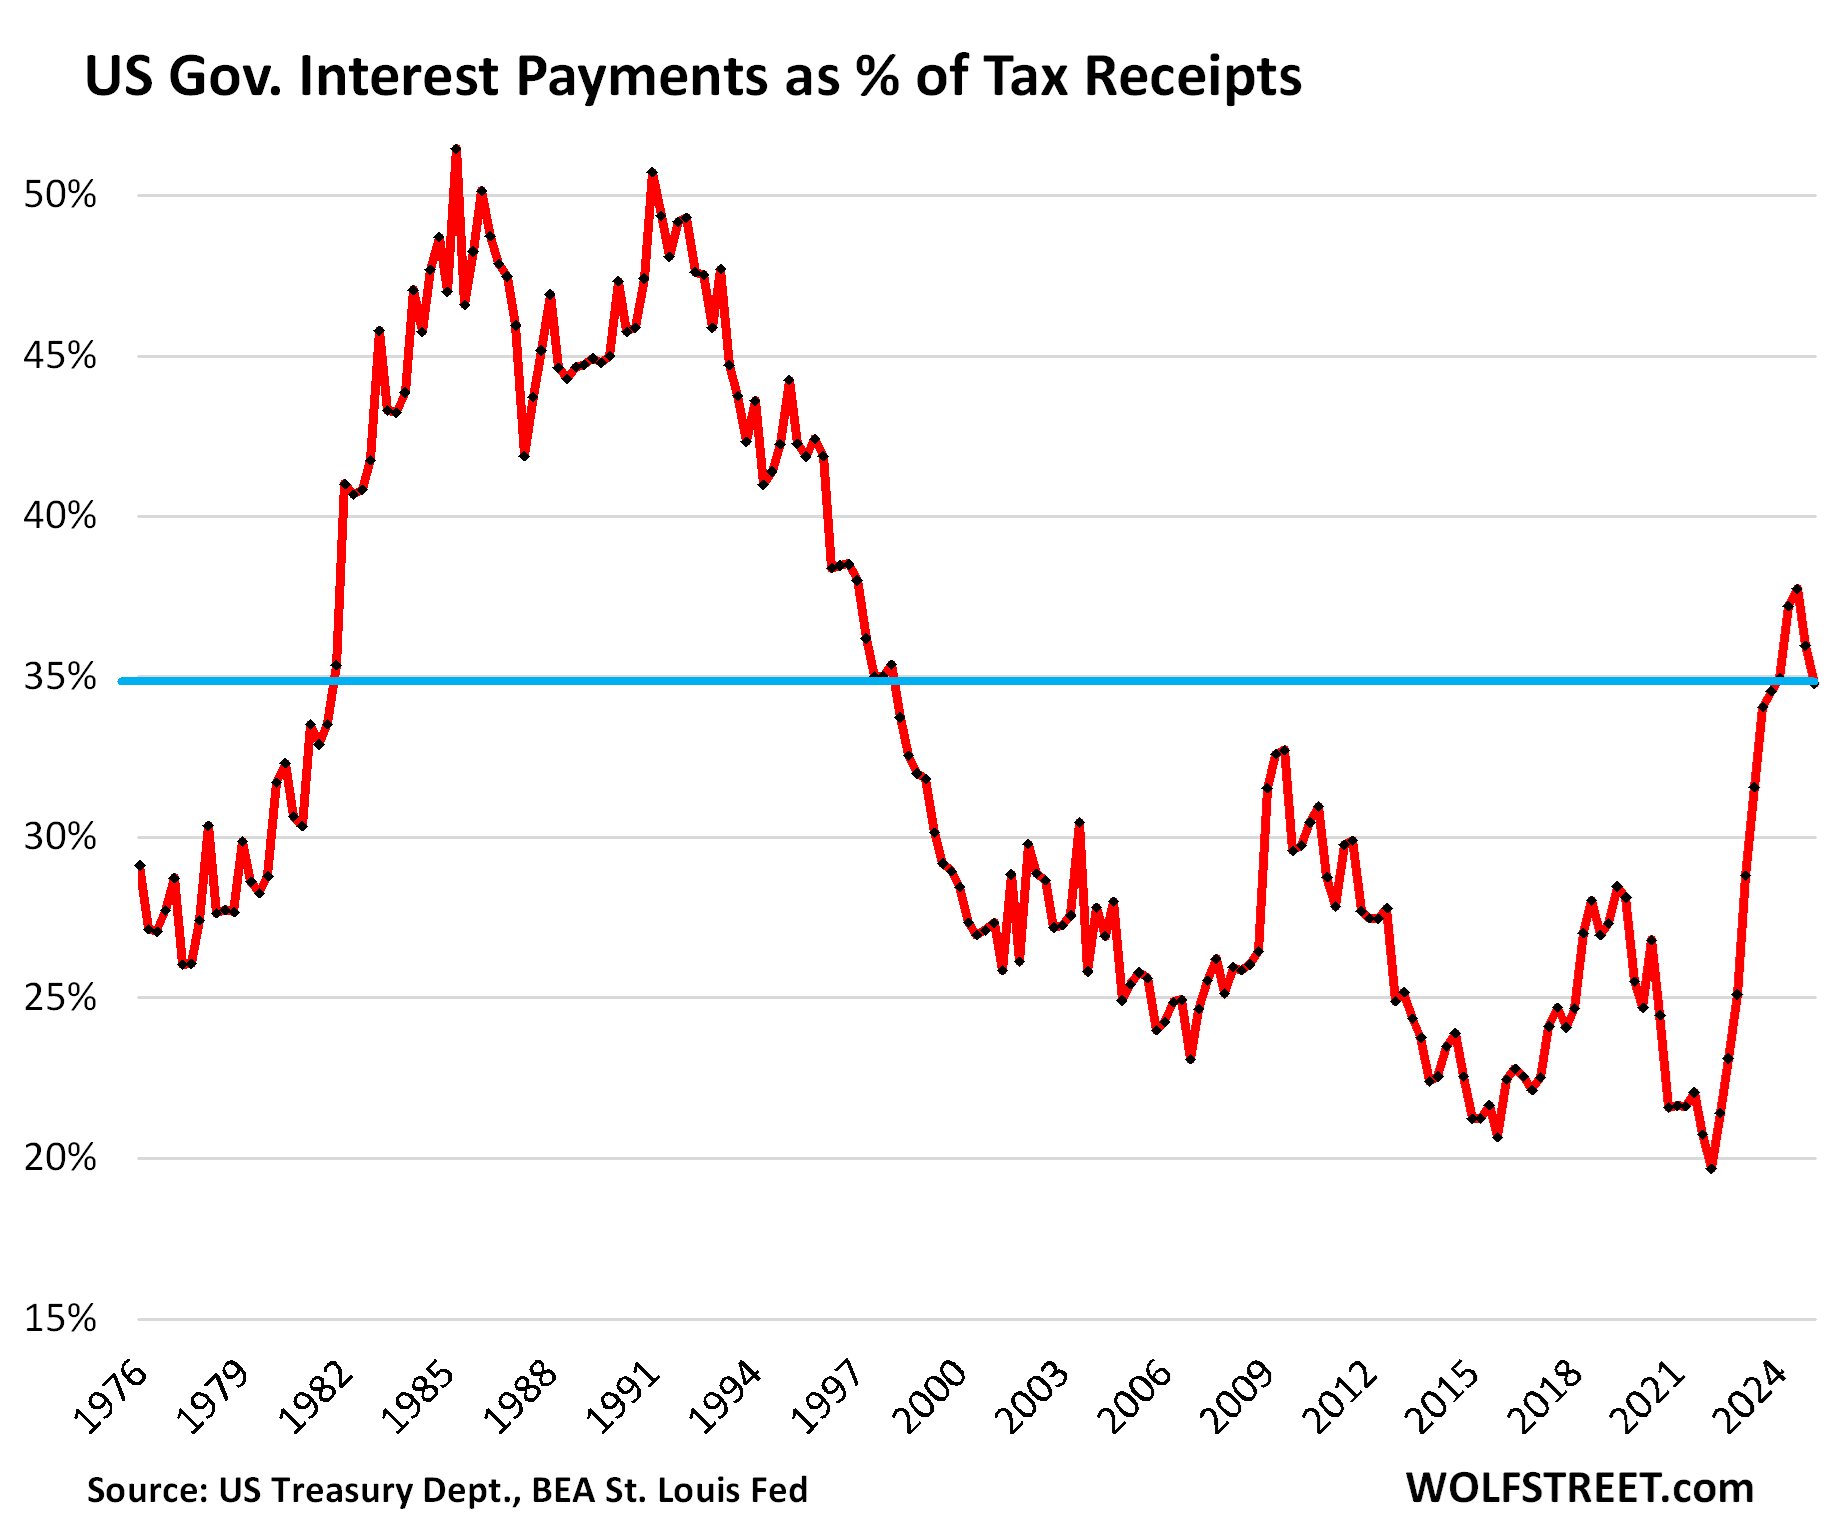
A key issue of the US government fiscal situation: What portion of the tax receipts are eaten up by interest payments on the monstrous and ballooning federal debt. At the peak of the last crisis in the early 1980s, that ratio had exceeded 50%. It was a crisis because the 10-year Treasury yield was over 10% for six years in a row and mortgage rates were over 10% for 12 years in a row, an unimaginable number today but bitter reality back then.
Interest payments by the federal government on its monstrous $36.2 trillion in Treasury debt dipped by 0.9% in Q1 from Q4, to $279 billion (red in the chart below), helped by the lower interest rates on the $6 trillion in Treasury bills, whose yields track the Fed’s short-term rates that got cut by 100 basis points last year; and by the debt ceiling that temporarily prevented the debt from surging further though it will make up for it when the debt ceiling is lifted or suspended.
Tax receipts by the federal government rose by $19 billion (+2.4%) in Q1 from Q4 and by $37 billion (+4.9%) year-over-year, to $801 billion (blue in the chart below). Tax receipts jump and drop with capital-gains taxes, while employment taxes and income taxes rise fairly slowly and steadily unless there’s a recession. Q1 tax receipts benefited from last year having been good for stocks and other assets, with capital gains taxes due by April 15. Q2 will also benefit from those capital gains taxes. By contrast, 2022 was a bad year for stocks, and tax receipts in Q1 and Q2 2023 came in much lower, after the spike during the free-money-from-heaven pandemic.
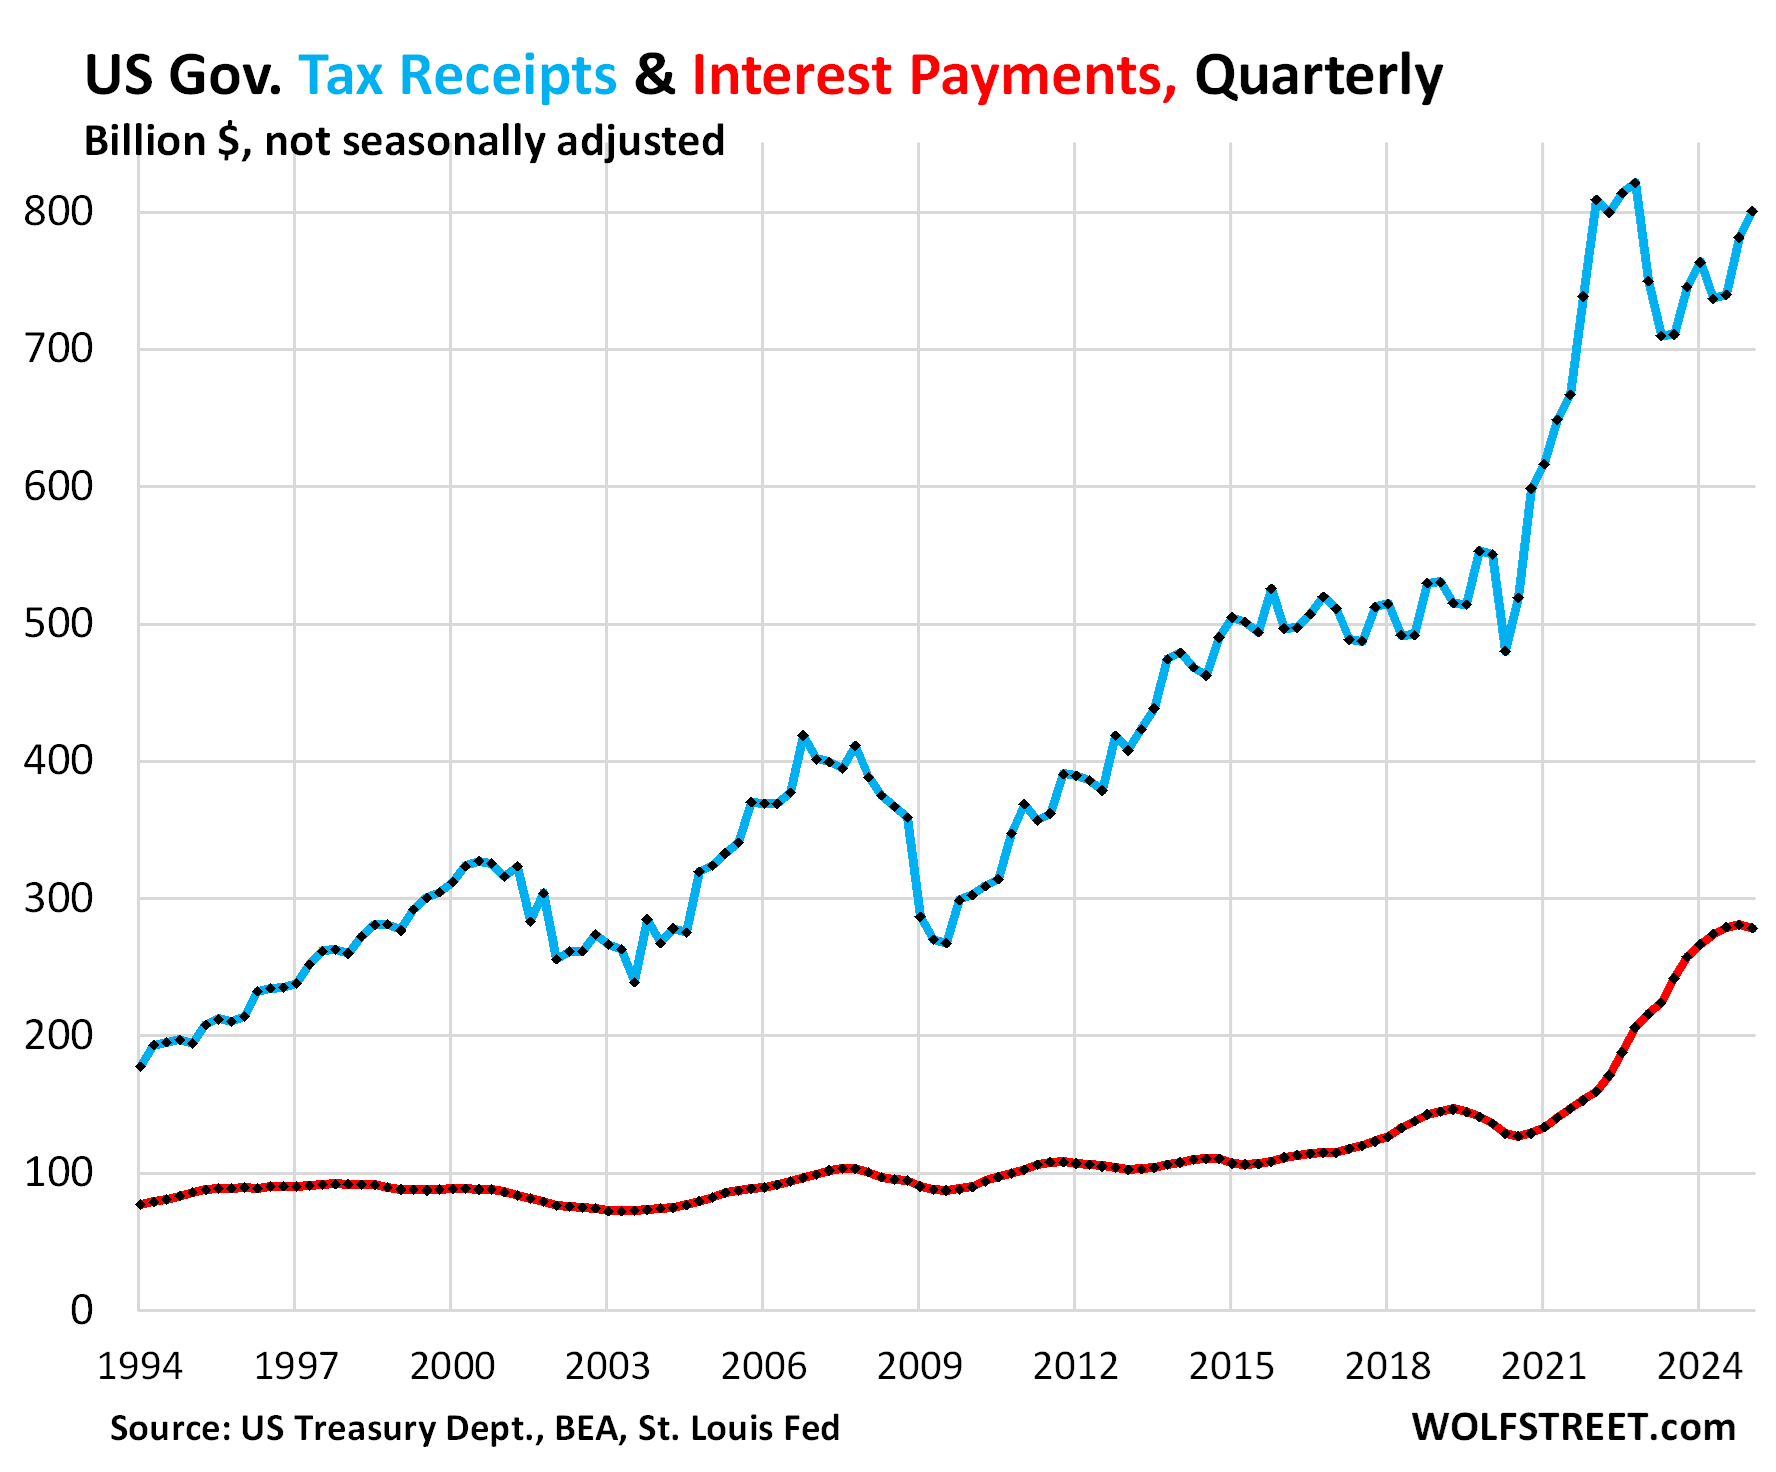

This measure of tax receipts was released today by the Bureau of Economic Analysis as part of its second revision of Q1 GDP. It tracks the tax receipts that are available to pay for general budget expenditures, such as defense spending, interest payments, etc. Excluded are receipts that are not available to pay for general budget expenditures, primarily Social Security and disability contributions that go into Trust Funds, out of which the benefits are then paid directly to the beneficiaries of the systems.
Interest expense as a percent of tax receipts: Interest payments in Q1 ate up 34.8% of the tax receipts that were available to pay for them. The ratio declined for the second consecutive quarter, driven by higher tax receipts and the dip in interest payments.
The recent high occurred in Q3 2024, at 37.7%, the worst ratio since 1996, when it was on the downtrend from the scary times in the 1980s. The magnitude and speed of this spike over the prior two years was unprecedented in modern US history:

The debt has ballooned by $13 trillion (by 56%) in just five years, from $23.2 trillion in Q1 2020 to $36.2 trillion in Q1 2025, including by $2.2 trillion in 2024 despite above-average real GDP growth.
The ballooning of the debt is temporarily on hold due to the debt ceiling, but to make up for it, because there are no free lunches, it will spike by $1 trillion within months of the debt ceiling getting lifted, and will continue to balloon with renewed vigor afterwards.
Interest rates are much higher than the historic lows five years ago.
Short-term interest rates had been at near-0% in 2020 and 2021, but started rising in 2022 and reached about 5.4% in mid-2023 and then stayed there for a year. Last fall, the Fed cut its policy rates by 100 basis points, which has pushed down the interest rate at which the government can sell T-bills to about 4.3%. The $6 trillion in T-bills are constantly getting rolled over as they mature, and new T-bills are sold at lower interest costs for the government, which contributed to the dip in interest expenses.
However, the interest rates at which the government can sell long-term Treasury securities have not changed much over the past two years. For example, the 10-year yield lurched up and down over those two years, sometimes violently, but has mostly remained in a range between 3.7% and 4.7%, and is now about where it was a year ago (4.4%). And those rates are far higher than where they’d been.
For instance, the 10-year Treasury issue that matured this month was sold in May 2015 at a yield of 2.24%. The government replaced it this month with new 10-year notes that it sold with a yield of 4.34%, nearly double the interest cost for the government.
In addition, the size of the issue has doubled, from $24 billion in 2015 to $42 billion in this Month.
But the process is slow. Long-term securities by definition are slow to cycle out of the debt, so changes in long-term interest rates filter only slowly into the debt as old maturing debt is replaced with new debt that comes with the new interest rates.
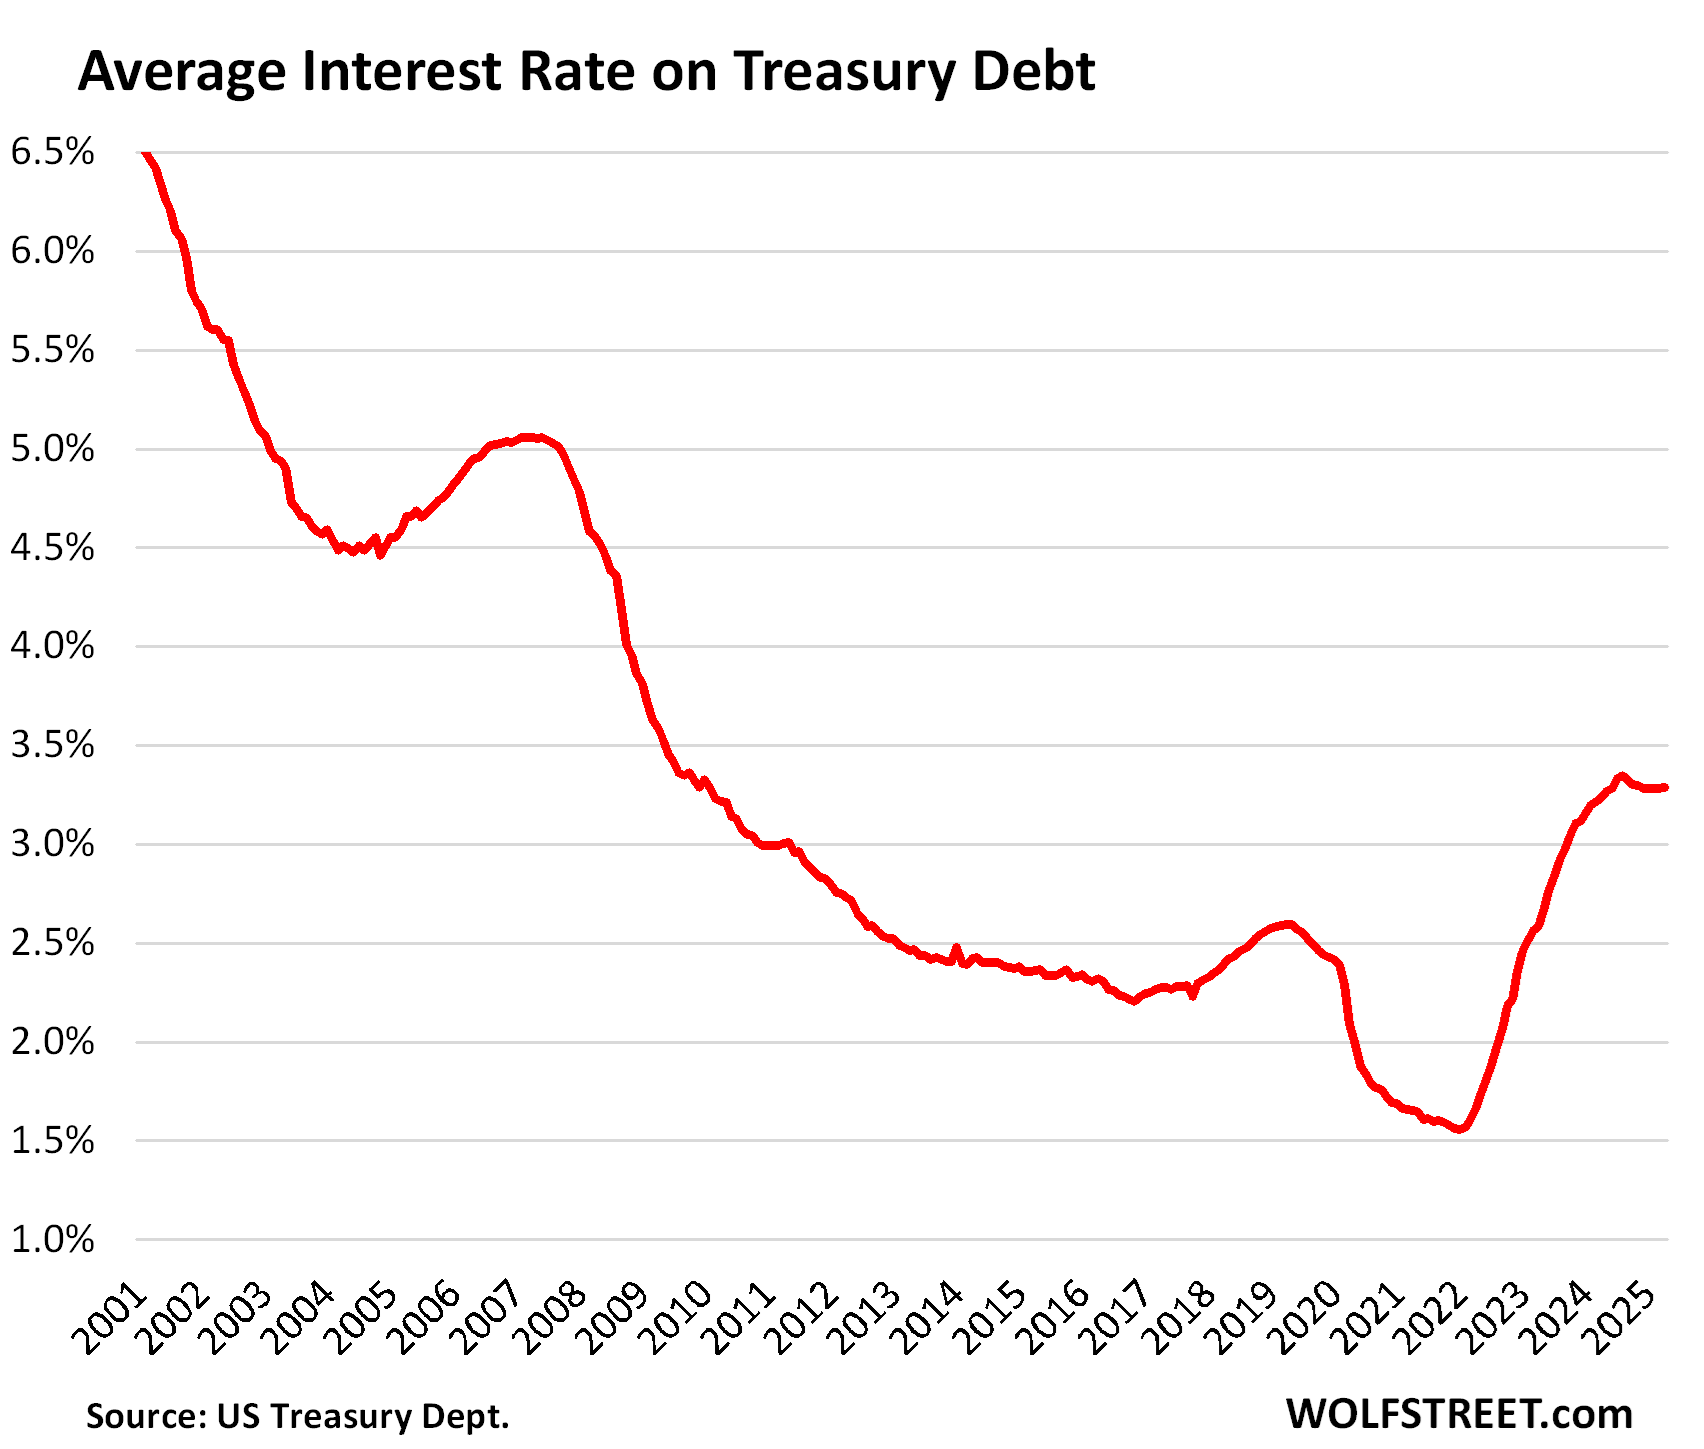
These dynamics form the average interest rate that the government pays on its total outstanding debt. That average interest more than doubled from 1.55% in 2022 to 3.35% August 2024. Since then, it has eased a hair. In April, it inched up to 3.29%, according to data from the Treasury Department:

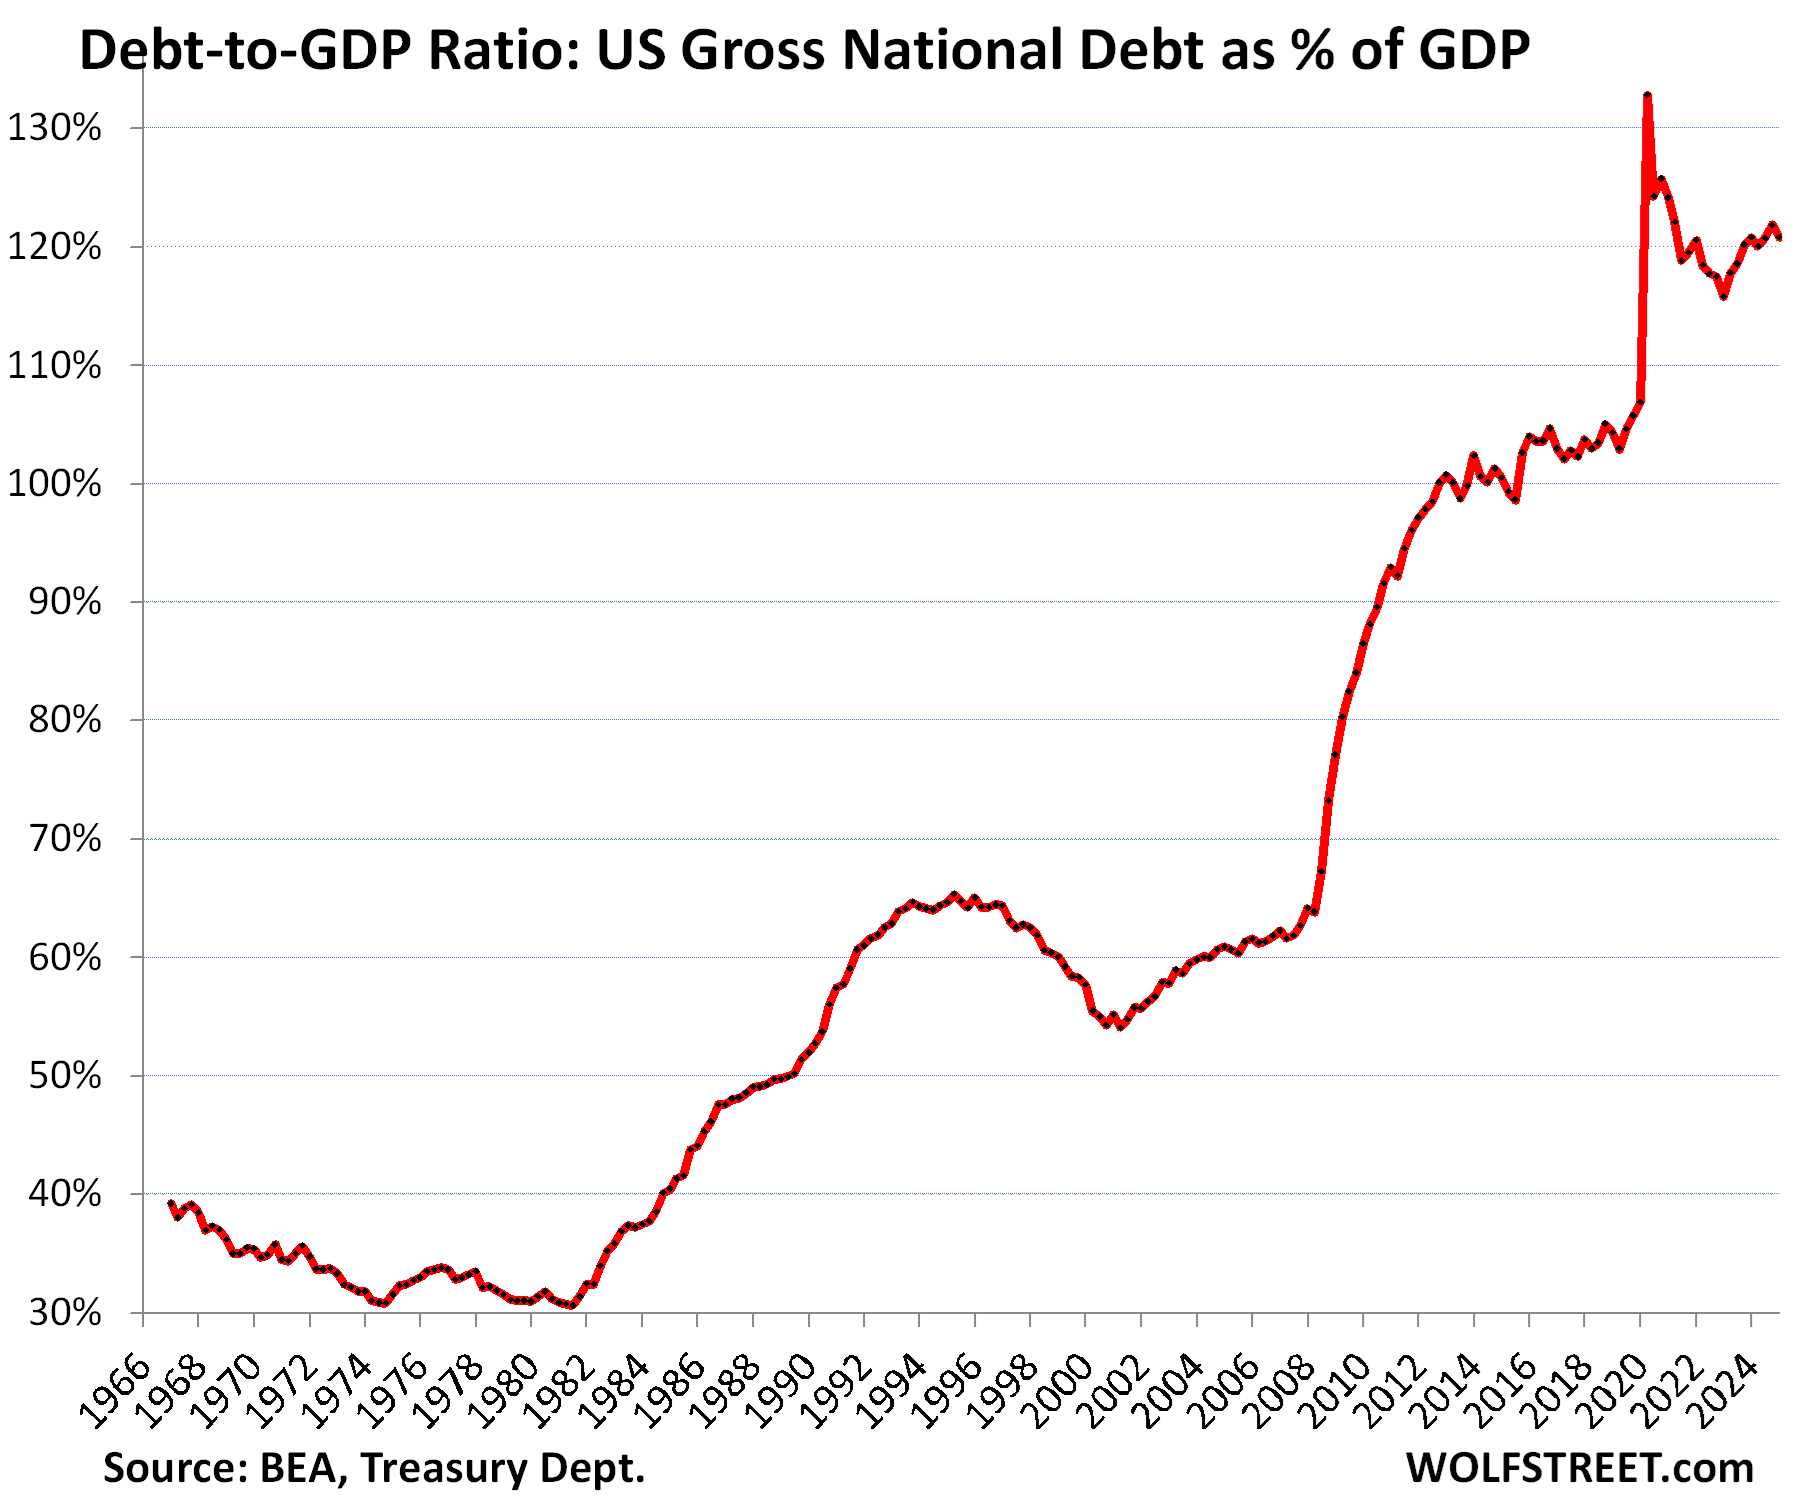
The ugly Debt-to-GDP ratio: Total debt as percent of GDP eased in Q1 to 120.8%, based on the second estimate of Q1 “current dollar” GDP released by the BEA today. It dipped because the debt ceiling temporarily blocked the debt from growing.
The Debt-to-GDP ratio = total debt (not adjusted for inflation) divided by “current dollar” GDP (not adjusted for inflation). Inflation cancels out because the inflation factor affects both the numerator and the denominator equally.

Obviously, the US, by controlling its own currency, cannot default on its debt because it can always “print” itself out of trouble (Fed buys some of the debt). But printing money to service an out-of-control debt and deficit in an inflationary environment could cause inflation to spiral out of control, which would wreak havoc on the economy, lead to years of economic pain, wealth destruction, and lower standards of living. So this is nothing to be trifled with. The far better solution is to trim the annual deficit down to where economic growth and modest inflation outrun it, which would over time alleviate the problem.
Enjoy reading WOLF STREET and want to support it? You can donate. I appreciate it immensely. Click on the mug to find out how:


![]()
