


A hot question for an iffy situation. So here are the holders as of Q3.
By Wolf Richter for WOLF STREET:
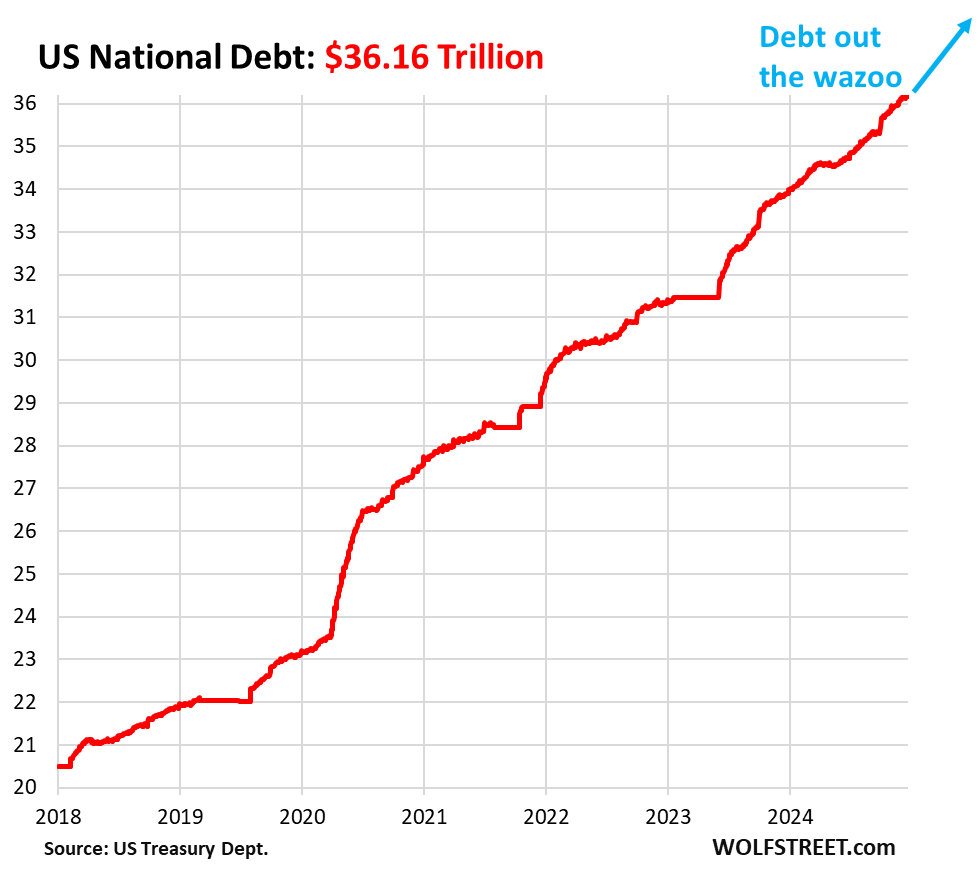
The US national debt keeps ballooning at an amazing rate and has now reached $36.16 trillion. These are Treasury securities that private and public entities in the US and foreign countries hold as interest-earning assets. The question is: Who holds this debt? Who bought it even as the Fed has been unloading its holdings? At the end of Q3, the time frame here, the total debt was $35.46 trillion.

Who held this $35.46 trillion in Treasury securities at the end of Q3?
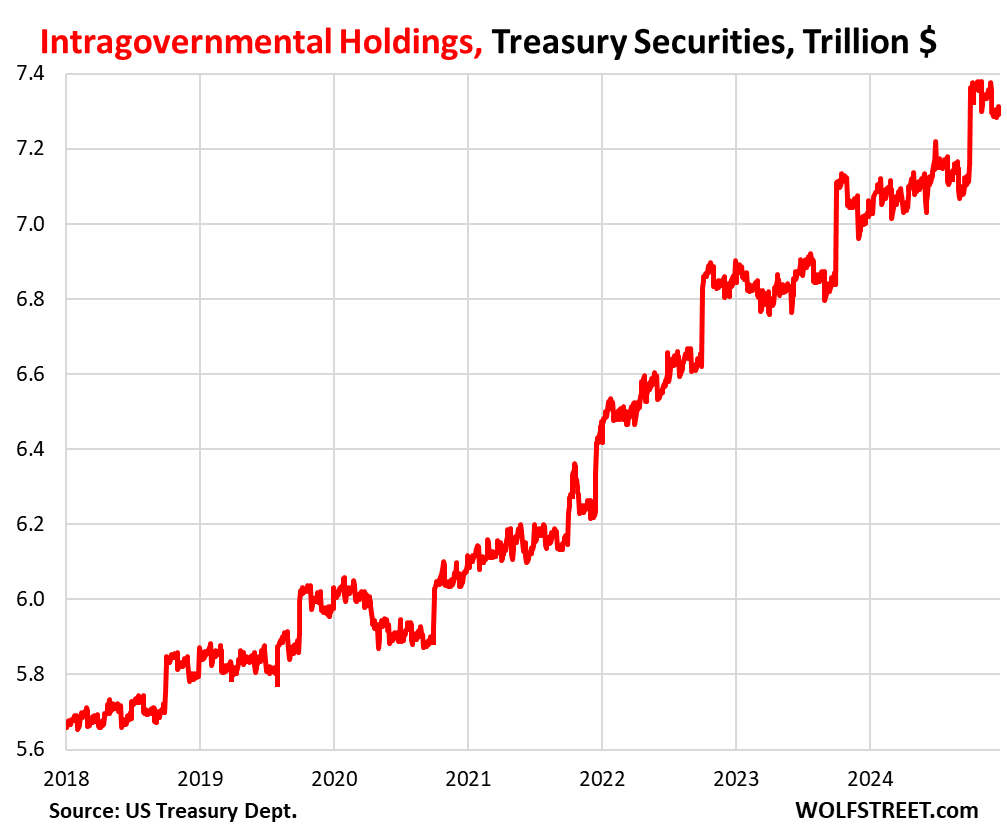
US Government entities: $7.16 trillion. This “debt held internally,” also called “intragovernmental holdings,” consists of Treasury securities held by various federal civilian and military pension funds, the Social Security Trust Fund (we discussed the Social Security Trust Fund holdings, income, and outgo here), the Disability Insurance Trust Fund, the Medicare Trust Funds, and other funds.

The “public” held the remaining $28.31 trillion at the end of Q3. It’s these holdings we’re going to look at in a moment.
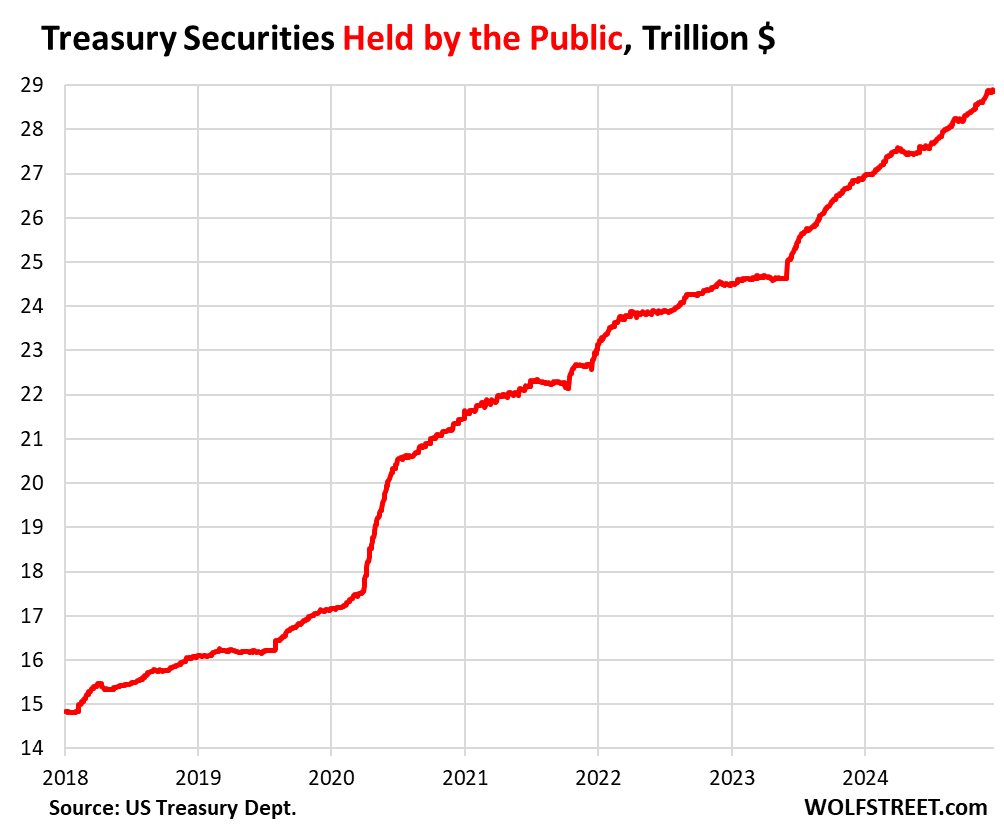

Who is this “public?”
Foreign holders: $8.67 trillion, or 30.6% of the debt held by the public, including foreign private sector holdings and foreign official holdings, such as by central banks, according to Treasury Department data.
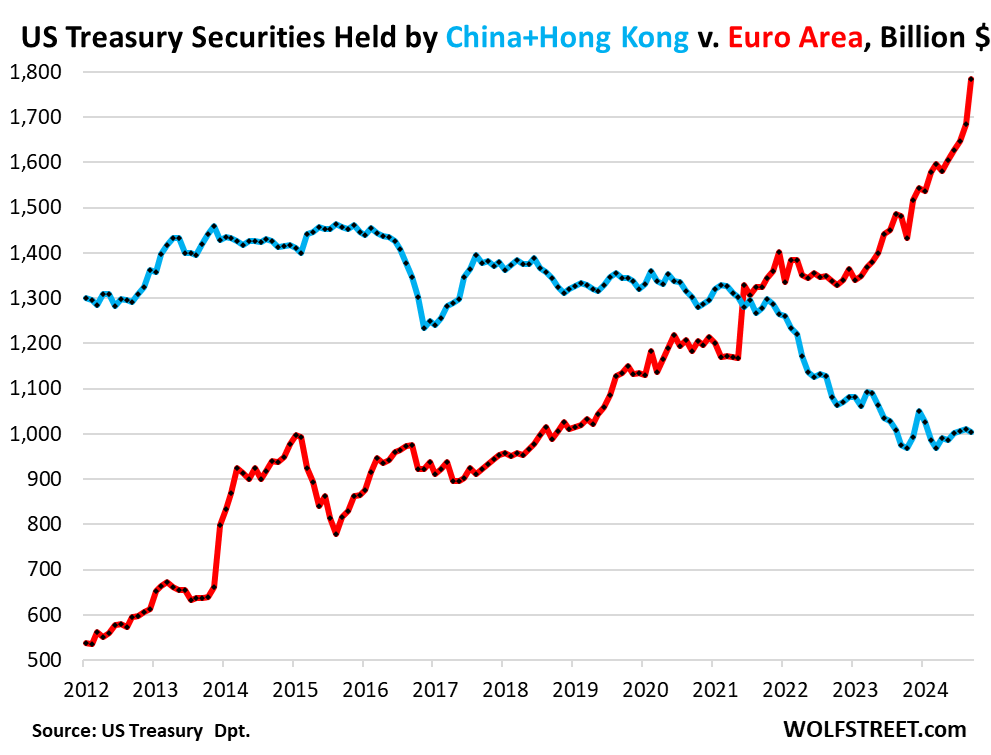
Overall foreign holdings of Treasury securities have continued to rise from record to record. The biggest holders are the top six financial centers ($2.60 trillion), the Euro Area ($1.78 trillion), Japan ($1.12 trillion), China and Hong Kong combined ($1.0 trillion).
Other big holders with rapidly growing holdings include Canada ($370 billion), Taiwan ($288 billion), and India ($247 billion). We discussed the details here:
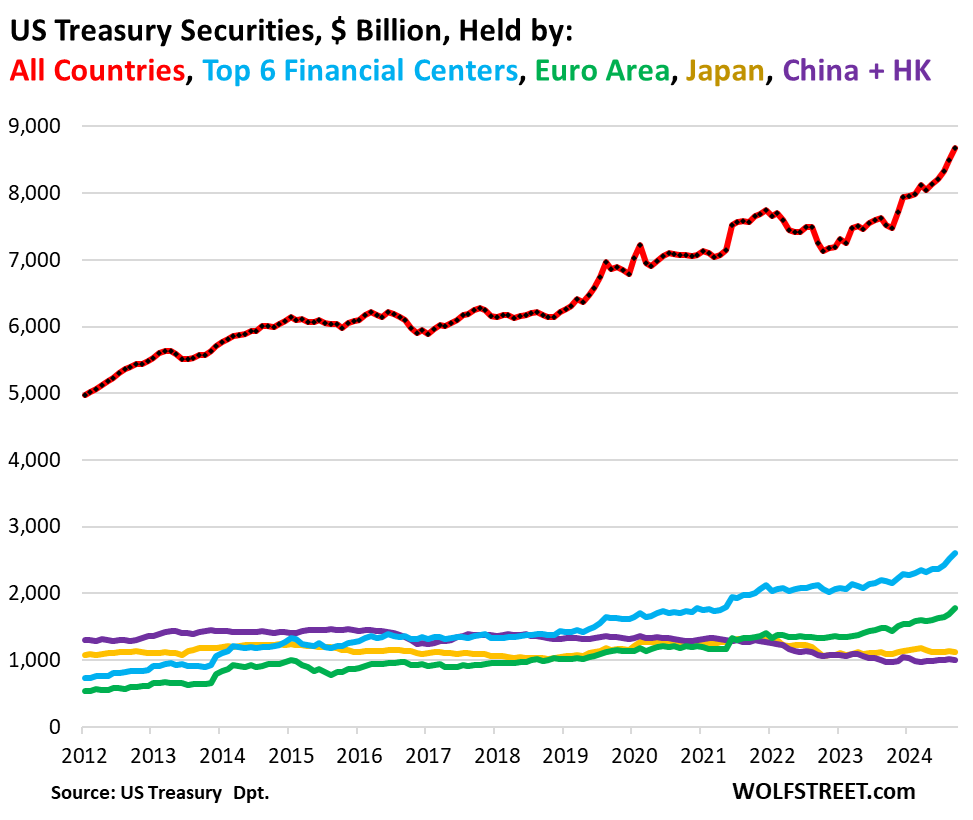

While China has reduced its holdings of Treasury securities, the Euro Area has more than made up for it:

US mutual funds: 17.6% or about $5.0 trillion of the debt held by the public. This includes bond mutual funds, money market mutual funds, according to the Quarterly Fixed Income Report for Q3 from SIFMA (Securities Industry and Financial Markets Association).
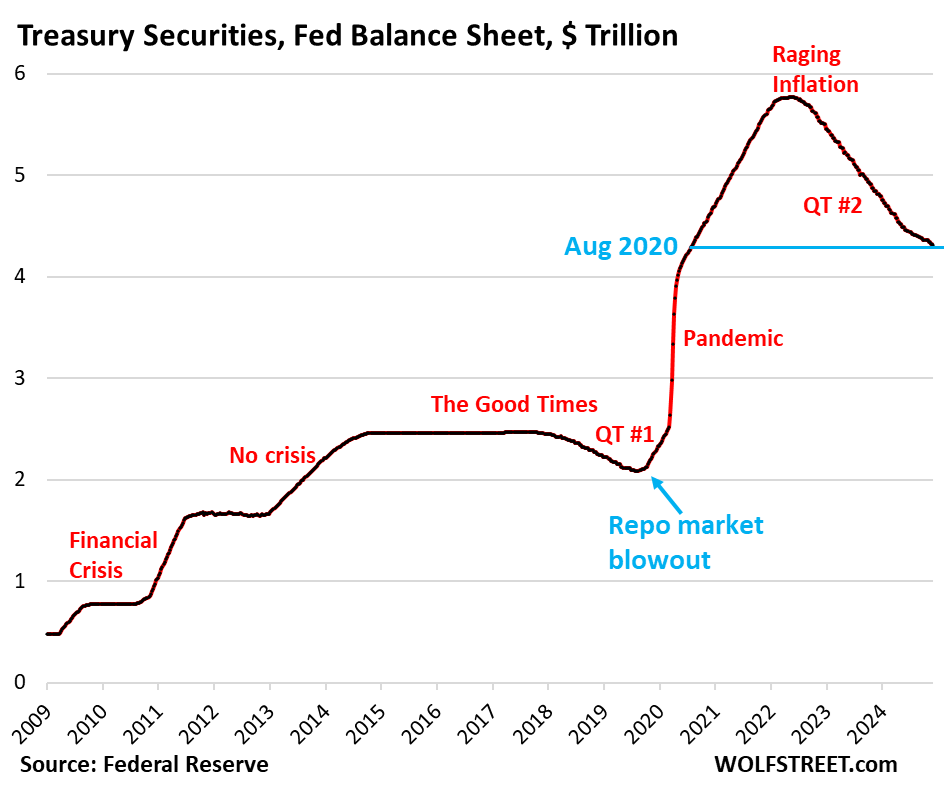
Federal Reserve: 15.4% or $4.36 trillion of the debt held by the public. Under its QT program, the Fed has already shed $1.46 trillion of Treasury securities since the peak in June 2022 (our latest update on the Fed’s balance sheet).

US Individuals: 10.3% or about $3.1 trillion of the debt held by the public, according to quarterly data from SIFMA. These are investors who hold Treasuries in their accounts in the US.
US State and local governments, including in their pension funds: 6.4% or about $1.8 trillion of the debt held by the public, according to SIFMA.
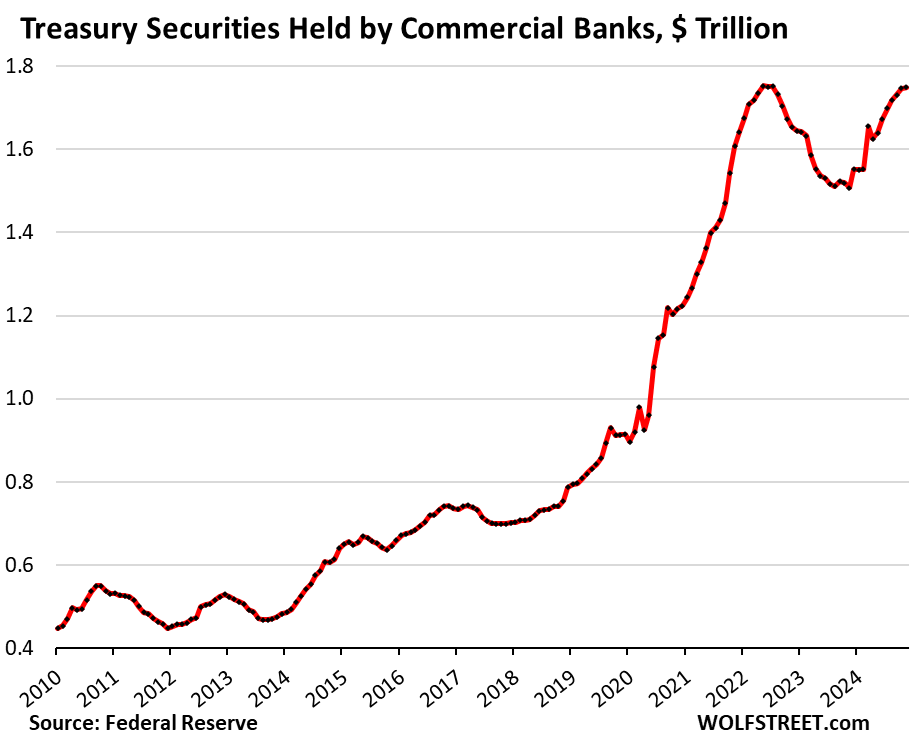
US Commercial Banks: 6.1% or $1.73 trillion of the debt held by the public at the end of November, according to Federal Reserve data about bank balance sheets – back to the record established in May 2022. Banks are re-loving them?

US Private Pension funds: 3.7% or $1.1 trillion of the debt held by the public.
US Insurance companies: 2.3% or $0.63 trillion of the debt held by the public.
Nonmarketable Securities Held by the Public: 2.1% or $0.59 trillion of the debt held by the public, according to Treasury Department data. These securities held by the public cannot be traded in the market and are not purchased at auctions but directly from the government. They include the I series savings bonds and the EE savings bonds, largely held by savers and retail investors. They also include the “State and Local Government Series” that are held by state and local governments, the Government Account series, and other bonds.
“Other”: $0.4 trillion or 1.4% of securities held by the public, according to SIFMA’s report.
The burden of the US national debt: The magnitude and speed of the Interest-Payments-to-Tax-Receipts ratio’s two-year spike is unprecedented in modern US history. It does not look good. Read… Federal Government Interest-Payments-to-Tax-Receipts Ratio Spikes, Debt-to-GDP Worsens Further in Q3.
We give you energy news and help invest in energy projects too, click here to learn more