

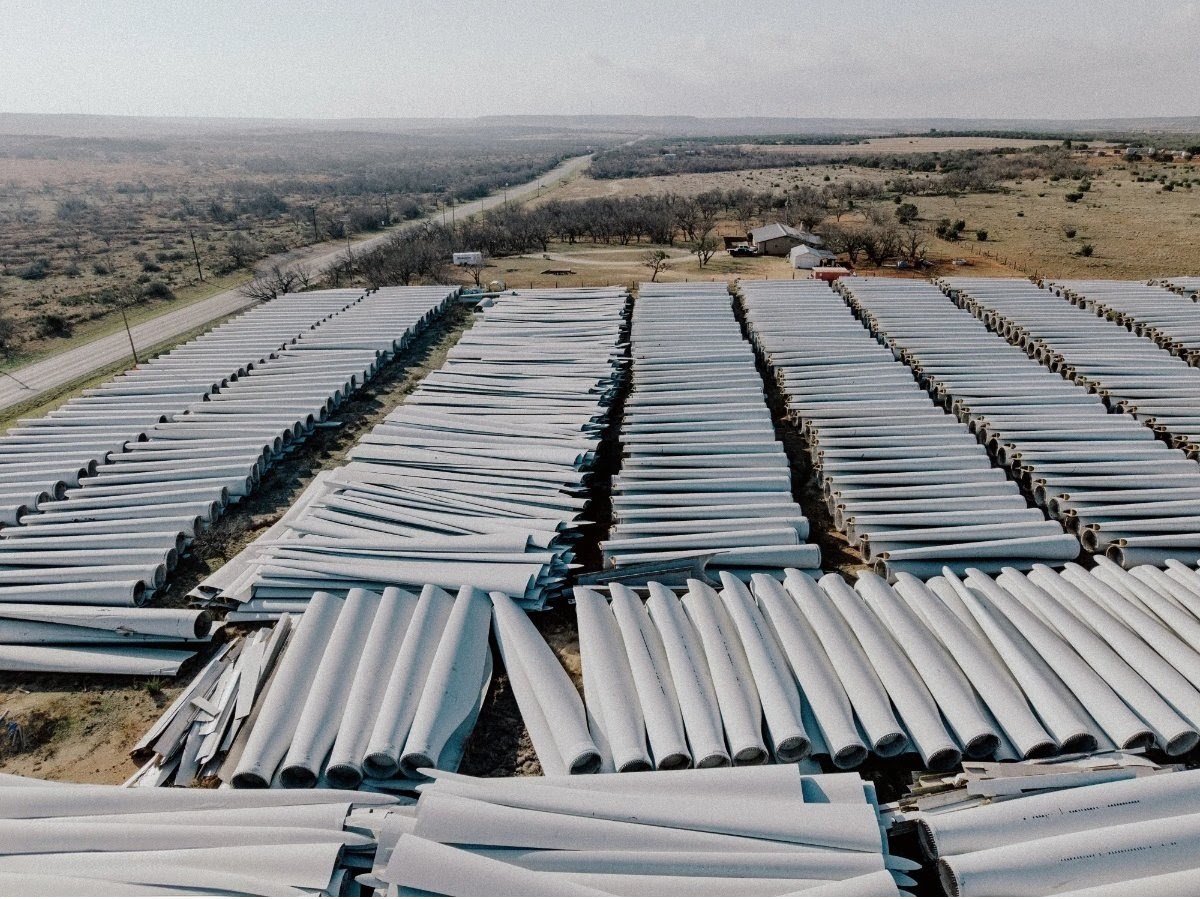
Peter Clack’s widely shared figures on wind-turbine blades don’t match the leading forecasts. End-of-life costs for wind, solar and gas plants look modest once they are spread over a lifetime of output. They become a public bill when the bond is too small or the owner is gone.
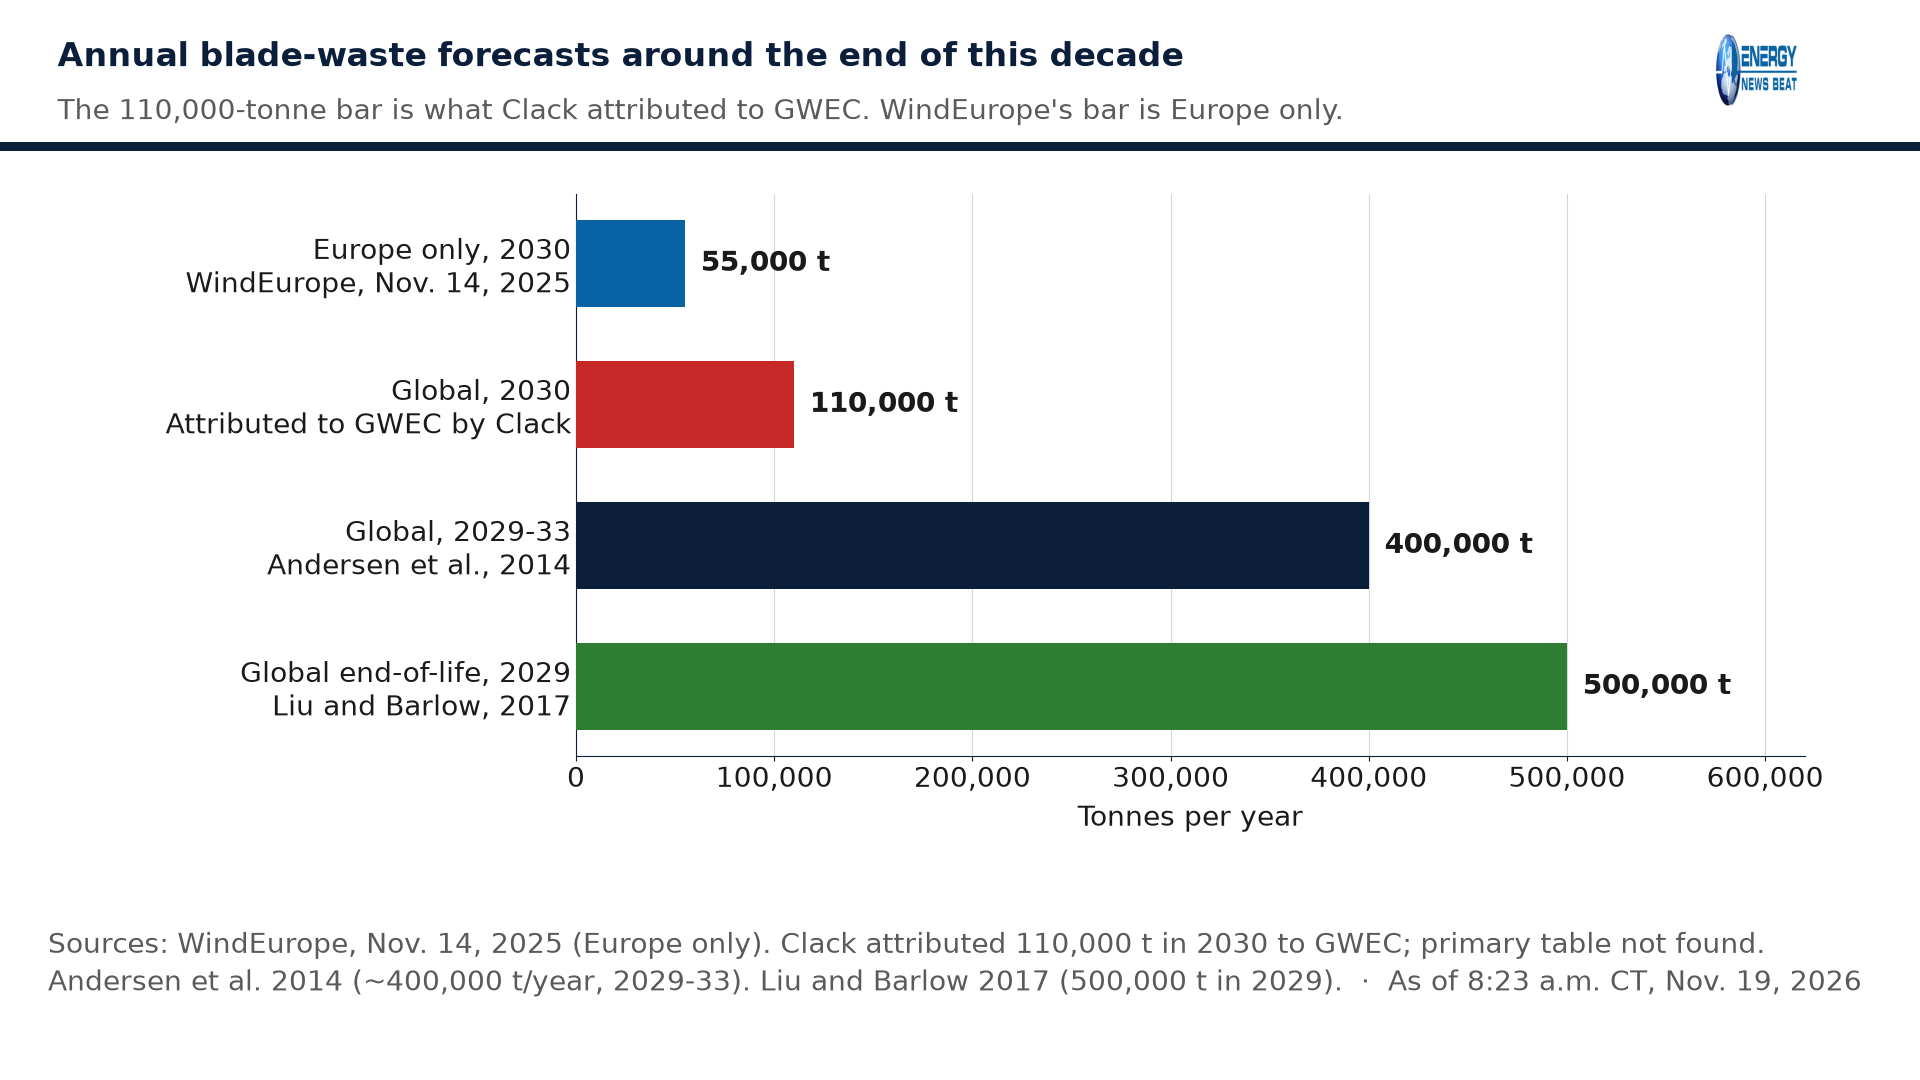
about 500,000 tonnes of end-of-life blade waste a year globally in 2029.
Peter Clack wrote that China, Europe and the United States account for most discarded wind-turbine blades, and that annual global blade waste is moving from roughly 10,000 tonnes in the mid-2020s toward 110,000 tonnes a year by 2030. In the long text, published at 6:36 p.m. Central Time on Nov. 18, he attributed a tenfold jump — “from 10,000 tonnes in 2025 to 110,000 tonnes by 2030” — to the Global Wind Energy Council.
Two of his deployment figures essentially match. GWEC’s Global Wind Day 2026 facts, citing its 2026 Global Wind Report, put installed wind capacity at 1,299 gigawatts by the end of 2025 — just under the 1.3 terawatts he cited — and said 28,395 turbines were installed worldwide that year, next to his “roughly 28,300.”
The waste numbers do not hold up as a global forecast. WindEurope, the European industry group, estimated on Nov. 14, 2025, that decommissioned blade material in Europe alone would rise from about 20,000 tonnes in 2025 to 55,000 tonnes a year by 2030, already more than the 10,000-tonne global starting point Clack attributed to GWEC. A widely cited peer-reviewed global study, Liu and Barlow in Waste Management (2017), projects end-of-life blade waste rising to 500,000 tonnes a year in 2029. That forecast assumes roughly 20-year turbine lives; a 2023 peer-reviewed review found far fewer blades actually retired by 2022 than that implies. ENB could not find that series in a GWEC report it could open.
What the post got right — and what it didn’t
China, Europe and the United States are expected to hold most of the waste. Liu and Barlow’s central case puts cumulative global blade waste at 43.4 million tonnes by 2050, with about 40% in China, 25% in Europe and 16% in the United States. The geographic point holds; the yearly path does not.
Clack is also right that blades are hard to recycle, and that earlier repowering can pull waste forward. He wrote that landfill bans take effect across parts of Europe on Jan. 1, 2026. What WindEurope announced is a self-imposed industry landfill ban on that date; a 2023 review found that many countries, especially in the EU, have outlawed or expect to outlaw landfilling or incineration. A June 22, 2020, French order has required reuse or recycling of at least 35% of dismantled rotor mass since July 1, 2022, and sets a 55% recyclable share for turbines whose complete applications were filed after Jan. 1, 2025. His “up to $2,000 per tonne” recycling cost is his figure; ENB did not find a matching official or peer-reviewed U.S. benchmark.
Blades, panels and batteries are not the same waste stream
Blades are the hard part of a wind turbine, not the whole machine. WindEurope says about 90% of a turbine’s mass can be recycled with established practices. NREL’s Cooperman, Eberle and Lantz estimated that, with a 20-year turbine life, cumulative U.S. blade waste would be about 2.2 million tons by 2050 — roughly 1% of remaining U.S. landfill capacity by volume, or 0.2% by mass. Using EPRI figures, they put cutting at about $25 per U.S. ton, coarse grinding at about $90, and the average tip fee at $55. Blade-only end-of-life costs ran about $19 to $39 per kilowatt.
Solar is a larger mass problem later if deployments stay on a rapid path. IRENA’s 2026 end-of-life report, under its 1.5°C Scenario, projects global cumulative end-of-life solar panels exceeding 12 million tonnes by 2035 and surpassing 200 million tonnes by 2050, with annual volumes exceeding 3 million tonnes by 2035 and 25 million tonnes by 2050. Those are scenario results, not an inventory. Recovered materials, IRENA says, could be worth more than $20 billion by 2050 if the recycling system is built.
Grid batteries are the least standardized piece. U.S. state bonding rules for storage have not been graded the way NCEA graded wind, solar and well rules. The National Center for Energy Analytics October 2025 review of financial assurances set batteries aside, and this article does not treat a single dollar-per-kilowatt-hour recycling quote as settled.
Oil and gas already know this bill
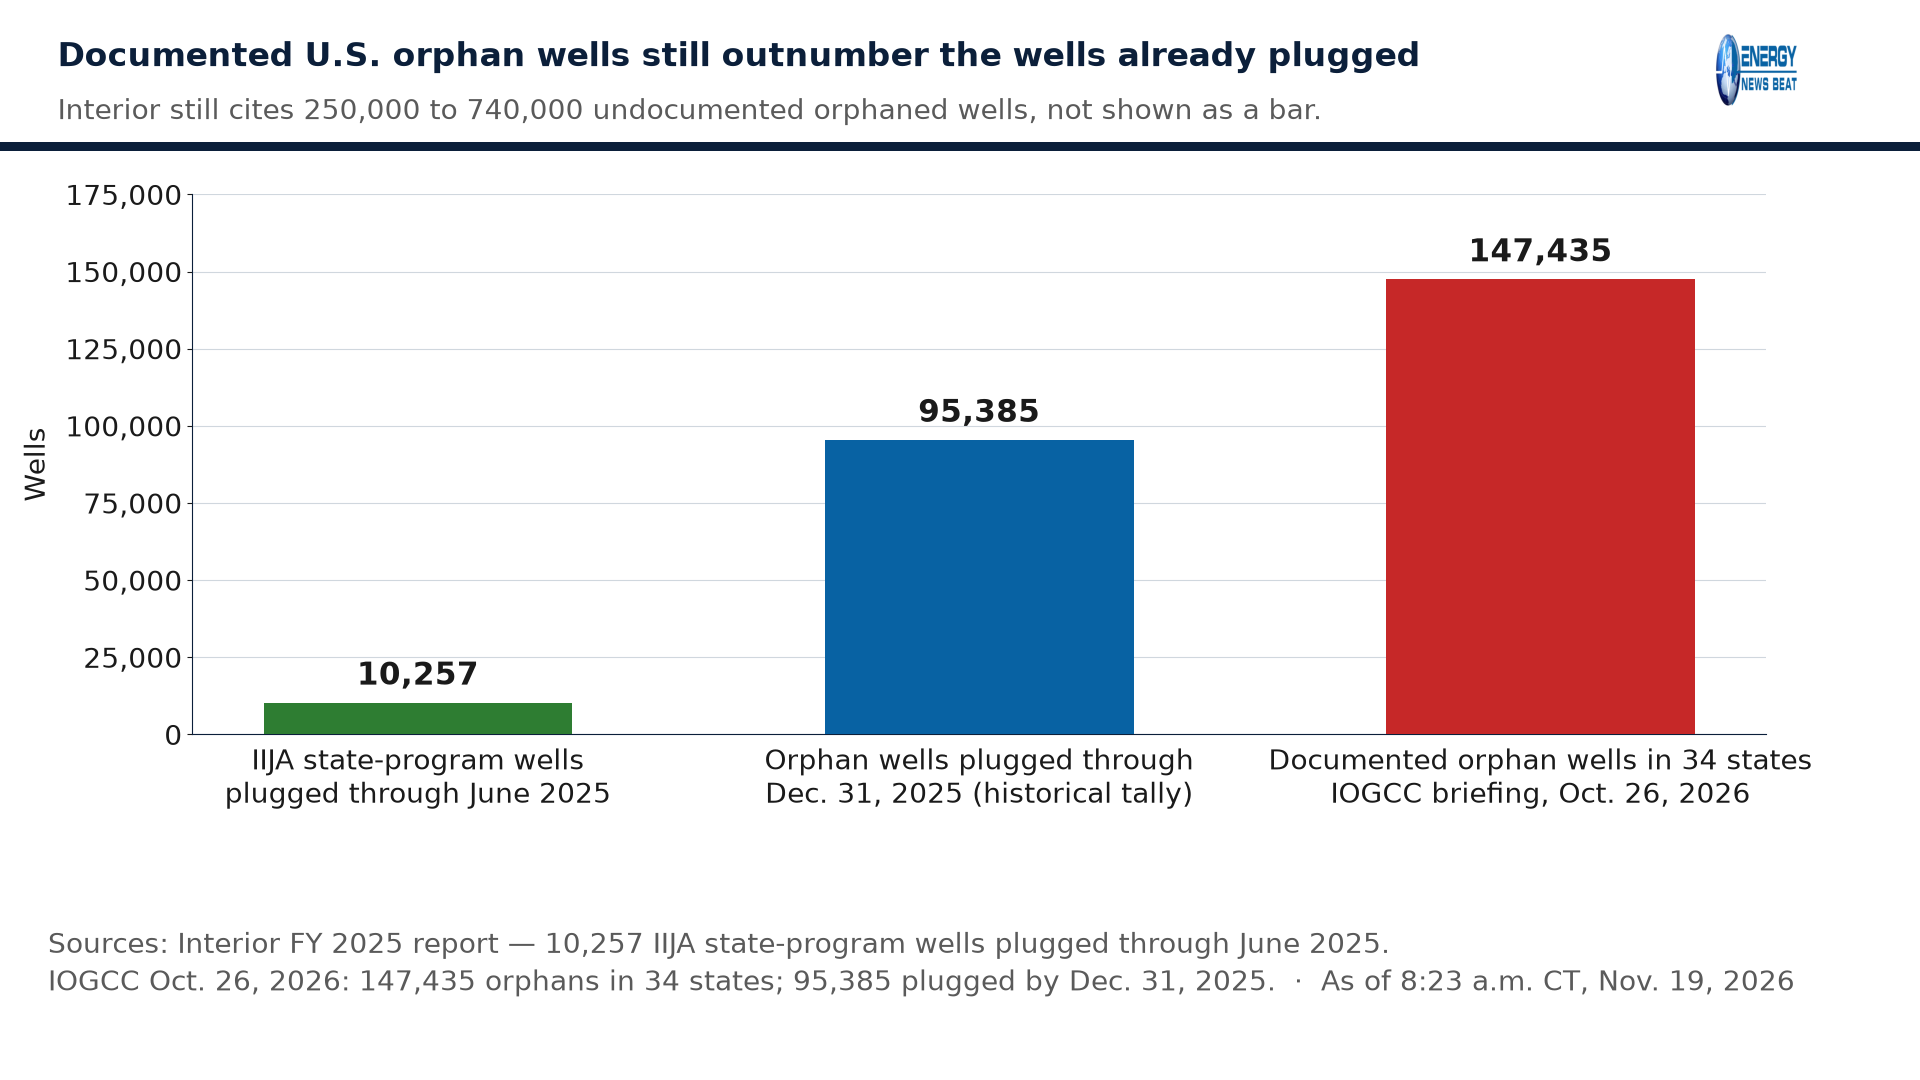
The Infrastructure Investment and Jobs Act set aside $4.677 billion to plug, remediate and restore orphaned wells — $4.275 billion for state and private land, $250 million federal and $150 million Tribal. Interior’s FY 2025 report says the department had distributed about $1.85 billion through Sept. 30, 2025, and that state grant recipients had plugged 10,257 wells through June 2025. The Interstate Oil and Gas Compact Commission, briefing in October 2026, put documented orphan wells in 34 reporting states at 147,435, more than double the 2018 count, and said 95,385 orphan wells had been plugged as of Dec. 31, 2025, a longer historical tally. Interior still cites 250,000 to 740,000 undocumented orphaned wells nationwide.
Carbon Tracker’s 2020 “Billion Dollar Orphans” estimate of about $280 billion was for plugging 2.6 million documented unplugged onshore wells — operating, idle and orphaned — not the current orphan inventory alone. The U.S. Government Accountability Office found in 2019 that 84% of Bureau of Land Management-linked bonds were likely too low to reclaim the wells they covered, with minimums unchanged since the 1950s and 1960s. BLM’s 2024 onshore rule raised minimums to $150,000 per lease and $500,000 statewide, with phase-in dates through 2027. Energy News Beat has written about this gap, including California’s orphan-well problem.
What cleanup costs look like once you divide by the power produced
NCEA, in October 2025, graded state financial-assurance rules for wind and solar a 1.18 GPA, versus 3.40 for oil and gas well rules. Only Virginia received an A for renewables; 30 states received a D or F. NCEA estimates at least $52 billion to decommission existing U.S. wind and solar plants plus those EIA expected to be planned by 2030, with Texas at about $8.8 billion. Those are NCEA’s totals, not an official inventory.
From project filings in that sample, NCEA puts average land-based wind decommissioning at $83,134 per megawatt, in a range of $22,451 to $164,798, and solar at $72,621 per megawatt, in a range of $37,817 to $111,765. Resources for the Future’s 2017 compilation, in 2016 dollars, found natural-gas plants the cheapest to take down on average, at a mean of $15,000 per megawatt across 28 estimates ($1,000 to $50,000). Some of RFF’s solar estimates were negative once salvage was counted.
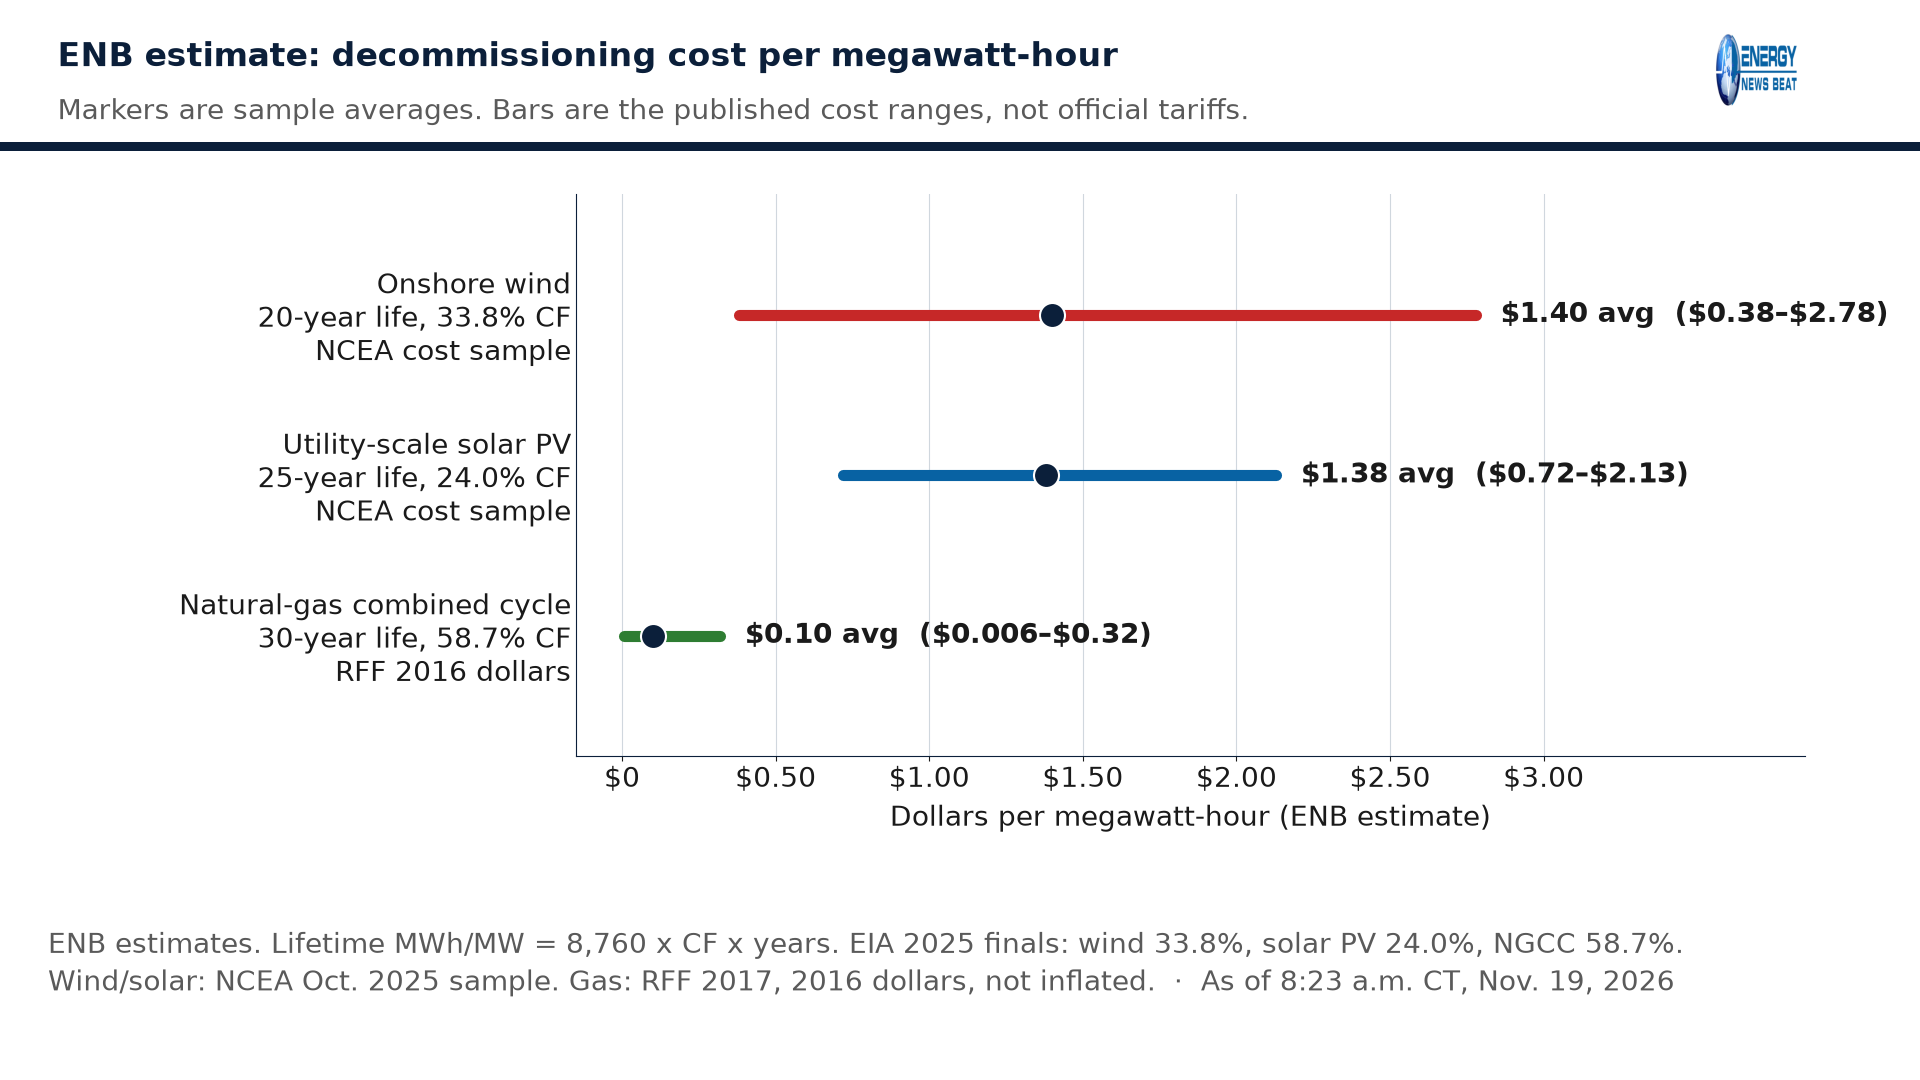
Spread over a working life, those costs are not large on a megawatt-hour basis. Using EIA’s 2025 annual capacity factors — 33.8% for wind, 24.0% for utility-scale solar photovoltaics and 58.7% for natural-gas combined-cycle plants — an Energy News Beat estimate puts NCEA’s average wind cost at about $1.40 per megawatt-hour over 20 years, NCEA’s average solar cost at about $1.38 over 25 years, and RFF’s mean gas-plant cost at about $0.10 over 30 years in 2016 dollars. An Energy News Beat estimate, using 10 to 13.4 tonnes of blade per megawatt and EIA’s 33.8% wind capacity factor over 20 years, puts blade waste at roughly 170 to 230 tonnes per terawatt-hour of wind output. Comparable solar and gas figures are not supportable from these sources. The average kilowatt-hour is not where this bill usually shows up. It shows up if a project is abandoned, a landfill is local, or a well is left unplugged on a family’s land.
Consumer and Investor Views
Curtis Schube, who led NCEA’s review, said in the group’s Oct. 27, 2025, release: “If companies go bankrupt [or] abandon their projects, the responsibility for cleanup ultimately shifts to taxpayers.” WindEurope says rising blade volume means the European industry has to scale up its circularity efforts. Both can be true: the hardware will come down, and someone has to pay to take it apart.
Investors know the oilfield version as an asset-retirement obligation. The lesson from 147,435 documented orphan wells is that a formal rule does not close the gap when bonds are thin. IRENA’s projected materials value is a possible offset, not cash in hand. David Turver’s work on wind repowering, in Energy News Beat’s Whitelee analysis and on the Energy Realities podcast, asks who pays to remove what was there when a site is rebuilt.
A short timeline
2017: Liu and Barlow publish their blade-waste forecast. 2019: GAO finds most BLM well bonds likely too low. 2021: Congress funds orphan-well cleanup. 2024: BLM raises federal bond minimums. 2025: GWEC records 1,299 gigawatts of wind; Interior reports 10,257 state-program plug-outs through June 2025. Jan. 1, 2026: the European industry blade landfill ban takes effect. Oct. 26, 2026: IOGCC briefs 147,435 documented orphan wells. Nov. 18, 2026, 6:36 p.m. Central Time: Clack’s post.
What this article does not claim
It does not claim that wind or solar is dirtier than oil and gas, or treat Liu and Barlow’s 2017 path as a 2026 measurement. ENB’s per-megawatt-hour and blade-waste figures are estimates, not official statistics. RFF’s gas-plant costs are left in 2016 dollars; a BLS CPI-U adjustment would raise the mean to about $0.13 per megawatt-hour. ENB could not verify Clack’s $2,000-a-tonne recycling cost or a primary GWEC table for the 10,000-to-110,000-tonne series, and does not use Carbon Tracker’s $280 billion as the current orphan-well bill. Battery storage is discussed, not given a single cost figure. Clack’s Sweetwater, Texas, photo caption is his; ENB did not independently authenticate the image.
Stu’s Take
Families do not lose sleep over a national average of a dollar or two per megawatt-hour. They lose sleep when blades show up at the county landfill, or when a well on the back forty was never plugged and the company is gone. Peter Clack is right that blades are hard to recycle and that China, Europe and the United States will handle most of them. The 110,000-tonne-by-2030 figure he attributed to the Global Wind Energy Council is lower than WindEurope’s Europe-only path and much lower than the main published global forecasts. That does not make the problem smaller. It means regulators should use the higher, sourced ranges — and they should apply the lesson oilfield states already learned: a bond that looks tidy on a permit is worthless if it will not cover the work. Oil and gas still have more than 147,000 documented orphan wells on the books, even after a multi-billion-dollar federal program. Wind, solar and batteries should not copy that ending.
Like the wind farms in the United States, land reclamation is not included in the upfront planning, and as I wrote this week, Virginia’s offshore wind farm is not even funding their land reclamation project until 15 years into the project, not leaving much time to fund the huge amount required.
We need to look at where we are today. We have lots of wind, solar, and storage on the grid, and what are we going to do with them before the companies go bankrupt is a real question we need to ask. We also need to look at how we need data centers, AI, and clean energy. How we define clean energy needs to be re-defined to include recycling and land reclamation rather than just denying it is a problem. Under today’s technical capabilities wind, solar and storage are not sustainable nor clean energy. With only a fraction of the solar panels, batteries, and wind turbines being recycled it is a farce to call them clean energy. They would not exist without oil, gas, and coal.
Sources
Links were opened or documents downloaded on Nov. 19, 2026. Access dates below are that day unless a document carries its own date. Selected excerpts are not a substitute for the full records. Derived per-megawatt-hour and blade-waste-per-terawatt-hour figures are Energy News Beat estimates and are labeled as such in the methodology section.
- Peter Clack, X post 2123213899222884544, created 2026-11-19T00:36:55.000Z (6:36 p.m. Central Time, Nov. 18, 2026). Full long-post text retrieved the morning of Nov. 19, 2026. https://x.com/PeterDClack/status/2123213899222884544
- Global Wind Energy Council, “Global Wind Day 2026: Fast Facts about Wind,” June 15, 2026. Cites the 2026 Global Wind Report for 1,299 GW of installed capacity at end-2025, 28,395 turbines installed in 2025, and 165 GW of new capacity. https://www.gwec.net/news/globalwindday-2026
- Global Wind Energy Council, Global Wind Report landing page (2026 report). https://www.gwec.net/reports/globalwindreport
- WindEurope, “Where do wind turbine blades go when they are decommissioned?,” Nov. 14, 2025. Europe: about 20,000 tonnes of decommissioned blade material in 2025, 55,000 tonnes a year by 2030; self-imposed industry landfill ban effective Jan. 1, 2026; about 90% of turbine mass recyclable. https://windeurope.org/news/where-do-wind-turbine-blades-go-when-they-are-decommissioned/
- WindEurope, “No blade left behind: the wind sector’s commitment to sustainable blade solutions.” Europe: over 50 kilotonnes of end-of-life blade waste by 2030; about 14,000 blades; 40,000–60,000 tonnes. https://windeurope.org/news/no-blade-left-behind-the-wind-sectors-commitment-to-sustainable-blade-solutions/
- Pu Liu and Claire Y. Barlow, “Wind turbine blade waste in 2050,” Waste Management, 2017. Open Cambridge copy used. Central case: 43.4 million tonnes cumulative by 2050; end-of-life waste 500,000 tonnes a year in 2029; regional shares in the published abstract and Figure 11: China 40%, Europe 25%, United States 16%, rest of the world 19%. https://doi.org/10.1016/j.wasman.2017.02.007
- Cambridge University repository copy of Liu and Barlow (2017). https://www.repository.cam.ac.uk/items/11ddf6dd-5682-467b-95a5-f3c25338c6a8
- Aubryn Cooperman, Annika Eberle, and Eric Lantz, “Wind Turbine Blade Material in the United States: Quantities, Costs, and End-of-Life Options,” NREL / Resources, Conservation & Recycling, 2021. OSTI accepted manuscript. Cumulative U.S. blade waste about 2.2 million tons by 2050 at a 20-year life; ~1% of remaining landfill capacity by volume, 0.2% by mass; blade-only EOL costs about $19–$39/kW; EPRI-based cutting $25/U.S. ton, grinding $90/U.S. ton; national average tip fee $55/U.S. ton. https://www.osti.gov/servlets/purl/1765605
- IRENA, “End-of-life management for a circular economy: Solar PV panels,” 2026. 1.5°C Scenario: cumulative end-of-life panels exceeding 12 Mt by 2035 and 200 Mt by 2050; annual volumes exceeding 3 Mt by 2035 and 25 Mt by 2050; recovered-materials value could exceed USD 20 billion by 2050. Official PDF (the HTML landing page returns 403). https://www.irena.org/-/media/Files/IRENA/Agency/Publication/2026/Jul/IRENA_POL_End-of-life_solar_PV_2026.pdf
- U.S. Department of the Interior, Orphaned Wells Program FY 2025 Annual Report. IIJA $4.677 billion ($4.275 billion state, $250 million federal, $150 million Tribal); about $1.85 billion distributed through Sept. 30, 2025; 10,257 wells plugged through June 2025 by state Initial and Formula Grant recipients; 250,000–740,000 undocumented orphaned wells cited from IOGCC. https://www.doi.gov/sites/default/files/documents/2025-11/fy-2025-orphaned-wells-congressional-report.pdf
- Interstate Oil and Gas Compact Commission, “Idle and Orphan Oil and Gas Wells: State and Provincial Regulatory Strategies 2026,” briefing dated Monday, Oct. 26, 2026. Documented orphan wells in 34 reporting states: 147,435 (+136.7% since 2018); 95,385 orphan wells plugged as of Dec. 31, 2025. IOGCC 2026 briefing (PDF).
- U.S. Government Accountability Office, GAO-19-615, “Oil and Gas: Bureau of Land Management Should Address Risks from Insufficient Bonds to Reclaim Wells,” 2019. 84% of BLM-linked bonds likely too low; minimums not adjusted since the 1950s and 1960s. https://www.gao.gov/products/gao-19-615
- Bureau of Land Management press release on the 2024 onshore oil and gas leasing rule, including new bond minimums. https://www.blm.gov/press-release/blm-ensures-fair-taxpayer-return-strengthens-accountability-oil-and-gas-operations
- 43 CFR 3104.1, current electronic Code of Federal Regulations. Minimum bond amounts: $150,000 per individual lease and $500,000 statewide, following the 2024 rule. https://www.ecfr.gov/current/title-43/subtitle-B/chapter-II/subchapter-C/part-3100/subpart-3104/section-3104.1
- Carbon Tracker Initiative, “Billion Dollar Orphans,” 2020. About $280 billion to plug 2.6 million documented unplugged onshore U.S. wells (operating, idle and orphaned), excluding an estimated 1.2 million undocumented wells. https://carbontracker.org/reports/billion-dollar-orphans/
- National Center for Energy Analytics / Curtis Schube and Mark P. Mills, “Who Pays When Wind Turbines and Solar Panels Wear Out? A Hidden Energy Liability,” Oct. 28, 2025 (release dated Oct. 27, 2025). https://energyanalytics.org/research/hidden-energy-liability
- Curtis Schube and Mark P. Mills, “A State-by-State Assessment of Financial Assurances Required for Decommissioning Wind and Solar Facilities,” NCEA. Wind sample average $83,134/MW (range $22,451–$164,798); solar average $72,621/MW (range $37,817–$111,765); at least $52 billion estimated liability including EIA-planned capacity through 2030; Texas about $8.791 billion; GPA 1.18 vs. 3.40 for oil and gas well rules. https://energyanalytics.org/research/state-decommissioning-financial-assurance
- NCEA press release, “New Analysis Warns of Hidden $50 Billion Liability…,” Oct. 27, 2025, including the Schube quote used in the body. https://energyanalytics.org/press-releases/new-analysis-warns-of-hidden-50-billion-liability-as-wind-and-solar-projects-age-without-decommissioning-safeguards
- Daniel Raimi, Resources for the Future, “Decommissioning US Power Plants: Decisions, Costs, and Key Issues,” 2017. Table 1, 2016 dollars, thousands per MW: gas (various types), 28 estimates, minimum $1, mean $15, maximum $50 — i.e., $1,000 / $15,000 / $50,000 per MW. https://media.rff.org/documents/RFF20Rpt20Decommissioning20Power20Plants.pdf
- U.S. Energy Information Administration, Electric Power Monthly, Table 6.07.B, data for August 2026, released Oct. 23, 2026. 2025 annual capacity factors (final): wind 33.8%, utility-scale solar photovoltaic 24.0%. https://www.eia.gov/electricity/monthly/epm_table_grapher.php?t=epmt_6_07_b
- U.S. Energy Information Administration, Electric Power Monthly, Table 6.07.A, same release. 2025 annual capacity factor (final): natural-gas combined cycle 58.7%. https://www.eia.gov/electricity/monthly/epm_table_grapher.php?t=table_6_07_a
- Energy News Beat, “Bigger Wind Turbines, Harder Questions: Who Pays to Repower?,” Nov. 8, 2026. URL resolved with HTTP 200 on Nov. 19, 2026. https://energynewsbeat.co/enb-publisher-picks/bigger-wind-turbines-harder-questions-who-pays-to-repower/
- Energy News Beat, “Energy Realities with Dr. Tammy Nemeth, David Turver and Stu Turley.” URL resolved with HTTP 200 on Nov. 19, 2026. https://energynewsbeat.co/electrical-generation/energy-realities-with-dr-tammy-nemeth-david-turver-and-stu-turley/
- Energy News Beat, “CA Has An Orphan well problem.” URL resolved with HTTP 200 on Nov. 19, 2026. https://energynewsbeat.co/energy-news-beat-publishers-note/ca-has-an-orphan-well-problem/
- Energy News Beat, “Scottish Wind Farm Claims Victory with 26 Wind Turbines Being Mostly Recycled.” URL resolved with HTTP 200 on Nov. 19, 2026. Linked as related reading; not a source for a body statistic. https://energynewsbeat.co/electrical-generation/scottish-wind-farm-claims-victory-with-26-wind-turbines-being-mostly-recycled/
- Arrêté du 22 juin 2020 (authorization regime), Legifrance. Reuse or recycling of at least 35% of dismantled rotor mass required since July 1, 2022; 55% recyclable-design share for turbines whose complete authorization applications were filed after Jan. 1, 2025, or that were commissioned after that date in a substantial modification. https://www.legifrance.gouv.fr/jorf/id/JORFTEXT000042056014
- Per Dannemand Andersen, Alexandra Bonou, Justine Beauson and Povl Brøndsted, “Recycling of wind turbines,” Chapter 13 in DTU International Energy Report 2014 (pp. 91–97), Table 10, “Rough global estimates of recycled masses of key wind turbine components in the future”: about 400,000 tonnes a year of blade material in 2029–33. Primary PDF, also cited by Liu and Barlow and by Cooperman. https://backend.orbit.dtu.dk/ws/files/102458629/DTU_INTL_ENERGY_REP_2014_WIND_91_97.pdf
- Emma L. Delaney and colleagues, “Sustainability Implications of Current Approaches to End-of-Life of Wind Turbine Blades—A Review,” Sustainability 15(16):12557, 2023. About 1.9 million tonnes of blade material in 2028–2032 (about 380,000 tonnes a year); 55,765 blades known decommissioned by 2022 versus 167,793 implied by a 20-year life; “China contributes to around 40% of the total EOL blade material” in an 8.6 million-tonne 2042 total, “followed by the EU at 24%, the US with 18% and the remaining 19% from the rest of the world.” Delaney also notes that many countries, especially in the EU, have outlawed or expect to outlaw landfilling or incineration, and that predictions “can vary by orders of magnitude.” https://www.mdpi.com/2071-1050/15/16/12557
- GEP ECOTECH / aishred.com, “Wind Blade Recycling: The Work Starts Before the Chemistry,” Oct. 13, 2026. Repeats “GWEC expects annual blade waste to rise from about 10,000 tonnes in 2025 to around 110,000 tonnes by 2030” and “8.6 million tonnes by 2042, with China alone responsible for about 40%,” without a report page. Used only to show the figures circulating as a GWEC attribution; not treated as a primary source. https://www.aishred.com/release/wind-blade-recycling-the-work-starts-before-the-chemistry.html
Key excerpts
Peter Clack, long text of X post 2123213899222884544, Nov. 18, 2026, 6:36 p.m. Central Time. “The Global Wind Energy Council says annual global blade waste will jump tenfold in the next five years — from 10,000 tonnes in 2025 to 110,000 tonnes by 2030.” The same post says annual global blade waste is “moving from roughly 10,000 tonnes in the mid-2020s toward 110,000 tonnes a year by 2030,” cites capacity “surpassing 1.3 terawatts globally,” and says “Roughly 28,300 new wind turbines were installed worldwide in 2025 alone.”
GWEC, Global Wind Day 2026 facts, June 15, 2026. “Wind power made up 9.5% of the global electricity mix in 2025, with wind installed capacity reaching 1,299 gigawatts by end-2025.” “In 2025, nearly 30,000 wind turbines (28,395) were installed worldwide.” “This led to a record-breaking 165 gigawatts of new wind power capacity being added to electricity grids in 2025.”
WindEurope, Nov. 14, 2025. “The European wind industry has committed to a self-imposed landfill ban for wind turbine blades effective as of 1 January 2026.” “WindEurope estimates that the annual volume of decommissioned blade material will increase to 55,000 tonnes a year by 2030. This increase from around 20,000 tonnes in 2025, is mostly driven by decommissioning in established wind energy markets like Germany and Spain.” “Around 90% of a wind turbine’s mass is recyclable using established waste management practices.”
Liu and Barlow, Waste Management, 2017. “It increases sharply to 500 kt per year in 2029, overtaking the sum of all the other waste sources to form the largest waste source at that time. This end-of-life waste stream will annually generate more than 2 Mt blade waste in 2050.” Published abstract: “The research indicates that there will be 43 million tonnes of blade waste worldwide by 2050 with China possessing 40% of the waste, Europe 25%, the United States 16% and the rest of the world 19%.” Figure 11 matches those shares. The 19% U.S. figure in some accepted-manuscript copies is not the published abstract.
Cooperman, Eberle and Lantz, NREL, 2021. “Assuming a 20-year turbine lifetime, the cumulative blade waste in 2050 is approximately 2.2 million tons. This value represents approximately 1% of remaining landfill capacity by volume, or 0.2% by mass.” “One option is to cut the blades into segments of no more than 30 m in length, at a cost of $25/ton [$27.56/metric ton] (EPRI 2020).” “The other option is to coarsely grind the blades … for an estimated cost of $90/ton [$99.21/metric ton] (EPRI 2020).” “The national average landfill tip fee of $55/U.S. ton ($60.63/metric ton).” “the range of EOL costs is between $19 and $39/kW.”
Interior, Orphaned Wells Program FY 2025 Annual Report. “Section 40601 of the IIJA provides $4.677 billion … Federal Program – $250 million … State Program – $4.275 billion … Tribal Program – $150 million.” “From the passage of the IIJA through the end of FY 2025, the OWPO distributed approximately $1.85 billion.” “state grant recipients have successfully plugged 10,257 wells across the country.” The report’s p.8 callout states “10,257 wells plugged through June 2025 through State funds,” with a legend for wells plugged through Quarter 3 of Fiscal Year 2025. “The IOGCC reports over 141,000 documented orphaned wells on state and private land and estimates an additional 250,000-740,000 undocumented orphaned wells nationwide.”
IOGCC briefing, Oct. 26, 2026. Slide text: “Documented orphan wells have more than doubled since 2018” and “+136.7% to 147,435” for 34 reporting states. “95,385 Total orphan well plugged as of Dec 31, 2025.” The full 2026 written report is described as forthcoming in November 2026.
NCEA press release, Oct. 27, 2025. Curtis Schube: “If companies go bankrupt abandon their projects, the responsibility for cleanup ultimately shifts to taxpayers.” (The article inserts “[or]” for readability; the release text as fetched is missing a conjunction between “bankrupt” and “abandon.”) The issue brief and full report estimate at least $52 billion in decommissioning costs for existing wind and solar plus EIA-planned development by 2030, and grade renewable financial-assurance rules a 1.18 GPA versus 3.40 for oil and gas well rules.
RFF, 2017, Table 1. Decommissioning cost estimates per megawatt of capacity, 2016$ (thousands): Gas (various types), 28 estimates, minimum $1, mean $15, maximum $50. Onshore wind, 18 estimates, minimum $2, mean $51, maximum $222. Solar photovoltaic, 22 estimates, minimum –$89, mean $57, maximum $179. “Negative cost estimates indicate that the salvage value of plant materials exceeds decommissioning costs.”
Data tables
Blade-waste forecasts used in the article
| Source | Geography | Year or window | Annual blade waste | What it counts |
| WindEurope, Nov. 14, 2025 | Europe | 2025 | About 20,000 tonnes | Decommissioned blade material |
| WindEurope, Nov. 14, 2025 | Europe | 2030 | 55,000 tonnes a year | Decommissioned blade material |
| Clack, attributing the figure to GWEC, Nov. 18, 2026 | Global | 2025 | 10,000 tonnes | Annual blade waste; primary GWEC table not found |
| Clack, attributing the figure to GWEC, Nov. 18, 2026 | Global | 2030 | 110,000 tonnes a year | Annual blade waste; primary GWEC table not found |
| Andersen et al., 2014, DTU International Energy Report, Table 10 | Global | 2029–2033 | About 400,000 tonnes a year | Blade material to be recycled |
| Liu and Barlow, 2017, central case | Global | 2029 | 500,000 tonnes a year | End-of-life blade waste |
| Delaney et al., 2023 | Global | 2028–2032 | About 380,000 tonnes a year (1.9 million tonnes over the five years) | EOL blade material; 20-year life |
| Liu and Barlow, 2017, central case | Global | 2050, cumulative | 43.4 million tonnes | Lifecycle blade waste inventory |
| Cooperman et al., NREL, 2021 | United States | 2050, cumulative | About 2.2 million tons | End-of-life blades, 20-year life |
Figures are as published by each source. The Clack/GWEC row is an attribution ENB could not confirm in a primary GWEC table. WindEurope is Europe only. Liu and Barlow, Andersen and Delaney are global.
Orphan-well counts and program funding
| Item | Figure | As-of / notes | Source |
| IIJA total appropriation, Sec. 40601 | $4.677 billion | Law signed Nov. 15, 2021 | Interior FY 2025 report |
| State program | $4.275 billion ($4.1 billion after admin./OIG) | Same | Interior FY 2025 report |
| Federal / Tribal programs | $250 million / $150 million | Same | Interior FY 2025 report |
| Distributed through FY 2025 | About $1.85 billion | Through Sept. 30, 2025; $554.8 million in FY 2025 | Interior FY 2025 report |
| State-program wells plugged (IIJA) | 10,257 | Through June 2025; Initial and Formula Grants | Interior FY 2025 report |
| Documented orphan wells, reporting states | 147,435 | 34 states; +136.7% since 2018 | IOGCC briefing, Oct. 26, 2026 |
| Orphan wells plugged, historical tally | 95,385 | As of Dec. 31, 2025; not limited to IIJA | IOGCC briefing, Oct. 26, 2026 |
| Undocumented orphaned wells, nationwide estimate | 250,000–740,000 | Cited by Interior from IOGCC | Interior FY 2025 report |
| Carbon Tracker unplugged-well liability | About $280 billion for 2.6 million documented unplugged onshore wells | 2020; includes operating, idle and orphaned wells, not current orphans only | Carbon Tracker, 2020 |
| BLM minimum bonds after 2024 rule | $150,000 per lease; $500,000 statewide | Effective June 22, 2024; phase-in through 2027 | 43 CFR 3104.1; BLM |
IIJA plugged-well counts are program-specific. The IOGCC historical plugged tally is broader. Undocumented wells are a range, not a bar in Chart 2.
Decommissioning costs used in the ENB per-megawatt-hour estimates
| Technology | Cost source | Cost range per MW | Average / mean | Life and 2025 CF | ENB $/MWh (range / average) |
| Onshore wind | NCEA sample, 2025 | $22,451–$164,798 | $83,134 | 20 years; 33.8% | $0.38–$2.78 / $1.40 |
| Utility-scale solar PV | NCEA sample, 2025 | $37,817–$111,765 | $72,621 | 25 years; 24.0% | $0.72–$2.13 / $1.38 |
| Natural-gas combined cycle | RFF 2017, 2016$ | $1,000–$50,000 | $15,000 | 30 years; 58.7% | $0.006–$0.32 / $0.10 |
NCEA figures are from a sample of project filings in its October 2025 report. RFF figures are a 2017 compilation in 2016 dollars and were not inflated. Capacity factors are EIA 2025 annual finals.
EIA 2025 annual capacity factors used
| Technology | Table | 2025 capacity factor | 2024 capacity factor (for context only) |
| Wind | 6.07.B | 33.8% | 34.3% |
| Utility-scale solar photovoltaic | 6.07.B | 24.0% | 23.2% |
| Natural-gas combined cycle | 6.07.A | 58.7% | 60.5% |
Electric Power Monthly, data for August 2026, released Oct. 23, 2026. Values for 2025 are final.
A longer timeline
- Andersen and colleagues project about 400,000 tonnes a year of blade material to be recycled between 2029 and 2033, as later cited by Liu and Barlow and by Cooperman.
February 2017. Liu and Barlow publish “Wind turbine blade waste in 2050” in Waste Management. Central case: 43.4 million tonnes cumulative by 2050; end-of-life waste 500,000 tonnes a year in 2029.
- Resources for the Future publishes its compilation of U.S. power-plant decommissioning costs, in 2016 dollars.
- GAO-19-615 finds that 84% of BLM-linked oil and gas bonds are likely too low to reclaim the wells they cover.
- Carbon Tracker publishes Billion Dollar Orphans, putting about $280 billion on plugging 2.6 million documented unplugged onshore wells. France issues the June 22, 2020, order that requires reuse or recycling of at least 35% of dismantled rotor mass from July 1, 2022, and a 55% recyclable share for turbines whose complete authorization applications were filed after Jan. 1, 2025.
November 15, 2021. The Infrastructure Investment and Jobs Act, Section 40601, appropriates $4.677 billion for orphaned-well plugging, remediation and restoration.
- NREL’s Cooperman, Eberle and Lantz paper estimates about 2.2 million tons of cumulative U.S. blade waste by 2050 at a 20-year life.
- Delaney et al. publish a peer-reviewed review in Sustainability finding about 1.9 million tonnes of blade material in 2028–2032 and far fewer blades actually retired by 2022 than a 20-year life implied.
June 22, 2024. BLM’s revised onshore oil and gas bonding minimums ($150,000 per lease, $500,000 statewide) take effect, with later phase-in dates through 2027.
June 2025. Interior’s FY 2025 report: 10,257 wells plugged through June 2025 by state IIJA Initial and Formula Grant recipients (through Quarter 3 of Fiscal Year 2025).
Sept. 30, 2025. Interior’s FY 2025 report cutoff: about $1.85 billion distributed through the end of the fiscal year.
October 27–28, 2025. NCEA publishes its state-by-state financial-assurance grades and the $52 billion decommissioning-cost estimate.
Nov. 14, 2025. WindEurope estimates European decommissioned blade material at about 20,000 tonnes in 2025 and 55,000 tonnes a year by 2030, and restates the Jan. 1, 2026, industry landfill ban.
Dec. 31, 2025. IOGCC historical tally: 95,385 orphan wells plugged.
Jan. 1, 2026. European industry self-imposed landfill ban for wind-turbine blades takes effect.
June 15, 2026. GWEC’s Global Wind Day facts, citing the 2026 Global Wind Report, record 1,299 GW of installed wind capacity at end-2025 and 28,395 turbines installed in 2025.
Oct. 26, 2026. IOGCC briefing puts documented orphan wells in 34 reporting states at 147,435.
Nov. 8, 2026. Energy News Beat publishes its Whitelee / David Turver repowering analysis.
Nov. 18, 2026, 6:36 p.m. Central Time. Peter Clack publishes the post that is the lead of this article.
Nov. 19, 2026. This article’s as-of stamp.
Background
Wind-turbine blades are fiber-reinforced thermoset composites. Steel towers, hubs and much of the nacelle can be sold as scrap with established processes. The blades are the part that is usually landfilled, co-processed in cement kilns, or sent to still-limited recycling lines. That is why public debate often treats “blade waste” as if it were the whole machine. It is not. It is the hard fraction.
Solar panels are mostly glass, aluminum and a smaller mass of silicon, copper and silver. IRENA’s 2026 volumes are tied to its 1.5°C Scenario, which assumes a very large further build-out. They are not a count of panels already waiting in yards. Recovered-material value is a potential offset, not a guaranteed net salvage price in every market.
Battery energy storage is growing quickly, and end-of-life costs depend on chemistry, transport, and metal prices. NCEA’s 2025 bonding review set storage aside. This article therefore discusses batteries as a gap in the public bonding record rather than assigning a single official cost.
Oil and gas well plugging is the mature comparison, not a clean success story. Most oil-producing states have formal financial-assurance rules, and NCEA grades those rules far higher than wind and solar rules. The documented orphan inventory has still more than doubled since 2018, federal taxpayers have already been asked to fund a multi-billion-dollar plug-out, and undocumented wells remain a large uncertainty. A formal bond is only as good as its amount and the solvency behind it.
Gas-fired power plants, unlike wells, produce electricity and can be compared with wind and solar on a per-megawatt-hour basis. RFF found them, on average, the cheapest thermal plants to take down, in 2016 dollars. Those figures are older than the NCEA wind and solar sample and were not inflated in this article.