
The Strait of Hormuz—the narrow 21-nautical-mile chokepoint between Iran and Oman that carries roughly one-fifth of the world’s oil and a quarter of global LNG—remains the epicenter of one of the most significant energy disruptions in modern history. As of today, the strait is not fully closed to all traffic, but commercial shipping has ground to a near-standstill amid escalating U.S.-Iran tensions, failed peace talks, and a targeted U.S. naval blockade.
Trump’s Comments and CENTCOM’s Clarification on the Blockade
On Sunday, April 12, President Donald Trump posted on Truth Social, announcing that the U.S. Navy would “begin the process of BLOCKADING any and all Ships trying to enter, or leave, the Strait of Hormuz,” following the collapse of weekend peace talks in Pakistan. He emphasized that the action targeted vessels linked to Iran, including those that had paid tolls to Tehran.
U.S. Central Command (CENTCOM) provided operational details hours later: Starting at 10 a.m. ET on Monday, April 13, the U.S. will enforce a blockade of all maritime traffic entering and exiting Iranian ports and coastal areas (including all Iranian ports on the Persian Gulf and Gulf of Oman). The blockade applies impartially to vessels of all nations.
Crucially, CENTCOM stated: “CENTCOM forces will not impede freedom of navigation for vessels transiting the Strait of Hormuz to and from non-Iranian ports.” Additional notices to mariners are forthcoming. This is a more limited action than Trump’s initial wording suggested, preserving transit for non-Iranian traffic while cutting off Iranian port access.
Iran’s Islamic Revolutionary Guard Corps has vowed retaliation, and ship traffic has already largely halted in anticipation.
Active Traffic: Near Standstill
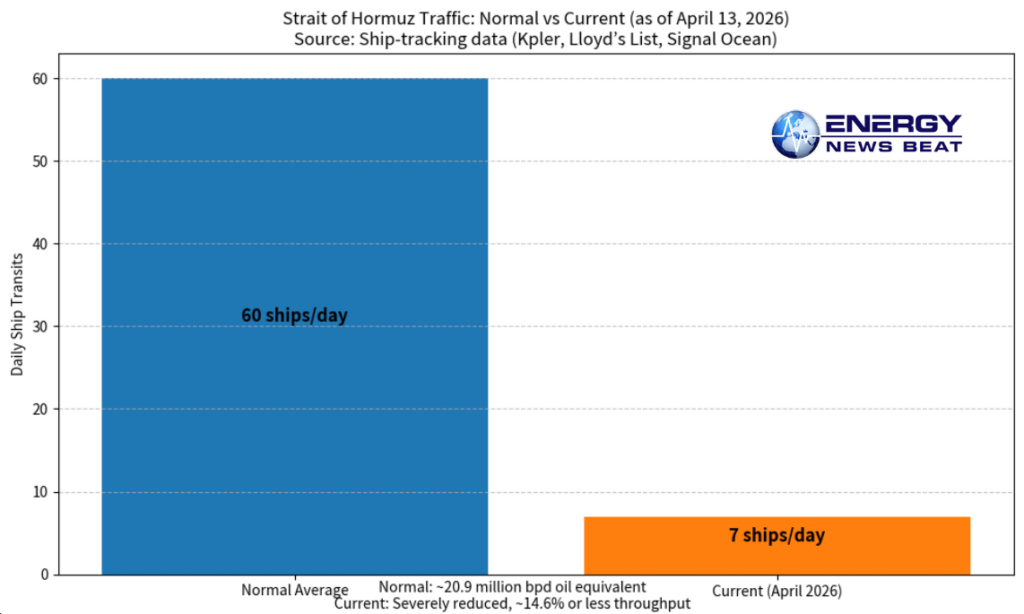
Pre-crisis, the strait saw an average of ~60 commercial vessels per day and ~20.9 million barrels per day (bpd) of oil and petroleum products—about 20% of global petroleum liquids consumption.
As of April 13, 2026, real-time tracking shows traffic has collapsed:Daily transits (last 24h): ~7 ships (vs. normal ~60) — roughly 7-14% of normal.
Daily throughput: ~1.5 million DWT (deadweight tons), or under 15% (some reports cite <2%) of the normal ~10.3 million DWT average.
Over 150 vessels (tankers, bulk carriers, etc.) remain stranded inside the Gulf.

Insurance Carriers for Tankers: War Risk Premiums Skyrocket
War-risk insurance has become a major barrier to operations. Pre-crisis premiums were ~0.15% of hull value. They have surged to ~1% (or higher in peaks of 2.5-3% earlier in the crisis), representing a 6-16x increase. For a typical $200-300 million VLCC tanker, this can add millions per voyage.
Coverage remains available through Lloyd’s of London and other markets, but many owners cite safety/crew risks over pure insurance costs. Some governments (including U.S. offers of political risk cover) have stepped in, but commercial traffic has still evaporated.
Current Oil Scenario: Prices Moving Up
Brent crude has climbed back above $100/bbl today (~$101-102/bbl as of midday April 13), up sharply on the blockade news and ongoing disruption.
The ~20% global supply hit (from Gulf shut-ins and halted exports) has no quick fix. Alternative routes via Saudi/UAE pipelines help marginally, but rerouting around the Cape of Good Hope adds 10-14 days and massive costs.
Paper Oil Prices vs. Physical Delivery: A Growing Disconnect
Paper prices (futures like Brent/WTI): Reflect financial trading and future expectations. They have risen but remain relatively lower (~$100-110 range recently).
Physical prices (Dated Brent, Dubai crude, spot cargoes): What refiners actually pay for immediate delivery. These have spiked far higher—often $130-141+/bbl—creating gaps of $30-40/bbl.
This mismatch signals acute real-world scarcity: Buyers are paying huge premiums for prompt barrels amid the physical logjam, even as futures markets price in some hope of eventual reopening. The divergence is one of the widest on record and underscores that the supply shock is more severe than headline futures suggest.
Consumer Impacts by Region
A prolonged disruption would ripple globally, but impacts vary sharply:
Asia (hardest hit): Receives ~80-85% of Hormuz oil/LNG (China, India, Japan, South Korea). Fuel shortages already emerging; export curbs on refined products; higher inflation, power costs, and potential demand destruction. Japan and South Korea are especially vulnerable due to high import dependence.
Europe: Rising diesel/jet fuel prices; aviation and trucking costs up; risk of shortages as Asian buyers compete for non-Gulf cargoes.
United States: Higher gasoline and heating oil prices (global benchmark effect), though U.S. imports from the Gulf are minimal. Broader inflation on commodities like fertilizer, plastics, and aluminum. Domestic producers benefit from higher prices.
Rest of World (esp. developing nations): Severe energy and food price shocks; fertilizer shortages threaten agriculture; currency pressures in import-dependent economies.
Global GDP growth could take a significant hit if the blockade persists for weeks.
What Investors Should Watch
Real-time traffic data — AIS trackers (MarineTraffic, Kpler, Lloyd’s List) for any uptick in transits.
Physical vs. paper spreads — Widening gaps signal ongoing tightness.
Blockade enforcement & diplomacy — U.S. Navy actions, Iranian responses, and any new talks.
Insurance & freight rates — Easing premiums could signal de-risking.
OPEC+ / U.S. response — Spare capacity releases, Strategic Petroleum Reserve draws.
Energy sector plays — Upstream producers, tanker companies (short-term winners from volatility/rerouting), and refiners facing margin squeezes.
Broader macro — Inflation data, central bank reactions, and safe-haven flows.
Resolution could bring a sharp price reversal, but prolonged closure risks $110-150+/bbl scenarios and stagflationary pressures.
The Strait of Hormuz is technically “open” for non-Iranian traffic under U.S. rules—but in practice, it remains effectively closed to routine commerce until confidence returns. Markets are pricing the risk aggressively. Stay tuned.
- Reuters on Trump/CENTCOM announcements: https://www.reuters.com/world/iran-war-live-trump-says-us-begin-naval-blockade-irans-ports-strait-hormuz-2026-04-13/
reuters.com
- CNN live updates: https://www.cnn.com/2026/04/13/world/live-news/iran-us-war-trump-hormuz
- CBS News: https://www.cbsnews.com/live-updates/iran-war-us-iran-ports-blockade-strait-of-hormuz-trump/
- AP News: https://apnews.com/article/iran-us-israel-trump-lebanon-april-12-2026-a8a0d22918fc3fb30bc3abf1cd5c5a13
- TIME on blockade: https://time.com/article/2026/04/12/trump-blockade-strait-of-hormuz-iran/
- Al Jazeera live: https://www.aljazeera.com/news/liveblog/2026/4/13/iran-war-live-us-military-to-block-iranian-port-traffic-in-hormuz-strait
- CNBC on oil prices: https://www.cnbc.com/2026/04/12/oil-prices-iran-war-strait-hormuz-blockade.html
- Hormuz Strait Live Tracker (real-time data): https://hormuzstraitmonitor.com/
hormuzstraitmonitor.com
- EIA historical flows: https://www.eia.gov/international/content/analysis/special_topics/World_Oil_Transit_Chokepoints/
- Insurance analysis (S&P Global, Reuters): Various reports on war-risk premiums.
- Dallas Fed modeling: https://www.dallasfed.org/research/economics/2026/0320
- Physical vs. paper price analysis (various market reports).
All data is current as of April 13, 2026. Markets move fast—verify live sources.
The post Strait of Hormuz: Is it Open or Closed? appeared first on Energy News Beat.