
In the vast landscape of American energy, few contrasts are as stark as that between Texas and California. One state embodies self-reliance and global leadership, producing far more energy than it consumes while bolstering the nation\’s security and economy. The other grapples with policy-driven shortages, relying heavily on imports to meet basic needs—often from unstable foreign sources. This tale, highlighted by energy analyst David Blackmon in a recent X post, underscores how divergent approaches to energy policy can lead to dominance or dependency.
Blackmon\’s analysis notes that both states consume roughly 1.6-1.8 million barrels per day (bpd) of oil. Yet Texas produces 5.675 million bpd, exporting the surplus to fuel other states and countries. California, despite vast reserves, outputs just 300,000 bpd and imports about 1.3 million bpd daily. Blackmon criticizes California\’s policies under Governor Gavin Newsom for blocking domestic pipelines, forcing reliance on foreign crude—including from Iran. A Visual Capitalist map of U.S. oil production in 2024 reinforces this: Texas leads with 5,675 thousand bpd, dwarfing California\’s 300 thousand bpd and contributing over 40% of the national total of 13,235 thousand bpd.
As we examine 2025 data, this divide has only widened. Texas\’s robust production and exports drive U.S. energy dominance, while California\’s escalating imports signal vulnerability amid refinery closures and restrictive regulations.

Texas: The Engine of American Energy Independence
Texas stands as a powerhouse, shattering records in oil and natural gas production while expanding exports that enhance global stability. In 2025, the state achieved unprecedented highs: crude oil production hit 5.85 million bpd in July, totaling around 2.1 billion barrels for the year.
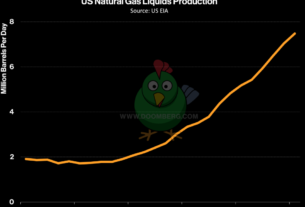
Marketed natural gas reached 35.4 billion cubic feet per day (Bcf/d) in August, amounting to 13.5 trillion cubic feet (Tcf) annually—nearly 30% of U.S. output.
These figures, driven by efficiency gains in the Permian Basin, represent a 5.8% year-to-date increase despite fewer rigs in operation.
Exports further cement Texas\’s role. The state shipped out approximately $220 billion in energy products in 2025, including record volumes of crude oil, condensate, liquefied natural gas (LNG), and total natural gas.
LNG exports from Texas and Louisiana approached 13 Bcf/d, with another 19 Bcf/d in development. In March alone, Texas produced 27.7 Bcf/d of dry natural gas, supplying 11.8 Bcf/d domestically while exporting 12.5 Bcf/d—61% of LNG and 40% of crude going to Europe.
Electricity generation tells a similar story of abundance. Texas leads in renewables too, with 42,000 megawatts (MW) of wind and 22,000 MW of solar capacity by year\’s end, plus 6,500 MW of battery storage.
Wind and solar met 36% of ERCOT\’s demand in the first nine months, up 14% from 2024, contributing to a record 15.6 million megawatts of total output.
Natural gas remains a backbone, providing up to 68.7% of ERCOT\’s supply in peak periods.
Overall, Texas generated 18,534 kWh per person, with low-carbon sources at 55%—a mix that supports surging demand from population growth, data centers, and AI without widespread shortages.This surplus not only powers Texas but props up the nation. Texas accounts for 42% of U.S. crude oil and 30% of marketed natural gas, making it the linchpin of American energy dominance.
If Texas were a country, its oil output would rank fourth globally—twice that of Iran—and its natural gas production would exceed the Islamic Republic\’s.
By exporting to allies, Texas reduces reliance on volatile suppliers, enhancing U.S. national security and economic leverage.
Overview of the Permian Basin
Crude Oil Production Details
Permian oil production has seen steady growth over the past decade, driven by advancements in drilling efficiency, such as longer laterals and improved completion techniques. In 2025, output reached record levels, but 2026 projections show a flattening or slight decline amid economic pressures and maturing fields.
- Historical and Recent Trends:
- 2024: Averaged approximately 6.3-6.44 million barrels per day (bpd).
- 2025: Rose to about 6.6-6.73 million bpd, marking a 4-5% year-over-year increase.
- 2024: Averaged approximately 6.3-6.44 million barrels per day (bpd).
- 2026 Forecast:
- Expected to average 6.52-6.6 million bpd, representing a potential 1% decline from 2025 peaks, influenced by low oil prices curbing new drilling.
- Some operators, like Permian Resources, project company-specific output of 186,000-192,000 bpd for 2026, down slightly from Q4 2025\’s 188,633 bpd.
- Long-term potential: The USGS estimates an additional 1.6 billion barrels of technically recoverable oil in deeper formations like the Woodford and Barnett shales.
- Expected to average 6.52-6.6 million bpd, representing a potential 1% decline from 2025 peaks, influenced by low oil prices curbing new drilling.
|
Year
|
Average Oil Production (Million bpd)
|
Year-over-Year Change
|
Key Drivers
|
|---|---|---|---|
|
2024
|
6.3-6.44
|
+0.3 (from 2023)
|
Efficiency gains in Permian sub-basins (Midland and Delaware)
|
|
2025
|
6.6-6.73
|
+0.29-0.43 (+4-5%)
|
Higher rig productivity; associated gas output boosting economics
|
|
2026
|
6.52-6.6
|
-0.08 to flat (-1% to 0%)
|
Low prices (~$60/bbl); shift toward gas-focused drilling
|
Natural Gas Production Details
The Permian is increasingly \”gassier\” as fields mature, with gas-to-oil ratios rising. Natural gas production growth has outpaced oil in recent years, supported by associated gas from oil wells. However, pipeline constraints have led to low prices at hubs like Waha (averaging $0.06/MMBtu in late 2025), limiting expansion until new capacity comes online in mid-2026.
- Historical and Recent Trends:
- 2024: Marketed natural gas averaged 24-28 Bcf/d; residue gas around 18.6 Bcf/d.
- 2025: Marketed production hit 27.7 Bcf/d, up 11% (2.7 Bcf/d) from 2024; residue gas expected at 20.9 Bcf/d.
- 2024: Marketed natural gas averaged 24-28 Bcf/d; residue gas around 18.6 Bcf/d.
- 2026 Forecast:
- Marketed natural gas projected to average 29.5 Bcf/d, a 1.7-6% increase, unlocked by 4.5 Bcf/d of new pipeline capacity (e.g., Matterhorn Express) in the second half of the year.
- Residue gas could grow 1.8-2.0 Bcf/d even if oil output flattens.
etftrends.com
- Long-term: Potential to reach 40 Bcf/d by 2050, with 5-6 Bcf/d incremental growth through 2030, driven by LNG exports and AI data center demand.
pboilandgasmagazine.com
- USGS estimates: An additional 28.3 trillion cubic feet (Tcf) of technically recoverable gas in deep shales.
oilprice.com
- Marketed natural gas projected to average 29.5 Bcf/d, a 1.7-6% increase, unlocked by 4.5 Bcf/d of new pipeline capacity (e.g., Matterhorn Express) in the second half of the year.
|
Year
|
Marketed Natural Gas (Bcf/d)
|
Residue Gas (Bcf/d)
|
Year-over-Year Change
|
Key Drivers
|
|---|---|---|---|---|
|
2024
|
24-28
|
18.6
|
+13% (from prior years)
|
Increasing gas-to-oil ratios; associated production
|
|
2025
|
27.7
|
20.9
|
+2.7 (+11%)
|
Oil-directed drilling yielding more gas
|
|
2026
|
29.5
|
22-23 (est.)
|
+1.8-2.0 (+6-9%)
|
New pipelines (4.5 Bcf/d capacity); demand from LNG/AI
|
Key Factors Influencing Production
- Positive Drivers: Technological advancements (e.g., new completion methods) boost well productivity—new wells averaged 433,000 bpd oil and 780 million cubic feet per day gas in first-month 2024 data, trends continuing into 2025.
chsoilfield.com
Infrastructure expansions, like pipelines to Gulf Coast LNG facilities, will support gas growth.
The basin\’s role in U.S. energy security is critical, potentially reaching 50% of national oil output by 2026.
texansfornaturalgas.com - Challenges: Low oil prices may reduce rig counts (from ~249 in August 2025 to levels supporting flat output).
Gas pipeline bottlenecks persist until mid-2026, leading to flaring or shut-ins.
Environmental concerns and global oversupply could pressure long-term development.
- Economic Impact: The Permian supports millions of jobs and contributes to U.S. energy independence, with operators like ExxonMobil planning to ramp up to 2.3 million bpd by 2030.
A rebound in prices is anticipated by 2027 as supply-demand imbalances correct.
California: A Cautionary Tale of Import Dependency
In sharp contrast, California\’s energy landscape reveals a state in decline, burdened by policies that stifle production and amplify imports. Once a top oil producer, California\’s output fell to 250,000 bpd in 2025—down from 760,000 bpd in 2000—due to stringent regulations and bans on new development.
California has gone from an estimated 40 refineries to 7, and 6 of those are slated to close.
With demand steady, the state now imports 75% of its petroleum, 90% of its natural gas, and 30% of its electricity.
Gasoline imports hit records amid refinery closures, like Phillips 66\’s Los Angeles facility in October 2025. West Coast (mostly California) imports averaged 119,000 bpd year-to-date, totaling over 35 million barrels—a high since 2004.
In Q1 alone, 10.6 million barrels surged in, up 36% year-over-year, with peaks of 5.3 million in March.
Sources include Asia (India, South Korea) and the Bahamas—a workaround for Jones Act restrictions, rerouting U.S. Gulf Coast fuel.
Foreign imports now supply 20% of California\’s gasoline.
Diesel imports are lower at 20,000-25,000 bpd, with Q1 at 2.3 million barrels (down 63% year-over-year), as California exported 9.3 million barrels.
Still, foreign sources provide about 20% of diesel and jet fuel.
Natural gas dependency is acute: California imports nearly 90% of its supply, with demand around 2,313 Bcf/year.
In-state production covers just 10-23%, forcing reliance on pipelines from the Rockies and Southwest.
Electricity imports averaged 30%, or about 105,000 gigawatt-hours (GWh) annually—40% of consumption—with one-third from fossil fuels.
In 2025, net imports reached 39,598 megawatt-hours (MWh) on sample days, with unspecified sources (often carbon-intensive) comprising 8.6% from the Southwest.
Renewables like solar grew 17% in the first eight months, but natural gas generation fell 17% as imports filled gaps.
These imports expose California to global volatility, higher emissions from distant sources, and price spikes—gasoline averages $1.50/gallon above the national rate due to taxes and programs.
Refinery numbers dwindled from 23 in 2000 to 12 by 2025\’s end, exacerbating shortages.
Texas\’s Role in U.S. Energy DominanceTexas\’s output doesn\’t just benefit the state—it propels the U.S. to global energy leadership. Producing 42% of national oil and 30% of gas, Texas enabled U.S. records: 13.6 million bpd oil and 118.5 Bcf/d marketed gas in 2025.
The Permian alone, at 6.6 million bpd, outpaces most OPEC nations.
Exports from Texas reduce U.S. vulnerability: In 2025, the state led in LNG shipments, stabilizing allies amid conflicts like Iran\’s disruptions.
This \”Texas Effect\” ensures military readiness and economic strength, as President Trump noted during a Corpus Christi visit, praising Texas for making the U.S. the world\’s top LNG exporter.
Meanwhile, California\’s model risks cascading failures, with imports from petrostates undermining U.S. independence.
A Path Forward
This tale of two states serves as a national lesson: Policies fostering innovation and production yield dominance, while restrictions breed collapse. Texas’s model—balancing fossils and renewables—powers progress. For California, reversing course on pipelines and production could stem the tide. We have a very short window to save California. As mentioned above, we have only 7 refineries left. With increased oil production from Sable offshore now finalized, if those refineries close, the oil would have to be shipped to a foreign refinery. And also mentioned above, 6 of the 7 have indicated they are closing. We need to federalize them now to save them.
Ultimately, America’s energy future hinges on emulating Texas’s independence to secure dominance for all.
Sources: brownwoodnews.com, txoga.org, austincountynewsonline.com, eia.gov, energynewsbeat.co/, californiaenergytransition.com, Grok, @energyabsurdities on X,
Get your CEO on the #1 Energy Podcast in the United States: https://sandstoneassetmgmt.com/media/
Is oil and gas right for your portfolio? http://energynewsbeat.co/invest/