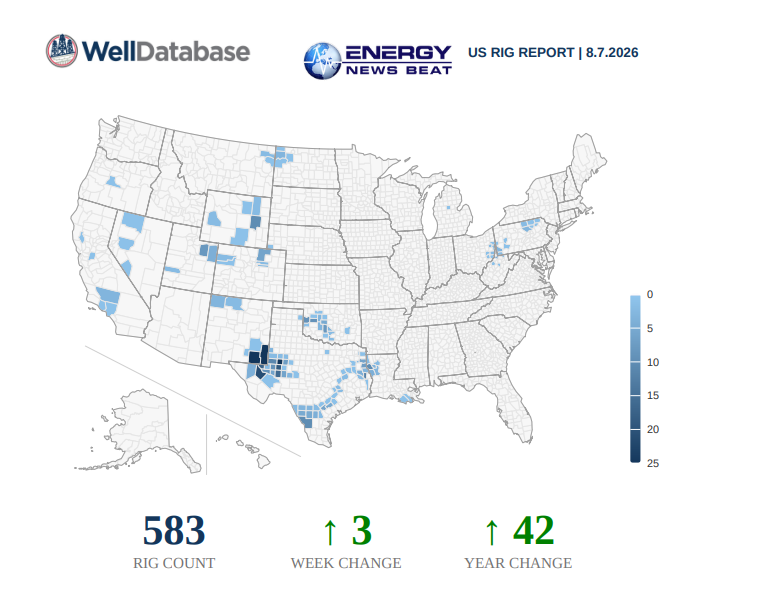
The latest WellDatabase US Rig Report (dated August 7, 2026) shows the national active rig count rising modestly by 3 week-over-week to 583, up 42 from the same period a year earlier. Oil-directed rigs accounted for the bulk of activity at 427 (+1), with gas-directed rigs holding steady at 127 and smaller contributions from thermal and other categories. Horizontal wells continued to dominate at 499.
This slight uptick aligns with broader industry stability rather than a sharp acceleration, consistent with capital discipline among operators amid resilient but measured upstream spending.
Comparing the Counts: WellDatabase, Baker Hughes, and Enverus
Different methodologies produce varying absolute numbers, but the directional story is coherent:
- WellDatabase (August 7, 2026 snapshot): 583 total (+3 WoW, +42 YoY). Provides granular breakdowns by operator, state, basin, well type, wellbore trajectory, and depth. Oil 427 (+1), gas 127 (flat).
- Baker Hughes (North America rotary rig count released August 7, 2026): U.S. total held flat at 588 (up 49 YoY). Oil-directed rigs rose by 3 to 454 (highest in recent months and +43 YoY), gas-directed fell by 3 to 124, and miscellaneous remained at 10. Permian activity rose by 3 to 263; Eagle Ford held at 49.
- Enverus (daily GPS-based tracking of >95% of the fleet): Typically reports higher absolute figures than the weekly rotary censuses, often in the mid-to-high 600s in recent periods (e.g., late-July readings near 639–648 and essentially flat week-over-week in available snapshots). The higher totals reflect broader, higher-frequency capture rather than a fundamentally different activity trend.
Baker Hughes remains the long-standing industry benchmark focused on significant rotary rigs. WellDatabase adds operator- and play-level detail useful for tracking specific programs. Enverus offers near-real-time visibility. All three indicate activity has recovered from 2025 lows and stabilized in a relatively tight range without aggressive expansion.
Most Active States and Basins
Texas remains the clear leader. According to WellDatabase:
- Texas: 273 rigs (+1 WoW, +28 YoY)
- New Mexico: 96 (flat WoW, flat YoY)
- Oklahoma: 50 (flat, +9 YoY)
- Louisiana: 38 (+1, +4 YoY)
- North Dakota: 19 (+2, –11 YoY)
- Other notables include Pennsylvania (17), Wyoming (16), Utah (14), Colorado (13), and Alaska (12).
Basin-level concentration continues to favor liquids-rich plays:
- Permian: 260 (+2 WoW; Baker Hughes showed 263)
- Haynesville: 56 (flat; strong YoY gains in gas activity)
- Eagle Ford: 49 (+2)
- Williston: 22 (+2)
- Other: 105 (–2)
- Smaller contributions from Marcellus (25), Cana Woodford (20), Granite Wash (20), Utica (11), and DJ-Niobrara (11).
The Permian accounts for roughly 45% of the WellDatabase total and remains the primary growth engine, with supporting activity in the Eagle Ford and gas-focused Haynesville.
Most Active Companies (Operators)
WellDatabase’s top operators by current rig count (with week and year changes) highlight a mix of large independents and some private/unknown activity:
- Permian Resources Operating LLC: 23 (–7 WoW, +8 YoY)
- Continental Resources: 20 (–1, +3)
- EOG Resources: 17 (–2, –8)
- Pioneer Natural Resources: 17 (–1, –5)
- Unknown: 16 (–4, +6)
- Apex Natural Gas: 15 (flat, +12)
- Diamondback Energy: 15 (–1, +6)
- Oxy: 14 (+1, +9)
- XTO Energy: 14 (flat, +6)
- Devon Energy Production Company: 13 (flat, –5)
Several major operators showed week-over-week declines even as the national total edged higher, underscoring selective program adjustments rather than broad fleet expansion. Private and lesser-known operators continue to contribute meaningfully in certain basins.
Production and Storage Backdrop
U.S. crude oil production remains robust. EIA data for the week ending July 31, 2026, showed domestic output averaging 13.804 million barrels per day, up slightly from 13.796 million bpd the prior week and approximately 520,000 bpd higher than the year-ago level.
Commercial crude oil inventories (excluding the Strategic Petroleum Reserve) stood at 407.0 million barrels as of July 31—an increase of about 2.5 million barrels week-over-week—and roughly 6% below the five-year average for this time of year. SPR stocks were 304.8 million barrels (down from the prior week).
Natural gas working inventories in the Lower 48 reached 3,117 Bcf as of July 31 after a 33 Bcf net injection. Stocks sat about 7% (195 Bcf) above the five-year average and were essentially flat to slightly below year-ago levels. The refill season continues at a healthy pace relative to historical norms.
Frac spread counts (Primary Vision) eased by 4 to 194 crews in the week ending July 31, suggesting completion activity is not accelerating in lockstep with the modest rig gains.
What It Means
The modest rise in the WellDatabase count to 583, alongside a flat Baker Hughes total of 588 and stable higher Enverus readings, points to steady rather than surging drilling. Operators are maintaining activity in core areas—especially the Permian—while exercising capital discipline. Strong crude production near 13.8 million bpd, commercial inventories still below the five-year average, and comfortable natural gas storage levels provide a supportive fundamental backdrop. Year-over-year rig gains of roughly 40–50 units across the major trackers indicate a meaningful recovery from 2025 troughs without the oversupply risks of prior cycles.
Watch for further Permian resilience, any sustained shift in gas-directed activity (Haynesville remains a bright spot on a YoY basis), and how completion (frac) activity tracks the rig counts in coming weeks.
Appendix: Sources and Links
- WellDatabase US Rig Report | 8.7.2026 (attached document providing total count, state, operator, basin, well-type, wellbore, and depth data).
- Baker Hughes North America Rig Count (released August 7, 2026): https://rigcount.bakerhughes.com/na-rig-count/ and reporting summaries (e.g., Oilprice.com / Yahoo Finance coverage of the release confirming 588 total, oil +3 to 454, gas –3 to 124, Permian 263).
- Enverus Daily Rig Count / Rig Analytics (methodology and recent public snapshots showing mid-600s range): https://www.enverus.com/dailyrigcount/ and https://app.drillinginfo.com/drc/ (late-July figures ~639–648 referenced in industry coverage).
- EIA Weekly Petroleum Status Report (data for week ending July 31, 2026; released ~August 5–6): https://www.eia.gov/petroleum/supply/weekly/ (crude production 13.804 MMbbl/d; commercial crude stocks 407.0 MMbbl; SPR 304.8 MMbbl). Highlights and tables confirm production rebound and inventory build.
- EIA Weekly Natural Gas Storage Report (week ending July 31, 2026): https://www.eia.gov/naturalgas/storage/weekly/ and related supplements (3,117 Bcf working gas, +33 Bcf injection, ~7% above five-year average).
- Supporting industry reporting: Oilprice.com “US Oil Drillers Add Rigs” (August 7, 2026); prior Energy News Beat comparative analyses of WellDatabase / Baker Hughes / Enverus for methodological context; Primary Vision frac spread references in Baker Hughes coverage.
Data as of the most recent available releases around August 7, 2026. Counts can shift with revisions or differing cut-off times across providers.