

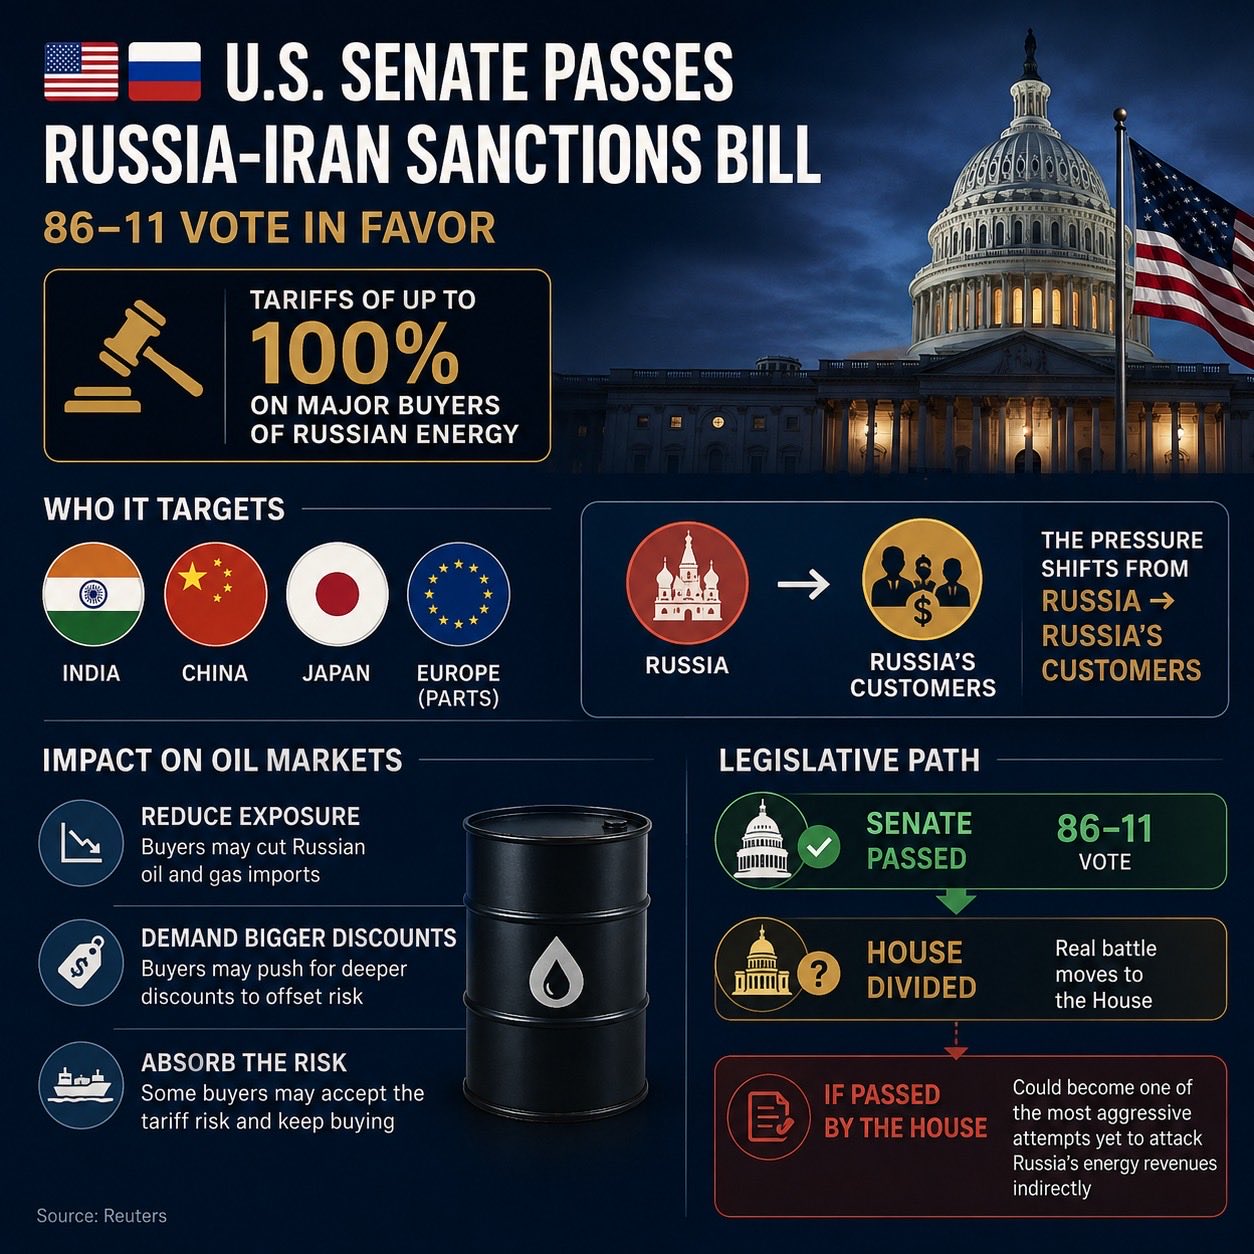
On August 7, 2026, the U.S. Senate overwhelmingly passed the Lindsey O. Graham Sanctioning Russia and Iran Act of 2026 by a vote of 86-11. The bipartisan measure, renamed in honor of the late South Carolina Senator Lindsey Graham—who championed it until his death last month—now heads to the House.
The legislation authorizes the president to impose tariffs of up to 100% on goods from the world’s five largest purchasers of Russian crude oil and natural gas (prominently including China and India), imposes mandatory sanctions on Russian officials (including President Vladimir Putin), oligarchs, state enterprises, and entities supporting Russia’s defense industrial base, targets the so-called shadow fleet, and extends Iran-related energy and weapons sanctions. It also includes provisions for up to 500% tariffs on certain Russian imports and gives the executive branch significant waiver flexibility.
Graham’s final push, secured with White House support just before his death and advanced as a tribute after his funeral (with Ukrainian President Volodymyr Zelenskyy present for procedural votes), is framed as a way to choke off revenues funding Russia’s war in Ukraine, now in its fifth year.
But four years of prior sanctions raise a hard question: Is this package worth the paper it is written on?
Sanctions Have Not Stopped Russia’s Adaptation or Defense of Its Borders
Russia’s 2022 invasion and subsequent war have unfolded against the backdrop of long-standing NATO expansion debates and broken post-Cold War understandings about spheres of influence. Western sanctions—energy price caps, financial restrictions, and vessel designations—were designed to cripple Moscow’s war machine. They have imposed costs, forced discounts on Urals crude, and reshaped trade flows. Yet they have not halted Russia’s military effort or its ability to sustain exports.
Russia has redirected the bulk of its seaborne crude to China, India, and Turkey. Oil export revenues have fluctuated with global prices and enforcement but remain substantial: recent monthly figures hovered around $15–21 billion, with 2026 projections in the $158–183 billion range under base-case assumptions of current caps and enforcement (higher if prices firm, lower under tighter pressure). Cumulative export revenue shortfalls since 2022 run into the tens or hundreds of billions relative to pre-war baselines or full market prices, but volumes have largely held, and the economy has adapted via parallel logistics and new intermediaries.
The Dark Fleet: Numbers That Show Resilience
Central to this adaptation is the “dark” or “shadow” fleet of tankers that disable AIS tracking, reflag frequently, use opaque ownership, and conduct ship-to-ship transfers to evade Western insurance, financing, and sanctions.
Windward’s Q2 2026 data tracked a global dark fleet of 2,186 vessels (up from 2,108 the prior quarter), with roughly half (1,106) sanctioned. Russia accounted for about 18% of registered owners and 21% of the tanker flag state share.
Russia’s oil shadow fleet is estimated in the hundreds to well over 1,000 vessels depending on definition (Ukrainian and other trackers have cited 1,000–1,400 broader marine vessels; more precise tanker counts for crude and products from Russian ports have hovered around 180–185 recently, with many older than 15 years). In June 2026, sanctioned shadow tankers carried about 54% of Russia’s seaborne oil, with G7+ tankers still moving a significant share.
Russia’s LNG shadow fleet has grown more slowly but reached at least 25 ships by early August 2026, including second-hand acquisitions and domestic newbuilds, preparing for tighter EU restrictions.
Iran’s parallel network involves hundreds of vessels (estimates around 400 in broader analyses). Trackers routinely identify dozens of laden tankers along the Iranian coast or in Southeast Asian transfer zones at any given time; Iran-flagged tankers number in the dozens to low hundreds in active databases.
These fleets have allowed Russia (and Iran) to continue monetizing energy despite successive rounds of designations. Past sanctions hurt margins and raised logistical costs but did not collapse volumes or force a strategic retreat.
Ukrainian Drone Warfare: The Real Short-Term Pressure on Russian GDP
What has delivered sharper pain is Ukraine’s escalating long-range drone campaign against Russian oil refining and related infrastructure. Strikes have hit a majority of Russia’s major refineries, knocking 20–42% of primary refining capacity offline at peaks, with throughput falling as low as 3.7–4.5 million barrels per day (multi-year lows) and product output sharply reduced.
Impacts include nationwide fuel shortages and rationing in dozens of regions, disrupted logistics and agriculture, higher domestic inflation pressure, and a “negative supply shock” flagged by Russia’s central bank in May data. Direct and indirect industry losses have run into the billions (one 2025 estimate exceeded $13 billion; 2026 figures are tracking higher). Local economic activity near struck facilities has declined measurably and persistently. Crude production has also edged lower in places as storage and processing bottlenecks appear, though higher global prices at times have partially offset revenue hits.
These kinetic effects on the physical energy system have proven more disruptive in the short term than many financial sanctions, raising genuine concerns about Russia’s near-term GDP and fiscal stability even as the war effort continues.
Weaponization of the Dollar and the Shift Away from It
The broader lesson of the past four years is that repeated weaponization of the U.S. dollar and Western financial plumbing accelerates efforts to reduce reliance on both. The dollar remains dominant globally, with the DXY index trading near 99.9–100 as of early August 2026 (within a recent 52-week range of roughly 95.5–101.8).
Yet bilateral and regional shifts are clear:
Russian oil and product settlements have moved heavily into yuan (around 67%), rubles (around 24%), and other non-dollar currencies, with the dollar’s share reported as low as ~5% in some official presentations. China–Russia trade is overwhelmingly settled in local currencies (figures cited near 99%). India–Russia energy trade has similarly shifted into rupees and other non-dollar mechanisms at high percentages.
BRICS initiatives (expanded membership, local-currency lending by the New Development Bank, interoperability efforts linking CIPS, SPFS, UPI, PIX, and CBDC pilots) continue to build alternatives. Central banks in the bloc have accumulated gold; petro-yuan usage has expanded in energy deals.
China, India, and Russia view the dollar’s past use as a geopolitical tool as a reason to diversify settlement, reserves, and payment rails—not necessarily to dethrone it overnight, but to reduce vulnerability. New secondary tariffs aimed at major buyers risk reinforcing that incentive.
Bottom Line
The Graham Act is a forceful political statement and a potential source of additional leverage if fully implemented and enforced. It targets real revenue streams and the shadow fleet ecosystem. History since 2022, however, shows that Russia has repeatedly adapted through dark fleets, Asian demand, price discounts, and parallel finance. Sanctions alone have not ended the war or collapsed the Russian economy. Ukrainian drone strikes on refining capacity have inflicted more immediate, tangible pressure on domestic fuel supplies, production logistics, and short-term economic activity.
Whether this latest bill changes the trajectory depends less on the vote count in Washington and more on rigorous enforcement, the willingness of China and India to absorb higher costs, and the continued effectiveness of Ukraine’s long-range campaign. In a multipolar energy and financial landscape already adjusting to prior weaponization of the dollar, symbolic toughness is cheap. Durable results are harder.
I think it is a mistake to pursue more sanctions that are impossible to enforce. The world is tired of bullying from the aspect of the overuse of sanctions on the US Dollar. We are facing a bigger backlash going the way of the British pound sterling.
Appendix: Sources and Links
- Senate passage and bill details: NY Post, Reuters, Washington Examiner, NBC News, NPR, and related coverage from July 28–August 7, 2026.
- Dark/shadow fleet data: Windward Q2 2026 Maritime Risk Report (https://cyprusshippingnews.com/2026/07/13/q2-2026-maritime-risk-report-the-9-evolving-trends-you-cant-ignore/ and https://windward.ai/knowledge-base/top-9-u-s-maritime-security-risks-from-q2-2026/); Financial Times on LNG fleet (https://www.ft.com/content/cebc2dfc-1b9e-4119-b1e0-b9b514550d23); KSE Institute Russian Oil Tracker (https://sanctions.kse.ua/); CREA monthly analyses (https://energyandcleanair.org/); PISM on China and shadow fleets; UANI Iran shipping updates; Energy News Beat and MarineTraffic reports.
- Oil revenues and sanctions impact: KSE Institute trackers and chartbooks (multiple 2026 editions); CREA fossil fuel export analyses (May/June 2026 and fourth-year summary); Nest Centre and related revenue studies.
- Ukrainian drone strikes and refining impact: Washington Examiner, Oxford Institute for Energy Studies comment (https://www.oxfordenergy.org/), CEPR, The Insider, Washington Post, Euromaidan Press, The Economist, Carnegie Endowment, OilPrice.com, Energy Intelligence, Moscow Times (June–July 2026 coverage).
- De-dollarization and currency shifts: Reuters on BRICS (https://www.reuters.com/world/americas/brics-alternatives-to-dollar-no-longer-fantasy-economist-oneill-says-2026-07-06/); NDB and BRICS payment reports; China US Focus; Valdai Club; various 2026 analyses on yuan/ruble/rupee settlement shares in energy trade; CBR and Russian Energy Ministry-referenced data on settlement currencies.
- US Dollar Index: Investing.com, GuruFocus, WSJ, and related market data as of early August 2026 (DXY near 99.9–100).
All figures are drawn from the cited open-source trackers, official statements, and contemporaneous reporting as of the tool results available.