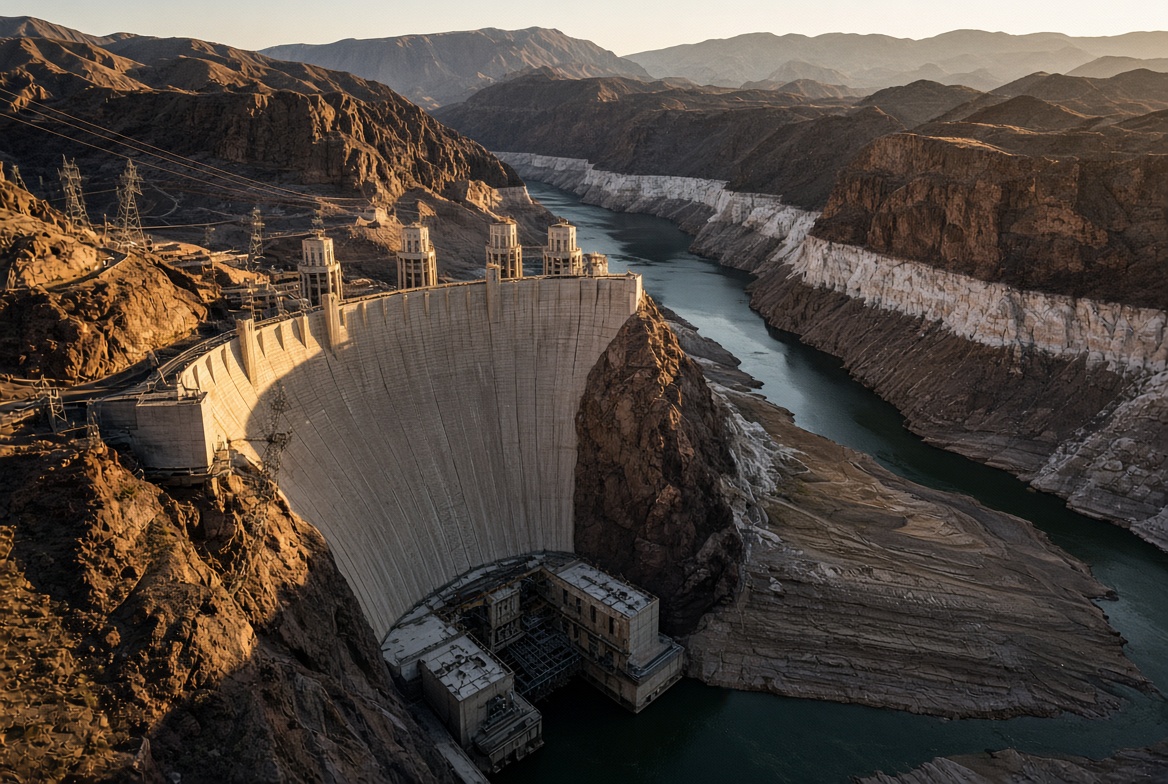
The prolonged drought and structural water deficit in the Colorado River Basin are no longer just a threat to farms, cities, and ecosystems—they are increasingly a direct driver of higher electricity costs across the American West. As detailed in Duggan Flanakin’s August 15, 2026, Townhall column “Western Water Fight Also Impacts Power Generation,” critically low reservoir levels at Lakes Mead and Powell are squeezing hydropower output from Hoover Dam and Glen Canyon Dam, forcing utilities to turn to more expensive alternatives and raising the specter of further rate hikes.
This is not an isolated problem. Hydropower remains a cornerstone of Western electricity supply even as its share of the national mix has declined.
Hydropower’s Role in the Western United States
The western United States—defined by the U.S. Energy Information Administration (EIA) as Arizona, California, Colorado, Idaho, Montana, Nevada, New Mexico, Oregon, Utah, Washington, and Wyoming—typically generates about 60% of the nation’s conventional hydroelectricity. In recent water years, this region has produced roughly 140–160 million megawatt-hours annually, though drought has pushed output to multi-decade lows at times.
Nationally, conventional hydropower accounts for roughly 5.6–6% of U.S. utility-scale electricity generation (about 247 billion kWh in recent data). Capacity is heavily concentrated in the West: Washington alone holds about 27% of U.S. conventional hydro capacity and generates around 26% of the nation’s hydro electricity; California and Oregon together add substantial shares. In the Pacific Northwest, hydro routinely supplies 40–60% or more of state electricity (Washington often exceeds 60%, Oregon around 45%). The Colorado River system, while smaller in absolute terms than the Columbia Basin, is critical for the Southwest, powering parts of Arizona, Nevada, California, and tribal communities.
Glen Canyon Dam’s generators (nameplate around 1,320 MW) historically deliver about 5 billion kWh annually to roughly 5 million people across six states, including 53 tribes. Hoover Dam (nameplate capacity near 2,080 MW) has averaged around 4 billion kWh in better years—enough for about 1.3 million people in California, Arizona, and Nevada—though output has already fallen sharply with lower lake levels.
How Low Are the Reservoirs?
As of mid-to-late August 2026, conditions remain dire and near historic lows:
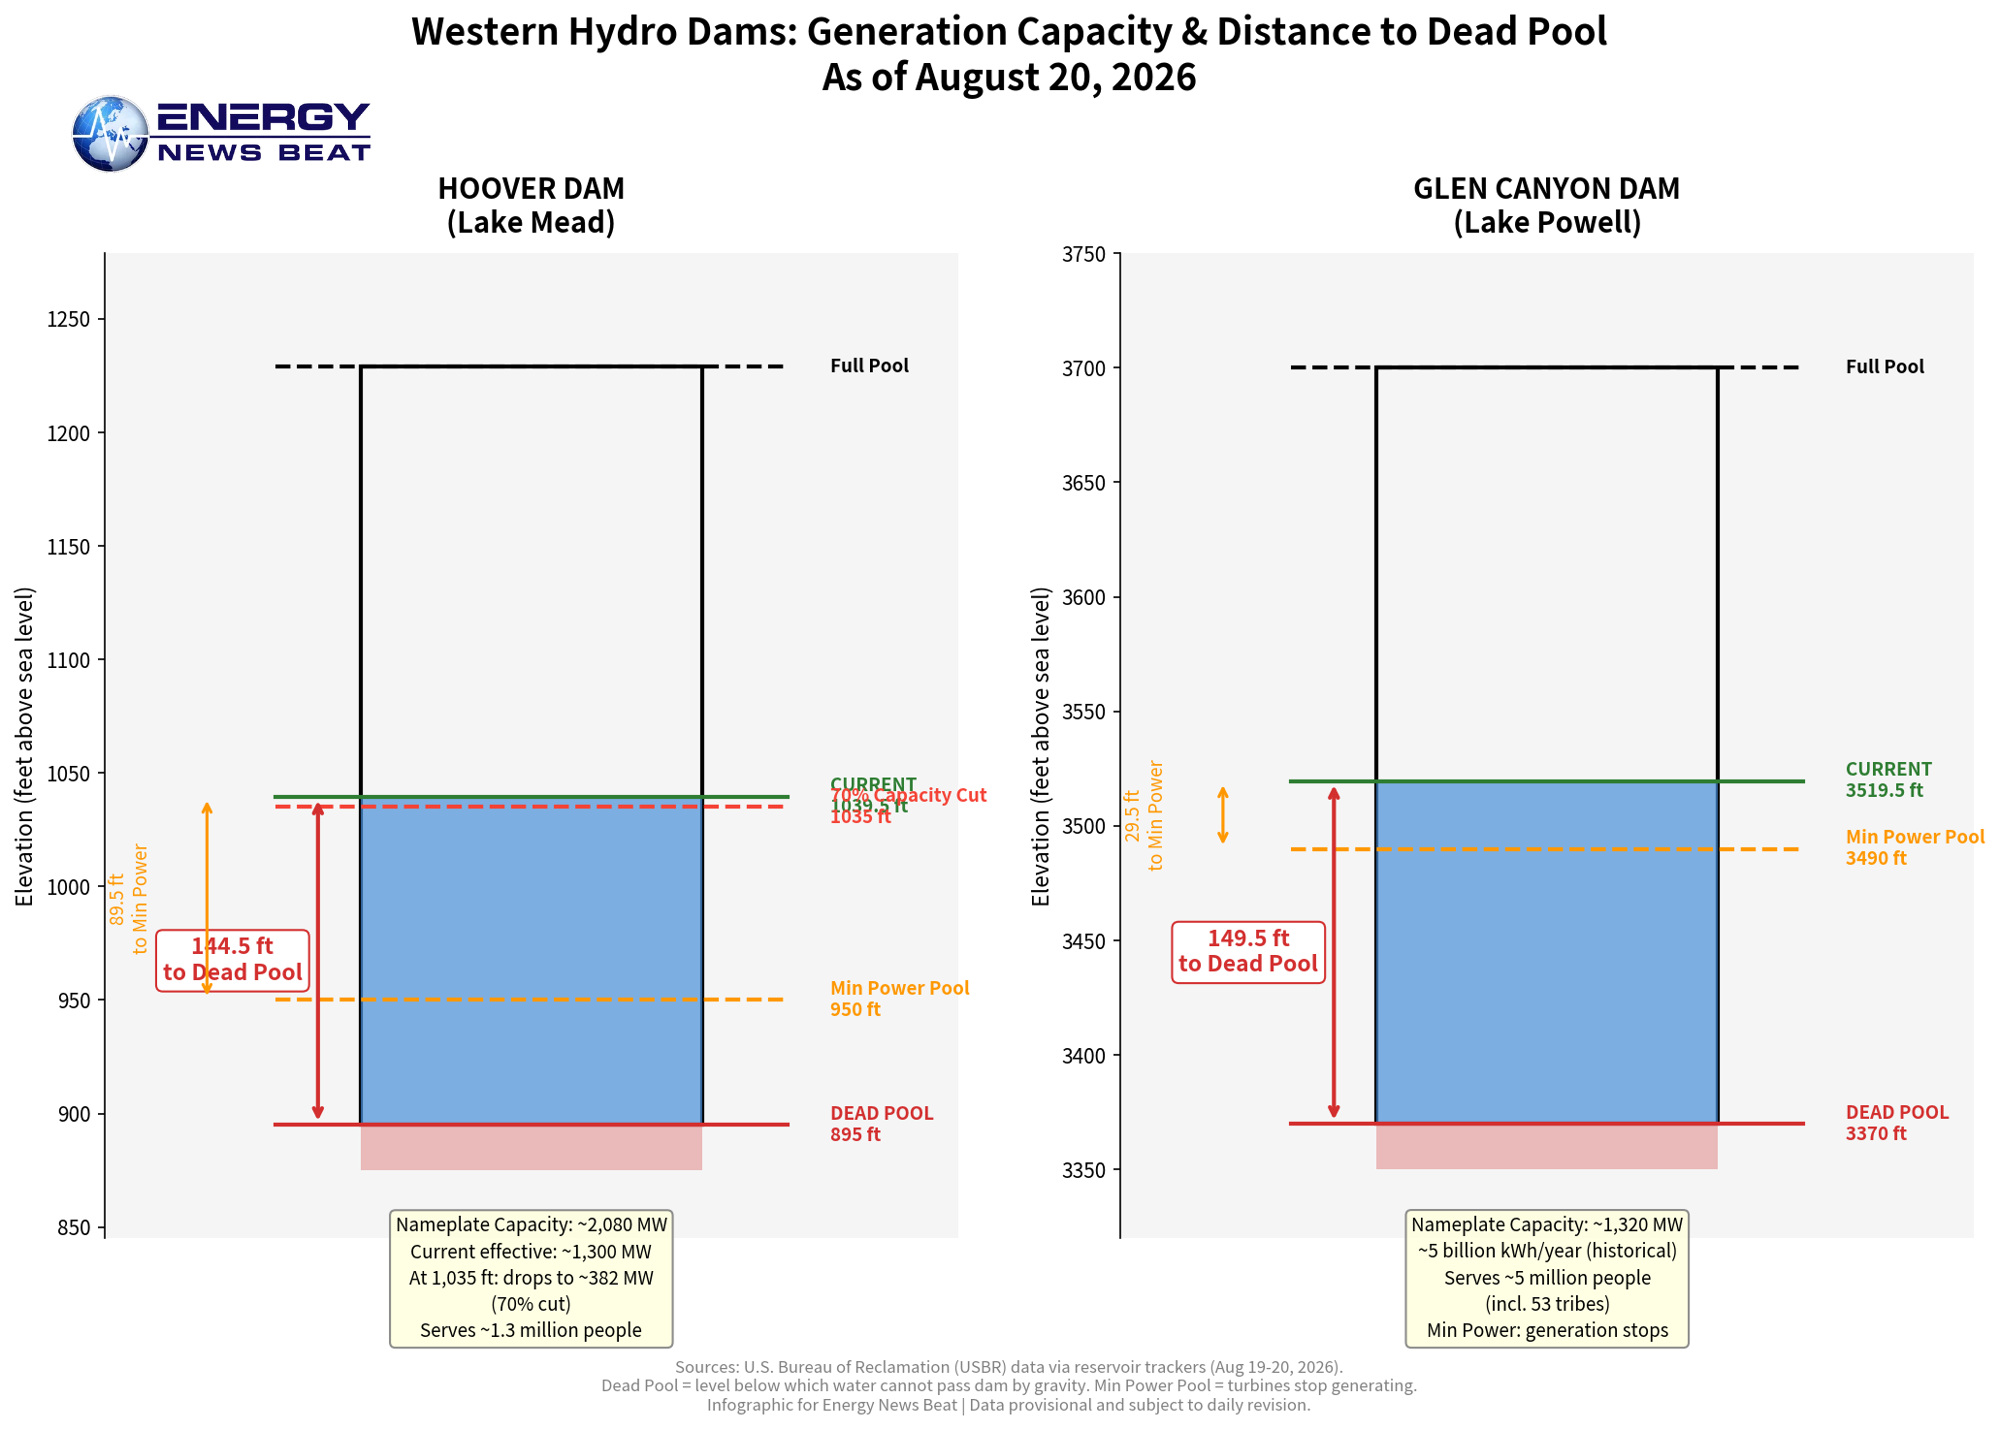
- Lake Powell (behind Glen Canyon Dam): Elevation approximately 3,519.4–3,519.5 feet above sea level, or about 21.5% of capacity. This is roughly 180.5 feet below full pool (3,700 feet), about 29.5 feet above the minimum power pool (3,490 feet—below which turbines can no longer generate), and roughly 149.5 feet above dead pool (3,370 feet, the level at which water can no longer pass the dam by gravity through existing outlets). Combined storage with Lake Mead is at its lowest since before Glen Canyon Dam began filling in 1963.
- Lake Mead (behind Hoover Dam): Elevation around 1,039.5 feet, roughly 24–26.6% full (depending on the capacity basis used). This places it about 4–5 feet above the critical 1,035-foot threshold, at which point 12 of Hoover’s 17 turbines (the older units) are expected to shut down due to cavitation risk, cutting generating capacity by about 70%—from roughly 1,300 MW currently to around 382 MW. Mead sits well above its minimum power pool (near 950 feet) and dead pool (895 feet), with about 144–145 feet of buffer remaining to dead pool.
Inflows remain chronically low. Average unregulated inflow into Lake Powell from 2000–2024 was about 12.9 million acre-feet (maf) versus the 18 maf assumed in the 1922 Compact; 2026 estimates have been far lower. Consumptive use has consistently exceeded supply in most years of the 21st century.
Are the Lakes Near “Dead Pool”? How Much Impact Soon?
Neither lake is at true dead pool, and managers are actively defending higher “power pool” elevations through Drought Response Operations Agreement (DROA) releases from upstream reservoirs (Flaming Gorge, Blue Mesa, Navajo, etc.). However, both are uncomfortably close to operational cliffs that would sharply curtail or eliminate hydropower.
Lake Mead is within a few feet of the 1,035-foot mark that triggers the 70% capacity cut at Hoover. Forecasts earlier in 2026 indicated a non-trivial chance of crossing that threshold in 2027 under most-probable conditions. Lake Powell has been projected to approach or reach minimum power pool (3,490 feet) by spring 2027 without continued emergency upstream releases and reduced downstream deliveries. Dead pool itself remains a more distant risk—experts note federal managers would likely modify outlets or build bypasses before that point—but “de facto” operational limits are already biting.
Impacts already underway or imminent include reduced generation (Hoover output is already well below historical averages), higher wholesale power costs, and pressure on fixed costs that get passed to ratepayers. Rural utilities heavily dependent on Hoover allocations (e.g., parts of Nevada) face particularly acute exposure.
Grid Stability if Hoover Severely Curtails or Stops Generating
A sharp drop or eventual cessation of Hoover generation would not plunge the Western Interconnection into blackout. Hoover’s contribution, while valuable, is a modest fraction of total Western capacity and energy. The Western Electricity Coordinating Council (WECC) and national labs have been modeling “what-if” scenarios involving major hydro losses.
Hydropower’s special value lies in its flexibility—rapid ramping to balance variable solar and wind and to meet evening peaks. Loss of that capability would be offset by a combination of:
- Increased natural-gas generation (higher fuel and emissions costs).
- Growing utility-scale solar and battery storage, which have already cushioned some prior hydro declines.
- Imports and redispatch across the broader grid.
- Demand response and efficiency measures.
Experts emphasize that the result is higher costs rather than systemic collapse. Fixed costs of the dams must still be recovered from fewer kilowatt-hours, and market purchases to replace lost hydro are typically more expensive. Rate impacts are already material for some customers and would intensify with further cuts. Turbine upgrades (wide-head units capable of operating at lower elevations) are underway or funded to mitigate the severity of the capacity drop from 70% toward 58%.
Other Dams Near Critical Status?
The crisis is concentrated on the Colorado River’s two mega-reservoirs, but the strain is system-wide. Upstream Upper Basin reservoirs (Flaming Gorge, Blue Mesa, Navajo) have been drawn down to protect Powell’s power pool, leaving some at reduced percentages of capacity and limiting their own future flexibility. Blue Mesa and related Aspinall Unit facilities in Colorado have seen generation impacts and approach their own minimum power elevations under continued dry conditions. Smaller projects face similar hydraulic-head losses.
The Columbia River system in the Pacific Northwest, home to the bulk of Western hydro capacity (Grand Coulee, Chief Joseph, etc.), has experienced drought-driven lows in past years but is not currently at the same emergency thresholds as Mead and Powell. Overall Western hydro remains vulnerable to precipitation variability, and multi-year droughts compound risks across basins.
Looking Ahead
The Bureau of Reclamation’s Final Environmental Impact Statement (July 2026) outlines adaptive guidelines through 2036, including variable Powell releases, potential Lower Basin shortages up to 3 maf, and conservation measures. States remain divided, with litigation risks high. Without sustained wetter conditions or deeper structural reforms in water allocation and demand, the trend points toward continued pressure on hydro resources—and therefore higher power bills—as utilities fill gaps with costlier generation.The Western water crisis is already playing out on electricity bills. The next few years of reservoir management, turbine investments, and grid adaptation will determine how steep those increases become.
Appendix: Sources and Links
- Duggan Flanakin, “Western Water Fight Also Impacts Power Generation,” Townhall, August 15, 2026. https://townhall.com/columnists/dugganflanakin/2026/08/15/western-water-fight-also-impacts-power-generation-n2681275
- U.S. Energy Information Administration (EIA), “Where hydropower is generated.” https://www.eia.gov/energyexplained/hydropower/where-hydropower-is-generated.php
- EIA, “Western U.S. hydropower generation fell to a 22-year low last year,” March 26, 2024. https://www.eia.gov/todayinenergy/detail.php?id=61645
- Lake Powell Water Level Today (live USBR-derived data). https://www.lakepowellwaterlevel.com/today
- LakeLevelNow / Lake Mead current data. https://lakelevelnow.com/lake/lake-mead/
- Basin Pulse — Colorado River Reservoir Levels. https://basinpulse.loganirons.com/
- ReservoirBench Lake Mead data. https://reservoirbench.com/lake-mead/
- U.S. Bureau of Reclamation Lower Colorado River Operations. https://www.usbr.gov/lc/region/g4000/hourly/levels.html and related pages.
- Circle of Blue / Water Desk reporting on Hoover Dam hydropower cliff. https://www.circleofblue.org/2026/water-energy/hoover-dam-approaches-a-hydropower-cliff/ and related articles.
- USA Today, “Lake Powell hits lowest summer level ever…,” June 25, 2026. https://www.usatoday.com/story/news/nation/2026/06/25/why-lake-powell-risk-dead-pool/89557878007/
- Popular Mechanics, “Hoover Dam Is Losing Power…,” August 10, 2026. https://www.popularmechanics.com/science/energy/a73357713/hoover-dam-power-crisis/
- Additional context from WECC modeling discussions, Bureau of Reclamation EIS materials, and National Hydropower Association regional profiles (various dates 2024–2026).
Data on elevations and capacities reflect USBR and independent trackers as of approximately August 19–20, 2026, and are subject to daily revision.