
ExxonMobil made $7.169 billion refining and $7.088 billion pumping oil in the third quarter, the first time in at least six years the refineries won, with its Gulf Coast crude units at 100%. What it costs to keep them there is the one number neither ExxonMobil nor Chevron will publish.
By Energy News Beat | Oct. 30, 2026 | ExxonMobil and Chevron third-quarter 2026 results, both released Oct. 30; EIA data through August 2026; all figures in U.S. dollars
ExxonMobil earned $7.169 billion from refining in the third quarter and $7.088 billion from producing oil and gas. Refining won by $81 million, and by enough that Reuters found no quarter in at least six years when that had happened.
Group earnings were $15.413 billion, or $3.72 a share; adjusted, $4.23 against the $4.08 analysts compiled by LSEG expected.
The release credits “strong operational performance including 100% crude unit utilization at our U.S. Gulf Coast refineries and the second-highest U.S. Gulf Coast diesel production on record.” It does not say what it costs to keep them there.
Both companies just posted their best refining profits in years running plants at 98% to 100% of crude capacity, the regime that wears equipment out and forces turnarounds. Neither publishes a maintenance or turnaround-spend line. Both cut downstream capital before the boom. And schedule trackers have logged refiners moving planned 2026 maintenance into 2027. The bill is being deferred, not cancelled.
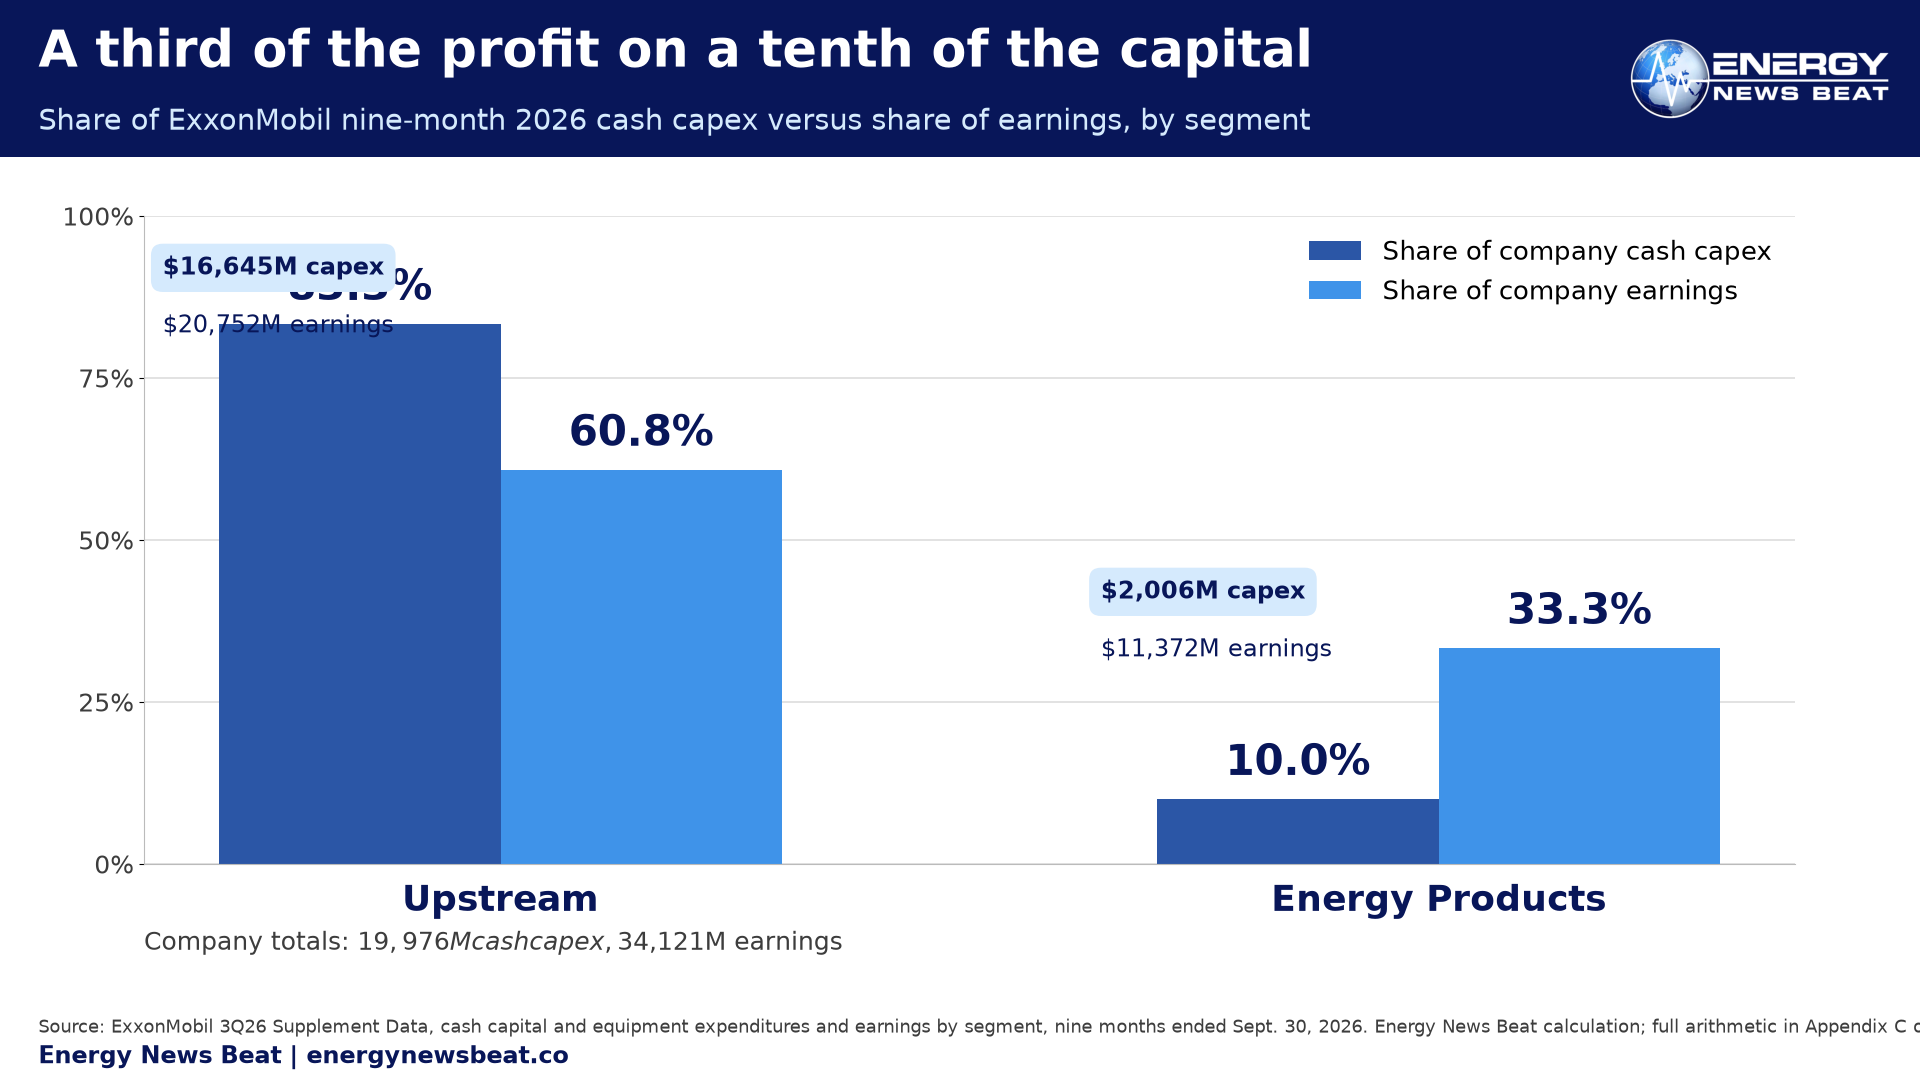
A third of the profit on a tenth of the capital
Energy Products took $2.006 billion of ExxonMobil’s $19.976 billion in cash capital spending through nine months, 10.0%, and produced $11.372 billion of $34.121 billion in earnings, 33.3%. Upstream took $16.645 billion and produced $20.752 billion: 83.3% and 60.8%. Appendix C shows the arithmetic.
That ratio is not proof of neglect. Refining is less capital-hungry per barrel than a deepwater field, and capex reflects projects sanctioned earlier. But the cash engine and budget point different ways. Chevron’s downstream is starker still: $653 million of $12.612 billion in capex, 5.2%, produced $8.982 billion of $24.206 billion in earnings, 37.1%.
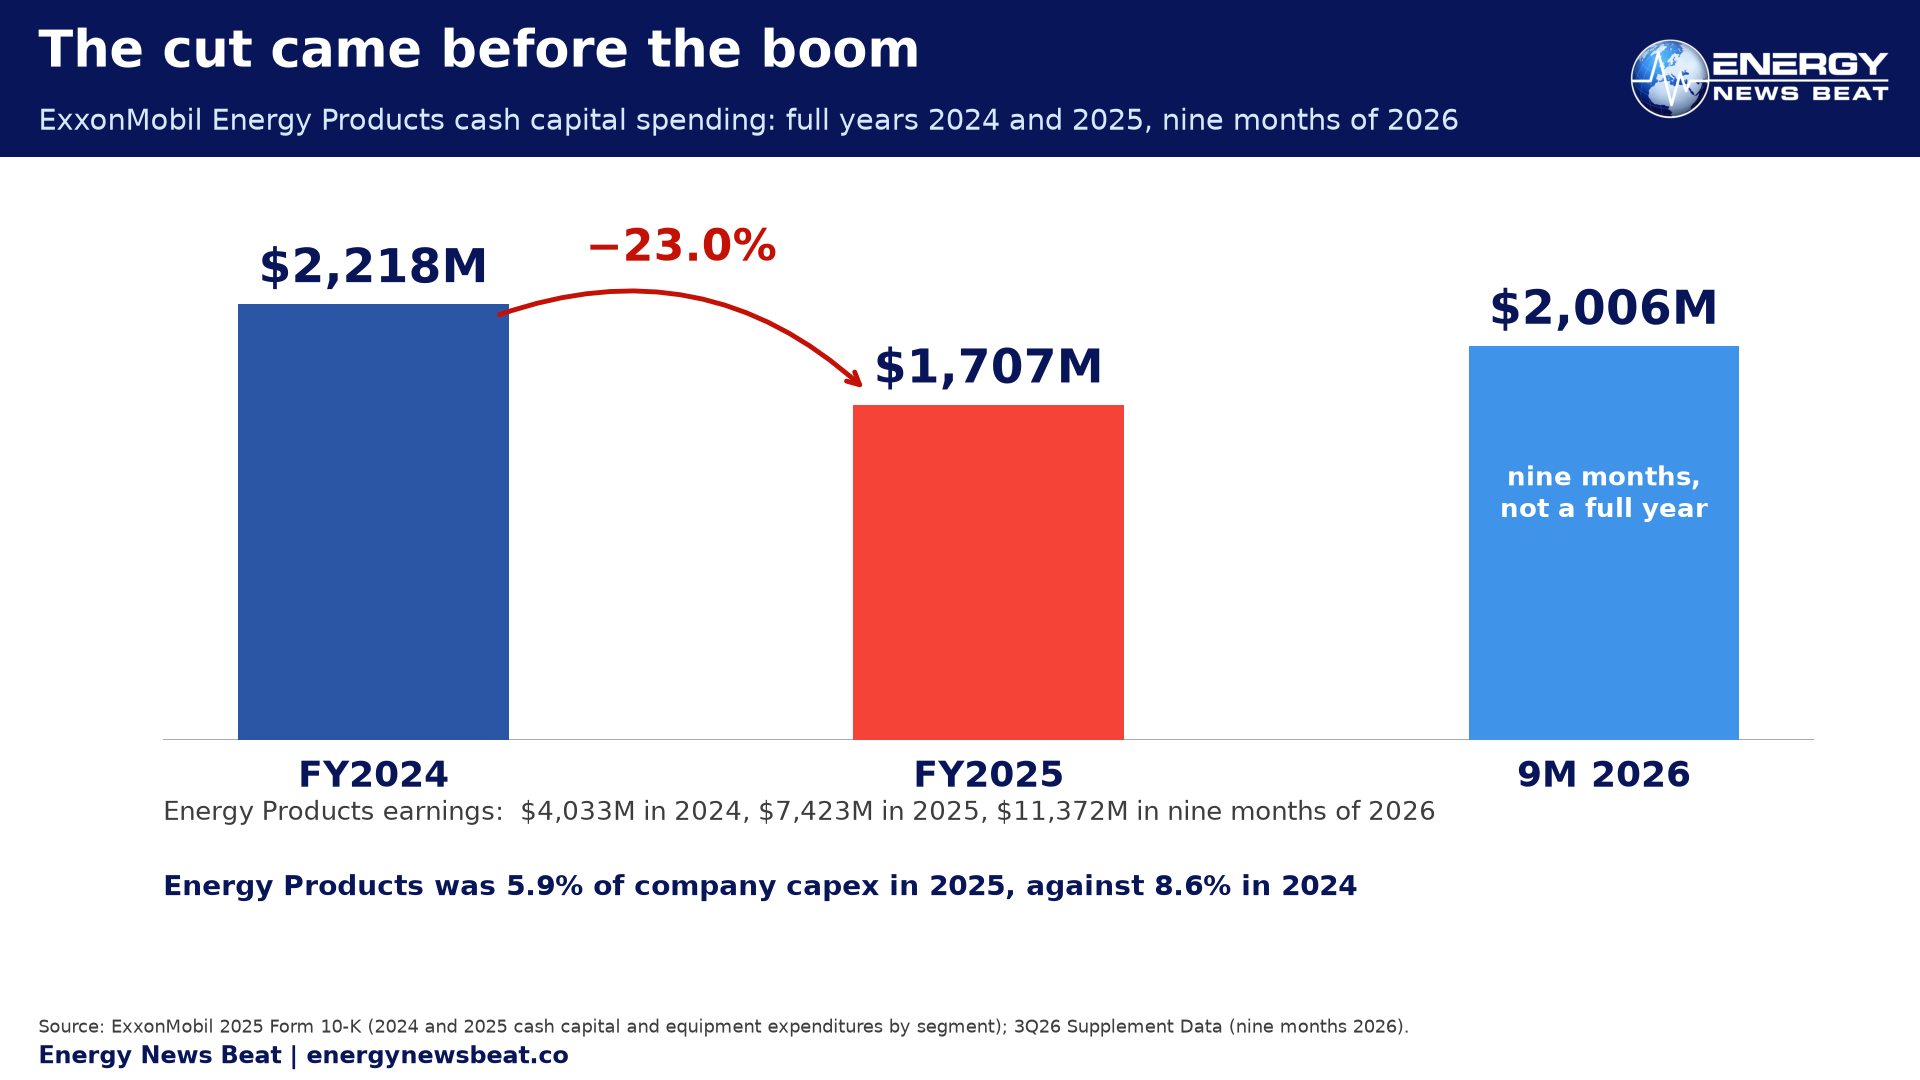
The cut came before the boom
In 2025, the last full year before the war, Energy Products capex was $1.707 billion, down 23.0% from $2.218 billion in 2024, and 5.9% of the company’s $28.997 billion total against 8.6% a year earlier. Chevron’s downstream capex fell from $1.773 billion in 2023 to $928 million in 2025, a 47.7% cut.
The U.S. figure is the exception: U.S. Energy Products capex tripled, from $463 million to $1.386 billion, up 199%, tracking the Gulf Coast reconfiguration. The company does not split that between maintenance and growth.
Nor has the plan changed since the fighting started. The $27 billion to $29 billion 2026 budget came from the Dec. 9, 2025 corporate plan, eleven weeks before the war began Feb. 28, 2026, and investor relations head Jim Chapman told the Q3 call ExxonMobil will skip its December plan update. As Reuters columnist Ron Bousso wrote Friday, it is telling that the majors’ dividend policies and capital spending plans have remained largely unchanged since the start of the war.
Running flat out
Five utilization measures circulate; none substitutes for another. EIA’s monthly survey put U.S. utilization at 97.6% in August 2026; its weekly survey read 92.8% for the week ended Oct. 23. Chevron reported crude utilization of 98% at its U.S. refineries. ExxonMobil reported 100% crude unit utilization at its U.S. Gulf Coast refineries, crude units only, Gulf Coast only. Its global fuels utilization is lower, quoted as a record year to date excluding Middle East impacts.
EIA’s own analysis put utilization averaging more than 95% of capacity between May and September, the highest for those months since 1998, and noted output was only the highest since 2019 because refining capacity has fallen 4% since then. The capacity report shows which pieces leave: distillation down 263,000 barrels a calendar day, or 1.43%; coking down 4.90%; hydrotreating down 2.51%; fluid catalytic cracking down 2.85%. The diesel-making units are retiring fastest.
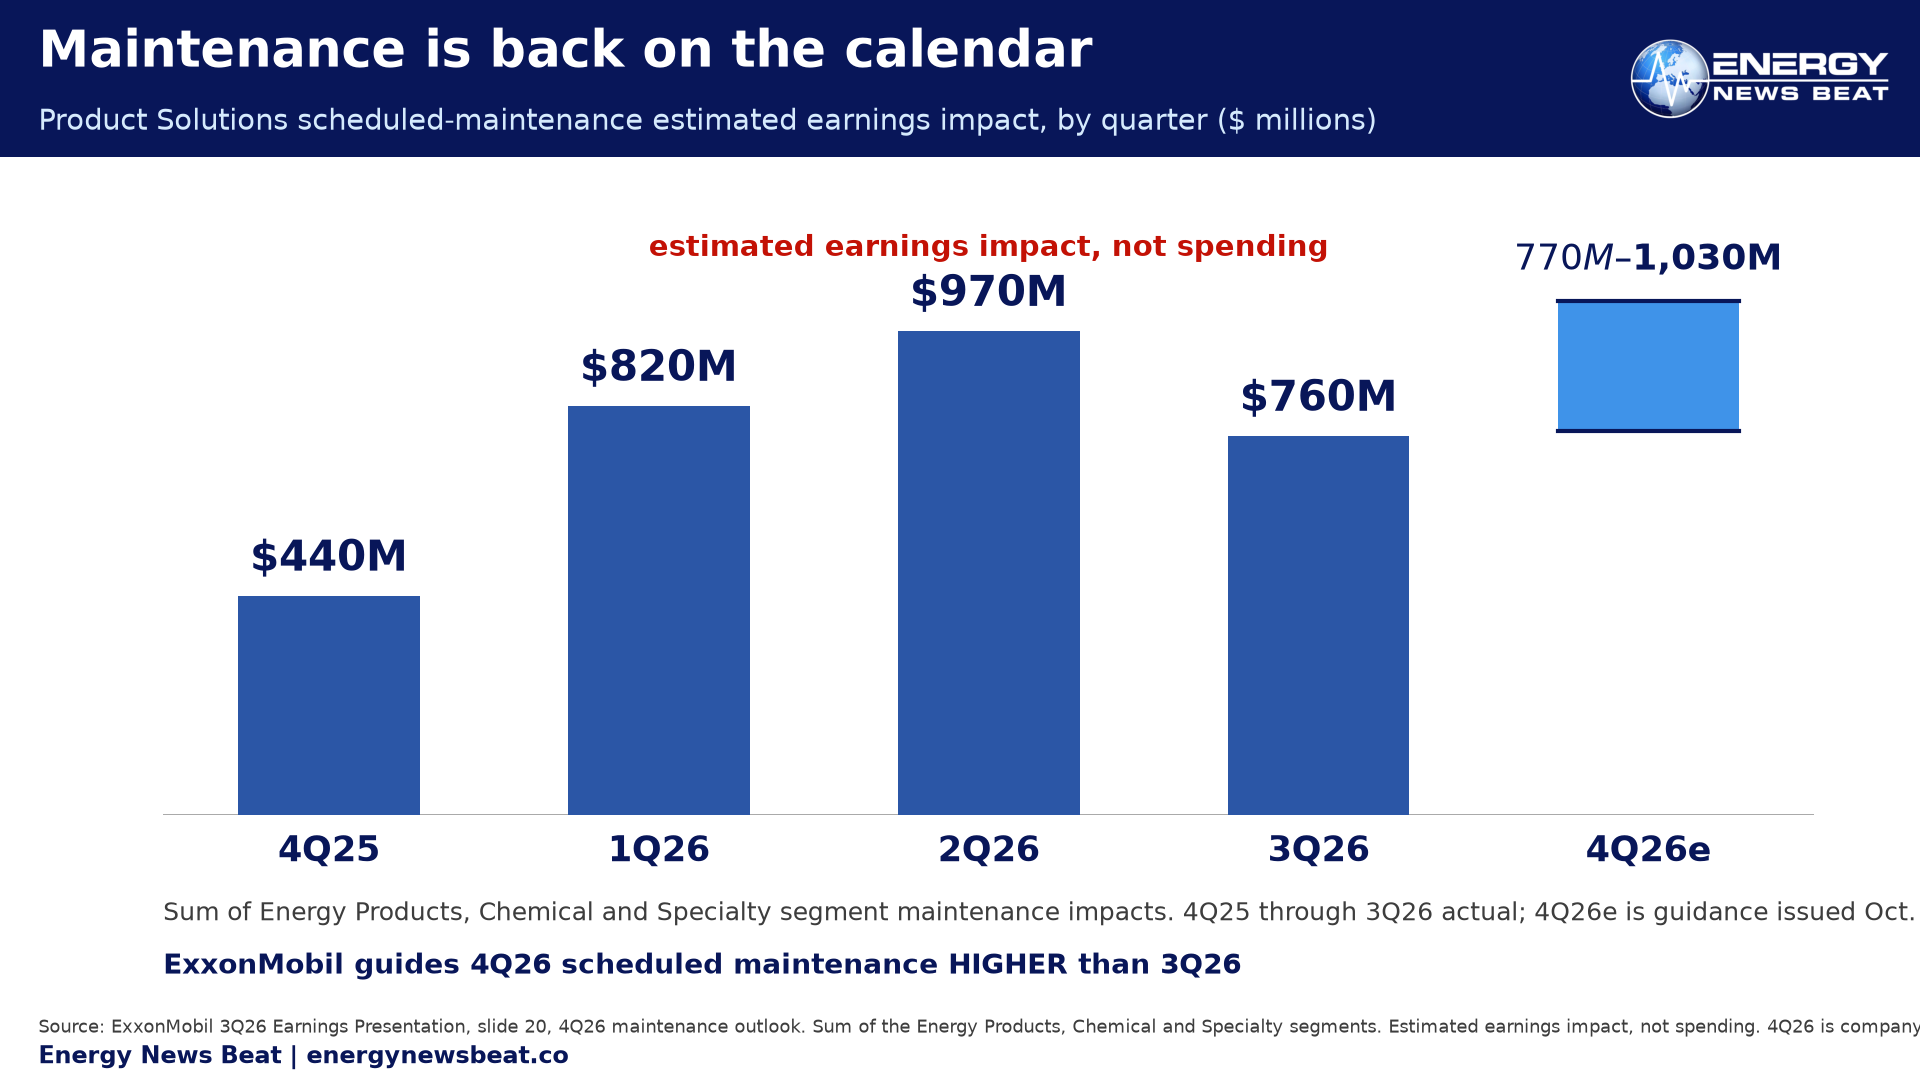
The bill is moving to 2027
IIR Energy compared the Feb. 1 calendar with Sept. 9: fall 2026 planned crude outages 144,000 barrels a day lower, fall 2027 283,000 barrels a day higher, with work at 10 crude units across seven refineries. Morgan Stanley’s Oct. 20 outlook has capacity sidelined for planned work 3.4 million barrels a day higher by 2Q27. Valero’s chief operating officer cited consultants putting about 1.5 million barrels a day of turnarounds deferred globally. The IEA puts global refining investment at just over $40 billion in 2026, about 15% below 2025, roughly half of it maintenance.
Gibson’s late-August report said the only confirmed turnaround on the PADD 3 slate was Exxon’s Beaumont facility, an FCC and at least two hydrotreaters running roughly 45 days from early December into mid-January. ExxonMobil is not idle: IIR tracked the 180,000 barrel-a-day Crude Unit A at Beaumont and the 108,000 barrel-a-day Crude Pipe Still 3 at Baytown in the first quarter.
The precedent: after a 24-week run above 95% in 1998, U.S. utilization fell to about 86% by mid-October as plants went into emergency maintenance. That is a precedent, not a forecast. Nor does everything get cut: inspection intervals under API 510, API 570 and API 653 carry legal and insurance consequences. What compresses is the opportunistic scope.
The honest counter-case
Chevron’s downstream chief told the Q3 call that more than 80% of its U.S. refinery turnarounds over the last two years finished with first-quartile duration, and that Pasadena’s debottlenecking added approximately 15% capacity at nominal cost. ExxonMobil reports turnaround costs down about 30% per asset and work 50% faster.
Those are real operational gains. Longer run lengths may be genuine engineering, and the 2027 bulge may be a planned cycle rather than a backlog. Public disclosure cannot distinguish genuine run-length extension from accumulated deferral. That is the honest finding: the question cannot be settled because the line does not exist.
Consumer and investor views
For a household, full-out refining cuts both ways. It buys supply: those Gulf Coast plants produced the second-highest volume of diesel on record. What it costs you is cushion. A system at 97.6% with 4% less capacity than in 2019 has nowhere to go but price when a compressor fails, and next autumn’s catch-up is when distillate tightens again. Woods said the quiet part out loud in August: “The utilization that we’ve seen can’t be sustained for the long term.”
For an investor, the tell is the capital line, not the earnings line. ExxonMobil generated $19.109 billion of free cash flow through nine months, returned $9.4 billion, cut net debt to $22.1 billion, $8 billion of it in the quarter, and pencilled in $20 billion of 2027 buybacks. Company-wide spending runs at 0.90 times depreciation, a whole-company ratio dominated by Upstream, not a refining measure.
If the per-asset gains are real, that harvest is sustainable. If they are partly deferral, the catch-up arrives as capex in 2027 and 2028, the same stretch when Morgan Stanley expects 3.4 million barrels a day of extra planned downtime.
What we could not verify, and what to watch
- The Q3 2026 Forms 10-Q were not on file. ExxonMobil’s latest is dated 3, 2026, Chevron’s Aug. 6. Watch them for maintenance language and subsequent events.
- No EIA statistic exists for average U.S. refinery age. The agency publishes none, so any “average refinery is 50-plus years old” figure belongs to trade press, not EIA.
- Utilization here covers five unblended scopes: EIA monthly U.S. 97.6% (August), EIA weekly U.S. 92.8%, Chevron U.S. crude 98%, ExxonMobil U.S. Gulf Coast crude units 100%, and ExxonMobil global fuels, lower and quoted excluding Middle East impacts.
- No summed annual maintenance figure appears here. If one is added, label it an Energy News Beat calculation.
- Marathon’s 2026 El Paso turnaround, about $130 million over 45 days with 206,000 work hours, is a trade estimate, not a filing.
| STU’S TAKE
Opinion. Every number is linked to its source. Two refineries outearned the oil wells that feed them, and the company will not tell you what it costs to keep those refineries running. That is the story. I have been around this industry long enough to be suspicious of a cost reduction that arrives in the same breath as a record run rate. ExxonMobil’s $2.006 billion of Energy Products capex against $11.372 billion of Energy Products earnings is not a scandal. It is a choice about where capital goes, and the answer is upstream, debt and buybacks. The part that should make you sit up is the calendar. 144,000 barrels a day of planned fall 2026 crude work moved, and 283,000 barrels a day of it now sits in fall 2027. Work does not evaporate. It waits, and it usually comes back bigger. I will not pretend the other side is empty. Chevron’s 80%-plus first-quartile turnaround durations and ExxonMobil’s 30% per-asset cost reduction are what good engineering looks like. If they have genuinely stretched run lengths, my worry is misplaced and the 2027 bulge is just a cycle. But you cannot tell from outside, because there is no maintenance line. Not in the release, not in the 10-K, not in the presentation. Valero tells you 86% of its quarterly capex was sustaining. ExxonMobil and Chevron tell you nothing. That asymmetry is the finding. So watch two numbers. When the 2027 capital plan lands in January, see whether downstream gets more than a rounding error. And when the fourth quarter prints, see whether the maintenance hit lands at the top of the $770 million to $1,030 million range. If both rise, the deferral was real and the bill is arriving.
|
Appendix
Sources, verbatim excerpts, data tables and methodology notes for “Exxon’s Refineries Outearned Its Oil Wells, and No One Will Say What Maintenance Costs.”
A. Sources (all accessed Oct. 30, 2026)
- ExxonMobil, “ExxonMobil announces third-quarter 2026 results,” press release, Oct. 30, 2026
- ExxonMobil, 3Q26 Supplement Data (PDF), Oct. 30, 2026
- ExxonMobil, 3Q26 Prepared Remarks (PDF), Oct. 30, 2026
- ExxonMobil, 3Q26 Earnings Presentation (PDF), Oct. 30, 2026
- ExxonMobil, 2025 Form 10-K, filed with the SEC Feb. 2026
- ExxonMobil, Form 10-Q for the quarter ended June 30, 2026, filed Aug. 3, 2026
- ExxonMobil, third-quarter 2026 earnings call transcript, Oct. 30, 2026 (roic.ai)
- Chevron, third-quarter 2026 earnings release, Exhibit 99.1 to Form 8-K, Oct. 30, 2026
- Chevron, 2025 Form 10-K, filed with the SEC Feb. 2026
- Chevron, third-quarter 2026 earnings call transcript, Oct. 30, 2026 (roic.ai)
- Reuters (Sheila Dang), “Exxon, Chevron earnings propelled by war-driven refining surge,” Oct. 30, 2026
- Reuters via Euronext, “ExxonMobil beats third-quarter profit estimates on refining boom,” Oct. 30, 2026
- Reuters (Ron Bousso), “Big Oil’s spending caution speaks louder than its profits,” Oct. 30, 2026
- S. EIA, Monthly Refinery Report, percent utilization of refinery operable capacity (MOPUEUS2), released Oct. 30, 2026
- S. EIA, Weekly U.S. refinery utilization (WPULEUS3), week ended Oct. 23, 2026
- S. EIA, Today in Energy, U.S. refining utilization analysis, Oct. 22, 2026
- S. EIA, Refinery Capacity Report, operable capacity by unit type, 2026
- International Energy Agency, World Energy Investment 2026, refining investment section
- IIR Energy, “Some US refiners deferring maintenance from 2026 to 2027,” Sept. 17, 2026
- IIR Energy, “US refineries prepare for maintenance ahead of a busy 2026,” Dec. 31, 2025
- Morgan Stanley research via EconoTimes, refinery outage outlook, Oct. 22, 2026
- Gibson Shipbrokers, “No Margin for Error,” Aug. 28, 2026
- Valero Energy, third-quarter 2026 earnings call transcript, Oct. 22, 2026
- Mansfield Energy, “Is the U.S. refining system being pushed too hard?” Sept. 3, 2026
- BIC Magazine, “Clock care: crack spreads,” maintenance and reliability
- Apollo Technical, “What is a refinery turnaround?” (citing AFPM)
- Energy Intelligence (Frans Koster), refining margins analysis, Oct. 29, 2026
- Reuters via The Phoenix Herald, “Exxon, Chevron see prolonged fuel price pressure,” Aug. 4, 2026
- ExxonMobil, “Reconfiguring for growth, leveraging the strength of integration,” Baytown, Aug. 26, 2025
- ExxonMobil, Corporate Plan Update, Dec. 9, 2025
- S. SEC EDGAR, ExxonMobil (CIK 34088) and Chevron (CIK 93410) filing indexes, accessed Oct. 30, 2026
- S. SEC EDGAR, Chevron Corporation (CIK 93410) filing index, accessed Oct. 30, 2026
B. Verbatim excerpts
ExxonMobil 3Q26 release, on the quarter’s refining performance: “strong operational performance including 100% crude unit utilization at our U.S. Gulf Coast refineries and the second-highest U.S. Gulf Coast diesel production on record.” Link
Prepared remarks, on the refining program: “That includes investing approximately $17 billion in refining since 2019 to expand capacity and improve product mix and profitability.” Link
Prepared remarks: “We’ve increased crude processing capacity by nearly 10% since 2019.” Link
Prepared remarks, on Gulf Coast distillate: “grown distillate production by approximately 40%” and “we anticipate these investments across the U.S. will increase distillate production by another 100 thousand barrels per day.” Link
Prepared remarks, on turnaround performance: “We’ve also improved turnaround performance, reducing costs by approximately 30% and completing work 50% faster than previous turnaround cycles.” Link
Prepared remarks, fourth-quarter outlook: “We expect scheduled maintenance to be higher than in the third quarter for Product Solutions, with a corresponding impact on operating performance.” Link
Presentation slide 20, footnote 5, defining the turnaround comparison: “Turnaround improvement based on comparison to prior cycle turnaround for the same asset.” Link
Darren Woods, Q3 call, on brownfield expansions: they “bring on capacity at half the cost, roughly, of grassroots facility.” Link
Darren Woods, Q3 call, on Beaumont: “In 2023, we completed a $2 billion expansion that added the equivalent of a medium-sized refinery. That investment paid for itself in about 3 years.” Link
Jim Chapman, Q3 call, on the December plan: “unlike the approach of the last several years, we do not plan to host a formal corporate plan update event in December.” Link
Darren Woods to CNBC on Aug. 4, as reported by Reuters: “The utilization that we’ve seen can’t be sustained for the long term. So I think this refining challenge is going to be with the world for a while.” Link
Ron Bousso, Reuters, Oct. 30: “it is telling that the majors’ dividend policies and capital spending plans have remained largely unchanged since the start of the war.” Link
Chevron vice chairman Mark Nelson, Q3 call: “More than 80% of Chevron’s U.S. refinery turnarounds over the last two years were completed with first-quartile duration.” Link
Nelson, Q3 call, on Pasadena: “we accelerated debottlenecking to increase refinery capacity by approximately 15% at nominal cost.” Link
EIA, Today in Energy, Oct. 22, 2026, as quoted: utilization “averaging more than 95% of capacity between May and September, the highest for those months since 1998.” Link
Gibson, Aug. 28, 2026: “The only confirmed turnaround on the PADD 3 slate is Exxon’s Beaumont facility, covering an FCC and at least two hydrotreaters, running for roughly 45 days from early December to mid-January.” Link
IIR Energy, Sept. 17, 2026, on the deferral: a “measurable uptick in maintenance deferrals.” Link
Valero, Q3 call, on sustaining capital: “Capital investments for the quarter were $432 million, with $371 million for sustaining operations.” Link
IEA, World Energy Investment 2026: refining investment will “drop to just over USD 40 billion, about a 15% decrease from 2025. About half of spending is for upgrades and greenfield projects, and the other half is for maintenance at existing facilities.” Link
C. Data tables
C1. ExxonMobil cash capital and equipment expenditures by segment, nine months 2026 versus nine months 2025 ($ millions)
| Segment | 9M 2026 | 9M 2025 | Change |
| Upstream United States | 10,820 | 12,233 | −1,413 |
| Upstream Non-U.S. | 5,825 | 6,043 | −218 |
| Upstream total | 16,645 | 18,276 | −1,631 |
| Energy Products United States | 1,386 | 463 | +923 |
| Energy Products Non-U.S. | 620 | 789 | −169 |
| Energy Products total | 2,006 | 1,252 | +754 |
| Chemical Products | 736 | 845 | −109 |
| Specialty Products | 221 | 316 | −95 |
| Corporate and Financing | 368 | 445 | −77 |
| Worldwide total | 19,976 | 21,134 | −1,158 |
Source: ExxonMobil 3Q26 Supplement Data.
C2. The four percentages in the article, shown step by step
| Ratio | Numerator | Denominator | Result |
| Energy Products share of cash capex | $2,006M | $19,976M | 2,006 ÷ 19,976 = 0.10042 = 10.0% |
| Energy Products share of earnings | $11,372M | $34,121M | 11,372 ÷ 34,121 = 0.33329 = 33.3% |
| Upstream share of cash capex | $16,645M | $19,976M | 16,645 ÷ 19,976 = 0.83325 = 83.3% |
| Upstream share of earnings | $20,752M | $34,121M | 20,752 ÷ 34,121 = 0.60818 = 60.8% |
| Chevron downstream share of capex | $653M | $12,612M | 653 ÷ 12,612 = 0.05178 = 5.2% |
| Chevron downstream share of earnings | $8,982M | $24,206M | 8,982 ÷ 24,206 = 0.37106 = 37.1% |
| U.S. Energy Products capex growth | $1,386M − $463M | $463M | 923 ÷ 463 = 1.994 = +199% |
| Energy Products capex change, 2025 vs 2024 | $1,707M − $2,218M | $2,218M | −511 ÷ 2,218 = −0.2304 = −23.0% |
| Energy Products share of 2025 company capex | $1,707M | $28,997M | 1,707 ÷ 28,997 = 0.05887 = 5.9% |
| Energy Products share of 2024 company capex | $2,218M | $25,647M | 2,218 ÷ 25,647 = 0.08648 = 8.6% |
| Chevron downstream capex change, 2025 vs 2023 | $928M − $1,773M | $1,773M | −845 ÷ 1,773 = −0.4766 = −47.7% |
| Company capex as a multiple of DD&A | $19,976M | $22,263M | 19,976 ÷ 22,263 = 0.8973 = 0.90x |
| Valero sustaining capital share of quarterly capex | $371M | $432M | 371 ÷ 432 = 0.8588 = 86% |
Sources: ExxonMobil 3Q26 Supplement Data, ExxonMobil 2025 Form 10-K, Chevron 3Q26 release, Chevron 2025 Form 10-K, Valero Q3 call. All ratios are Energy News Beat calculations from the companies’ published line items. DD&A is depreciation, depletion and amortization for the nine months ended Sept. 30, 2026.
C3. Product Solutions scheduled-maintenance estimated earnings impact by quarter ($ millions)
| Segment | 4Q25 | 1Q26 | 2Q26 | 3Q26 | 4Q26e |
| Energy Products | 230 | 680 | 770 | 590 | 770–1,030 |
| Chemical Products | 170 | 120 | 170 | 140 | (in range) |
| Specialty Products | 40 | 20 | 30 | 30 | (in range) |
| Product Solutions total | about 440 | about 820 | about 970 | about 760 | 770–1,030 |
| Upstream, for reference | 260 | 150 | 260 | 290 | 180–260 |
Source: ExxonMobil 3Q26 Earnings Presentation, slide 20, “4Q26 maintenance outlook.” The 4Q26e column is company guidance, based on mid-October refining margins, forward estimates and operating expenses related to turnaround and planned maintenance activities (footnote 2). These are estimated earnings impacts, not spending figures, and are not comparable to a maintenance budget.
C4. U.S. refinery utilization by month, percent of operable capacity
| Month | 2024 | 2025 | 2026 |
| January | 86.1 | 87.1 | 91.4 |
| February | 82.7 | 85.2 | 89.0 |
| March | 88.7 | 89.5 | 91.6 |
| April | 89.5 | 90.8 | 90.1 |
| May | 93.5 | 94.3 | 94.0 |
| June | 94.2 | 95.6 | 96.5 |
| July | 92.4 | 95.8 | 96.5 |
| August | 94.0 | 95.4 | 97.6 |
| September | 90.4 | 93.2 | not yet published |
| October | 89.7 | 88.1 | not yet published |
| November | 91.6 | 93.4 | not yet published |
| December | 93.0 | 95.7 | not yet published |
Source: U.S. EIA, Monthly Refinery Report, series MOPUEUS2, released Oct. 30, 2026. September through December 2026 had not been published at the time of writing.
C5. U.S. refining capacity by unit type, latest annual report versus the prior year (barrels per calendar day)
| Unit type | Prior year | Latest | Change | Percent |
| Crude distillation | 18,423,493 | 18,160,493 | −263,000 | −1.43% |
| Coking | 2,937,715 | 2,793,645 | −144,070 | −4.90% |
| Hydrotreating | 17,440,634 | 17,002,116 | −438,518 | −2.51% |
| Fluid catalytic cracking | 5,491,059 | 5,334,708 | −156,351 | −2.85% |
| Operating refineries (count) | 132 | 130 | −2 | −1.52% |
Source: U.S. EIA, Refinery Capacity Report. Percent changes computed by Energy News Beat from the published capacity totals.
C6. Chevron downstream cash capital spending, full years ($ millions)
| Year | Downstream capex | Company total capex | Downstream share |
| 2023 | 1,773 | — | — |
| 2024 | 1,694 | — | — |
| 2025 | 928 | — | — |
| 9M 2026 | 653 | 12,612 | 5.2% |
Source: Chevron 2025 Form 10-K for the full-year figures; Chevron 3Q26 release for nine months 2026. Chevron does not publish a downstream sustaining-capital split.
D. Background and methodology
Scope. This article covers ExxonMobil’s and Chevron’s third-quarter 2026 results, both released Oct. 30, 2026, and the refining maintenance question that follows from them. ExxonMobil reports refining inside its Energy Products segment, which also includes fuels marketing, trading, aromatics and catalysts and licensing. Segment earnings are therefore not a pure refining number, and the article says so.
The refining-versus-drilling comparison is a same-column comparison of segment earnings in the third quarter: Energy Products $7,169 million against Upstream $7,088 million, a difference of $81 million, both from the 3Q26 Supplement Data. Reuters reported Oct. 30 that this was the first time in at least six years that ExxonMobil earned more from refining than from upstream. Chevron’s third-quarter downstream earnings also reached their highest point over the same six-year span.
Utilization scopes. Five separate measures appear in this article and are never blended: the EIA monthly survey (97.6% in August 2026), the EIA weekly survey (92.8% for the week ended Oct. 23, 2026), Chevron’s U.S. crude utilization (98%), ExxonMobil’s U.S. Gulf Coast crude unit utilization (100%, crude units only), and ExxonMobil’s global fuels utilization, which the company describes as a record year to date excluding Middle East impacts and which the article does not quantify.
Turnaround costs. The approximately 30% cost reduction and 50% faster completion are per-asset, like-for-like comparisons against the prior cycle turnaround for the same asset, per footnote 5 of the 3Q26 Earnings Presentation. They are not a 30% reduction in a maintenance budget, and the article does not present them that way.
Maintenance estimates. The $770 million to $1,030 million fourth-quarter figure is an estimated earnings impact, not capital spending. It combines the Energy Products, Chemical Products and Specialty Products segments, as shown on slide 20 of the presentation.
Disclosure. Neither company publishes a maintenance, sustaining-capital or turnaround-spend line in any document reviewed: the 3Q26 release, prepared remarks, presentation, supplement, the 2025 Form 10-K, or the Q2 2026 Form 10-Q. The Q3 2026 Forms 10-Q were not on file as of the evening of Oct. 30, 2026; EDGAR showed ExxonMobil’s most recent 10-Q dated Aug. 3, 2026 and Chevron’s dated Aug. 6, 2026.
Precedent. The 1998 episode is offered as a historical precedent, not a forecast. After a 24-week run above 95% utilization, U.S. utilization fell to about 86% by mid-October as facilities went into emergency maintenance, per Mansfield Energy.
What could not be verified
- A published maintenance, sustaining-capital or turnaround-spend total for either company. None exists in the documents reviewed, which is the point of the article.
- Any EIA statistic on the average age of a U.S. refinery. EIA publishes none, so no such figure is attributed to the agency here.
- A company-stated global fuels utilization percentage for ExxonMobil. The company describes a record year to date excluding Middle East impacts without giving a number, so none is given.
- A cost or timeline for the additional 100,000 barrels a day of U.S. distillate capacity, or for the Baytown reconfiguration. Neither has been disclosed.
- Whether the 2027 turnaround bulge reflects genuine run-length limits or accumulated deferral. Public disclosure cannot distinguish the two, which is the honest finding of the piece.
- A verbatim transcript of Valero’s third-quarter call. The only record reached was an AI-written summary, so Valero’s deferral comment is paraphrased and attributed rather than set as a direct quotation.
- A barrel-per-day capacity figure for the Marathon El Paso unit. The trade report gives 206,000 work hours over roughly 45 days, which is what the article uses; the cost is a trade estimate, not a filing.