
Virginia’s new Energy Plan promises to protect family budgets but never shows a household bill. It models 10,000 MW of import capacity, while PJM lists 5,992 MW; prices solar 41% below Dominion’s own filing; and leaves about $40.6 billion of Dominion spending outside the proposed rate freeze. Here are the six biggest holes. The full Research Desk deep dive is in our paid Substack Research section.
It is taking me much longer to go through the details the research team put together. We will have all those links and a longer document in the Research tab over the weekend. It is a mountain of data for me to go through, and the math in their report ain’t adding up, as we say in Texas.
Virginia’s 2026 Energy Plan closes its modeling chapter with a promise: its analysis “demonstrates how Virginia can meet this moment in a way that protects the wallets of Virginia families and small businesses” (p.100). Go looking for the wallet. In 155 pages, ENB found no pathway turned into a monthly bill or rate path (ENB analysis).
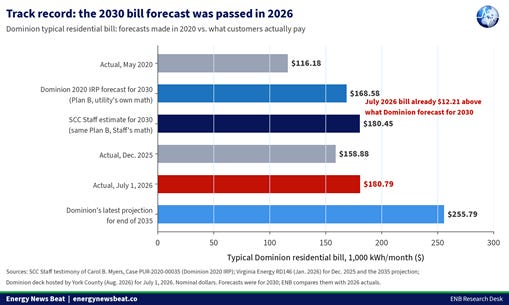
Meanwhile, the real bill is already moving. Dominion’s typical 1,000-kWh residential bill was $180.79 on July 1, 2026 (Dominion presentation hosted by York County). That is already above the $168.58 Dominion told regulators to expect in 2030 (SCC Staff). EIA data put Virginia’s average price up 16.0% for January–July 2026 versus the same months of 2025 (EIA Form 861M; ENB calculation).
The ENB Research Desk checked the plan’s inputs against PJM, EIA, SCC, and Dominion data. Here are the six biggest holes. The full 20-page review is for paid subscribers in Energy News Beat Research on Substack. We will have that available soon. Still working on it.
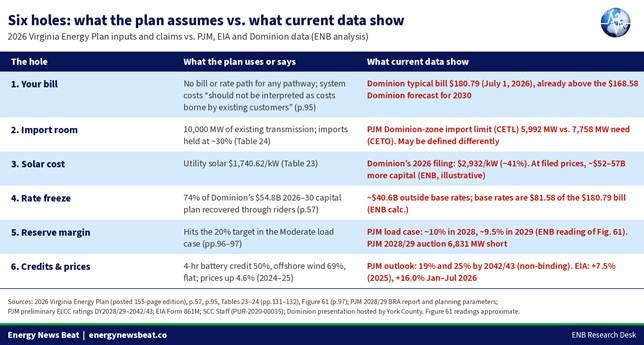
The plan’s headline numbers are direct system costs through 2050: $295 billion with No Policy, $422 billion under Current Policies and $385 billion for its preferred “Distributed Flexibility” path (Table 16, p.90). The plan itself warns these “should not be interpreted as costs borne by existing customers” (p.95). They leave out utility return on equity, federal tax credits and “the full cost of transmission” (p.130), and the plan never says whether they are nominal, inflation-adjusted or discounted.
ENB analysis: so nobody, governor or critic, can turn these totals into dollars per household. The preferred path costs $90 billion more than No Policy and wins on “total cost” only after $285 billion of carbon damages and $145 billion of health damages are added to No Policy (Table 16, p.90).
Hole 2: 10,000 MW of import room vs. PJM’s 5,992 MW
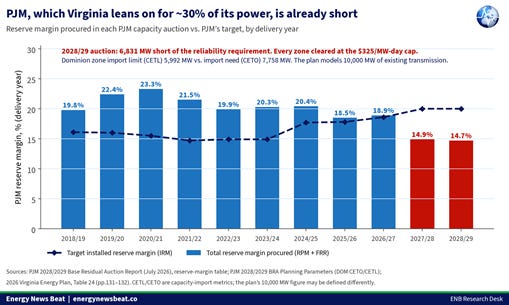
Virginia imported 30.6% of its power in 2024 (EIA). The model caps imports at 30% and assumes “10,000 MW existing transmission capacity in 2025; 10,000 MW of interstate transmission added by 2035” (Table 24, pp.131–132). PJM’s 2028/29 auction parameters put the Dominion zone’s capacity import limit (CETL) at 5,992 MW against an import need (CETO) of 7,758 MW (PJM). The plan concedes that “Virginia’s import demand will exceed its physical transmission capacity by 2028” (p.29).
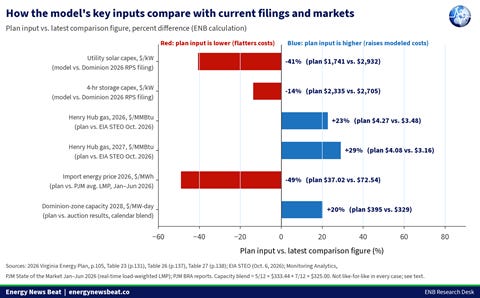
ENB analysis: the plan prices imported power at $37.02/MWh for 2026–2027 (Table 27, p.138), while PJM’s real-time load-weighted price averaged $72.54 in January–June 2026, a period that included a January spike (Monitoring Analytics). In fairness, CETL measures deliverable emergency capacity, not total line ratings, so the plan’s 10,000 MW may be defined differently. The plan does not say, and it gives no cost for the new 10,000 MW.
Hole 3: Solar priced 41% below Dominion’s own filing
The model prices utility solar at $1,740.62/kW and 4-hour storage at $2,334.94/kW (Table 23, p.131). The same plan reports that Dominion’s 2026 RPS Development Plan proposed $2,932/kW for utility-scale solar and $2,705/kW for storage (p.105).
ENB analysis: that is 41% lower for solar and 14% lower for storage. At Dominion’s filed prices, the solar-and-storage build would cost about $52 billion more in overnight capital under Current Policies and $57 billion more under Distributed Flexibility. That widens the gap with No Policy by roughly $43–48 billion. This is illustrative, with no financing, timing or tax effects. To be fair, the plan argues Dominion’s prices are high and cites a DOE average of $1,800/kW (p.105). Its fix, competitive state-run or state-informed solicitations, is a recommendation, not a result.
Hole 4: About $40.6 billion rides outside the rate freeze
The plan reports that Dominion “expects 74% of its $54.8 billion capital plan for 2026–2030 to be recovered through riders” (p.57). ENB analysis: that is about $40.6 billion outside base rates; only about $14.2 billion flows through base rates.
The governor’s Oct. 19 merger testimony asks for no base-rate increase for three biennial reviews, saying any increase “must be deferred” (testimony). That is an ask in a pending case, not an order. On the July 1 bill, base rates were $81.58 of $180.79; fuel and riders were $99.21 (Dominion/York County; ENB calculation). Most of the plan’s build-out would flow through riders, and deferred base increases still come due later.
Hole 5: Reserve margins near 10% vs. a 20% target
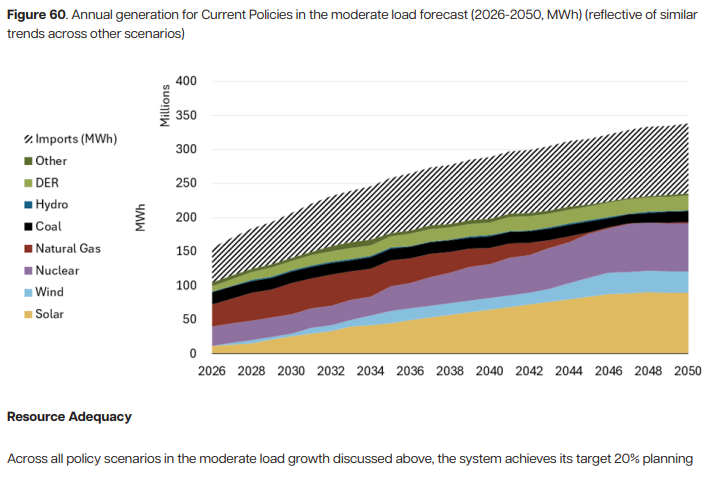
In the plan’s central “Moderate” load case, every pathway meets the 20% planning reserve margin (pp.96–97). That case assumes a 2050 peak 18.9% below the PJM-based High case (55,823 MW vs. 68,850 MW) (p.85). If all PJM-forecast load shows up, the plan says Current Policies leaves “resource adequacy a challenge in the near-term and long-term” (p.97).
ENB analysis: the plan’s Figure 61 (p.97) has no data table. ENB’s reading: under PJM’s high load forecast, No Policy and Current Policies drop to about 10% in 2028 and 9.5% in 2029, recover to about 20% in 2030, dip to about 15% in 2032 and reach 20% by 2034. Current Policies, today’s law, then falls to about −3% in 2046; Distributed Flexibility stays near 20%. PJM’s 2028/29 auction came up 6,831 MW short of its reliability requirement, with every zone at the $325/MW-day cap (PJM). That is RTO-wide, not Virginia, but it is the market the plan leans on for 30% of the state’s power.
Hole 6: Flat capacity credits and stale prices
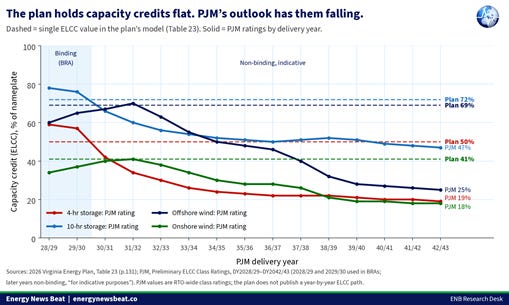
The model uses one capacity credit (ELCC) per technology through 2050: 50% for 4-hour batteries, 69% for offshore wind and about 9% for solar (Table 23, p.131; p.82). PJM’s indicative ratings take 4-hour storage to 19% and offshore wind to 25% by 2042/43 (PJM). ENB analysis: for the Distributed Flexibility build, that is roughly 6.4–8.0 GW less accredited battery capacity and about 3.5 GW less from offshore wind, which would have to be replaced at a cost the plan does not show. In fairness, PJM’s current binding 4-hour ratings (57–59%) are above the plan’s 50% (PJM 2028/29); the gap opens in PJM’s non-binding outlook after 2030.
Prices: the plan says average retail prices grew 4.6% from 2024 to 2025 (p.55). EIA shows +7.5% nominal in 2025, and +16.0% for January–July 2026 (residential +13.1%, commercial +21.4%) (EIA-861M; ENB calculation). ENB could not reproduce 4.6%. Some inputs cut the other way: the plan’s 2026 gas price, $4.27/MMBtu, is above EIA’s $3.48 forecast (EIA STEO), and its 2028 Dominion-zone capacity price is about 20% above recent auctions (PJM). Both raise costs most for gas-heavy No Policy. The plan tests none of these inputs against current data.
What consumers and investors are saying
Consumers. In VCU’s Summer 2026 Commonwealth Poll, cost of living was the top issue and 81% backed requiring data centers to pay extra fees to offset their electricity demand (VCU Wilder School). In an Embold Research poll for the Virginia Distributed Solar Alliance, a clean-energy group, close to two-thirds of voters said their bills are too high, and “Guarantee that customer rates will not rise” ranked first among merger conditions (VCIJ at WHRO).
Lawmakers. House Minority Leader Terry Kilgore: “By their own math, meeting Virginia’s power needs will be more than $100 billion cheaper” without the Clean Economy Act and RGGI (VPM). The plan’s gap is $127 billion in system cost, not bills (ENB calculation). Sen. Glen Sturtevant said the plan would “carpet Virginia with another 300,000 acres of solar panels” (VPM); the plan’s highest estimate is 277,000 acres (Table 20, p.98). Sen. Mark Obenshain called the social-cost figures “wildly speculative assumptions” (Cardinal News).
Utilities and investors. Dominion spokesperson Jeremy Slayton: “Meeting the demand will require an all-of-the-above approach” (VPM). NextEra’s Neil Nissan says the merger brings “more than $2.1 billion in near-term direct customer and community benefits” (WTVR). Dominion booked a $246 million net charge in Q2 2026 for offshore wind costs it does not expect to recover from customers (10-Q). ENB analysis: for investors, riders are where most of the $54.8 billion gets recovered, and PJM says its 2028/29 auction would have cleared at $554.72/MW-day without the cap (PJM).
Stu’s Take (opinion of Stu Turley, Energy News Beat)
I give Virginia Energy credit for writing down its caveats. But families don’t pay “system costs.” They pay a bill, and Dominion’s typical bill is already $180.79 a month. That is past the $168.58 Dominion told regulators to expect in 2030. A plan that promises to protect wallets and never shows a bill hasn’t done its job.
Look at what holds up the cheap path. Batteries count at a 50% capacity credit when PJM’s outlook says 19% by 2042/43. The model assumes 10,000 MW of import room when PJM lists 5,992 MW for the Dominion zone. Solar is priced at $1,741/kW when Dominion filed $2,932. It builds 1,800 MW of solar a year when Virginia’s best year ever was 999 MW. Under PJM’s load forecast, the plan’s own chart shows current law sliding to about a 10% reserve margin in 2028, half the 20% target, while PJM just came up 6,831 MW short. That’s not a reliability plan. That’s a hope.
I’m all for freezing base rates. But 74% of Dominion’s $54.8 billion capital plan, about $40.6 billion, runs through riders, and base rates are only $81.58 of the bill. Freeze the small part and the big part keeps climbing. Virginia prices are already up 16% for January–July.
To be fair, the plan admits No Policy has the lowest system cost, $295 billion, and the “$100 billion cheaper” line treats system costs as bills too. Both camps should stop. Put the bill on page one, rerun the model with PJM’s declining credits, real import prices and Dominion’s real bids, and publish it. Until then, the $37 billion in “savings” is a talking point, not a promise to your wallet.
In the Virginia plan, look at the import volumes and the plan to eliminate natural gas and rely on imports, solar, and nuclear. Coal is projected to run longer than natural gas, and relying on solar at scale, without replacing aging panels each year, is a gigantic number missing from the plan.
With Governor Spanberger’s Net Zero push, what is to stop her from dismantling the coal power supply like Germany in hopes that wind or solar would step up?
The math does not add up in the state’s long-term planning. Imports will rely on other states indefinitely.
Get the full Virginia Energy Plan deep dive – out over the weekend or by Monday.
This cover story is the short version. The full ENB Research Desk review, “Inside the 2026 Virginia Energy Plan: What the Model Assumes, and What It Leaves Out,” is for paid subscribers in Energy News Beat Research on Substack, next to our Bloom Energy deep dive: theenergynewsbeat.substack.com/s/research
• Cost per reliable kilowatt for 11 technologies, on the plan’s capacity credits and on PJM’s
• The data-center revenue math (20 GW in the plan vs. “23 gigawatts” in the governor’s testimony)
• Land, heat-pump and RGGI-credit claims checked, plus the internal inconsistencies we found
• Dominion’s forecast track record, full data tables, ENB calculations and the questions we are putting to Virginia Energy