


Looking at the nuts and bolts, we see that the spending goes on, even if the mood is ultra-sour.
By Wolf Richter for WOLF STREET.
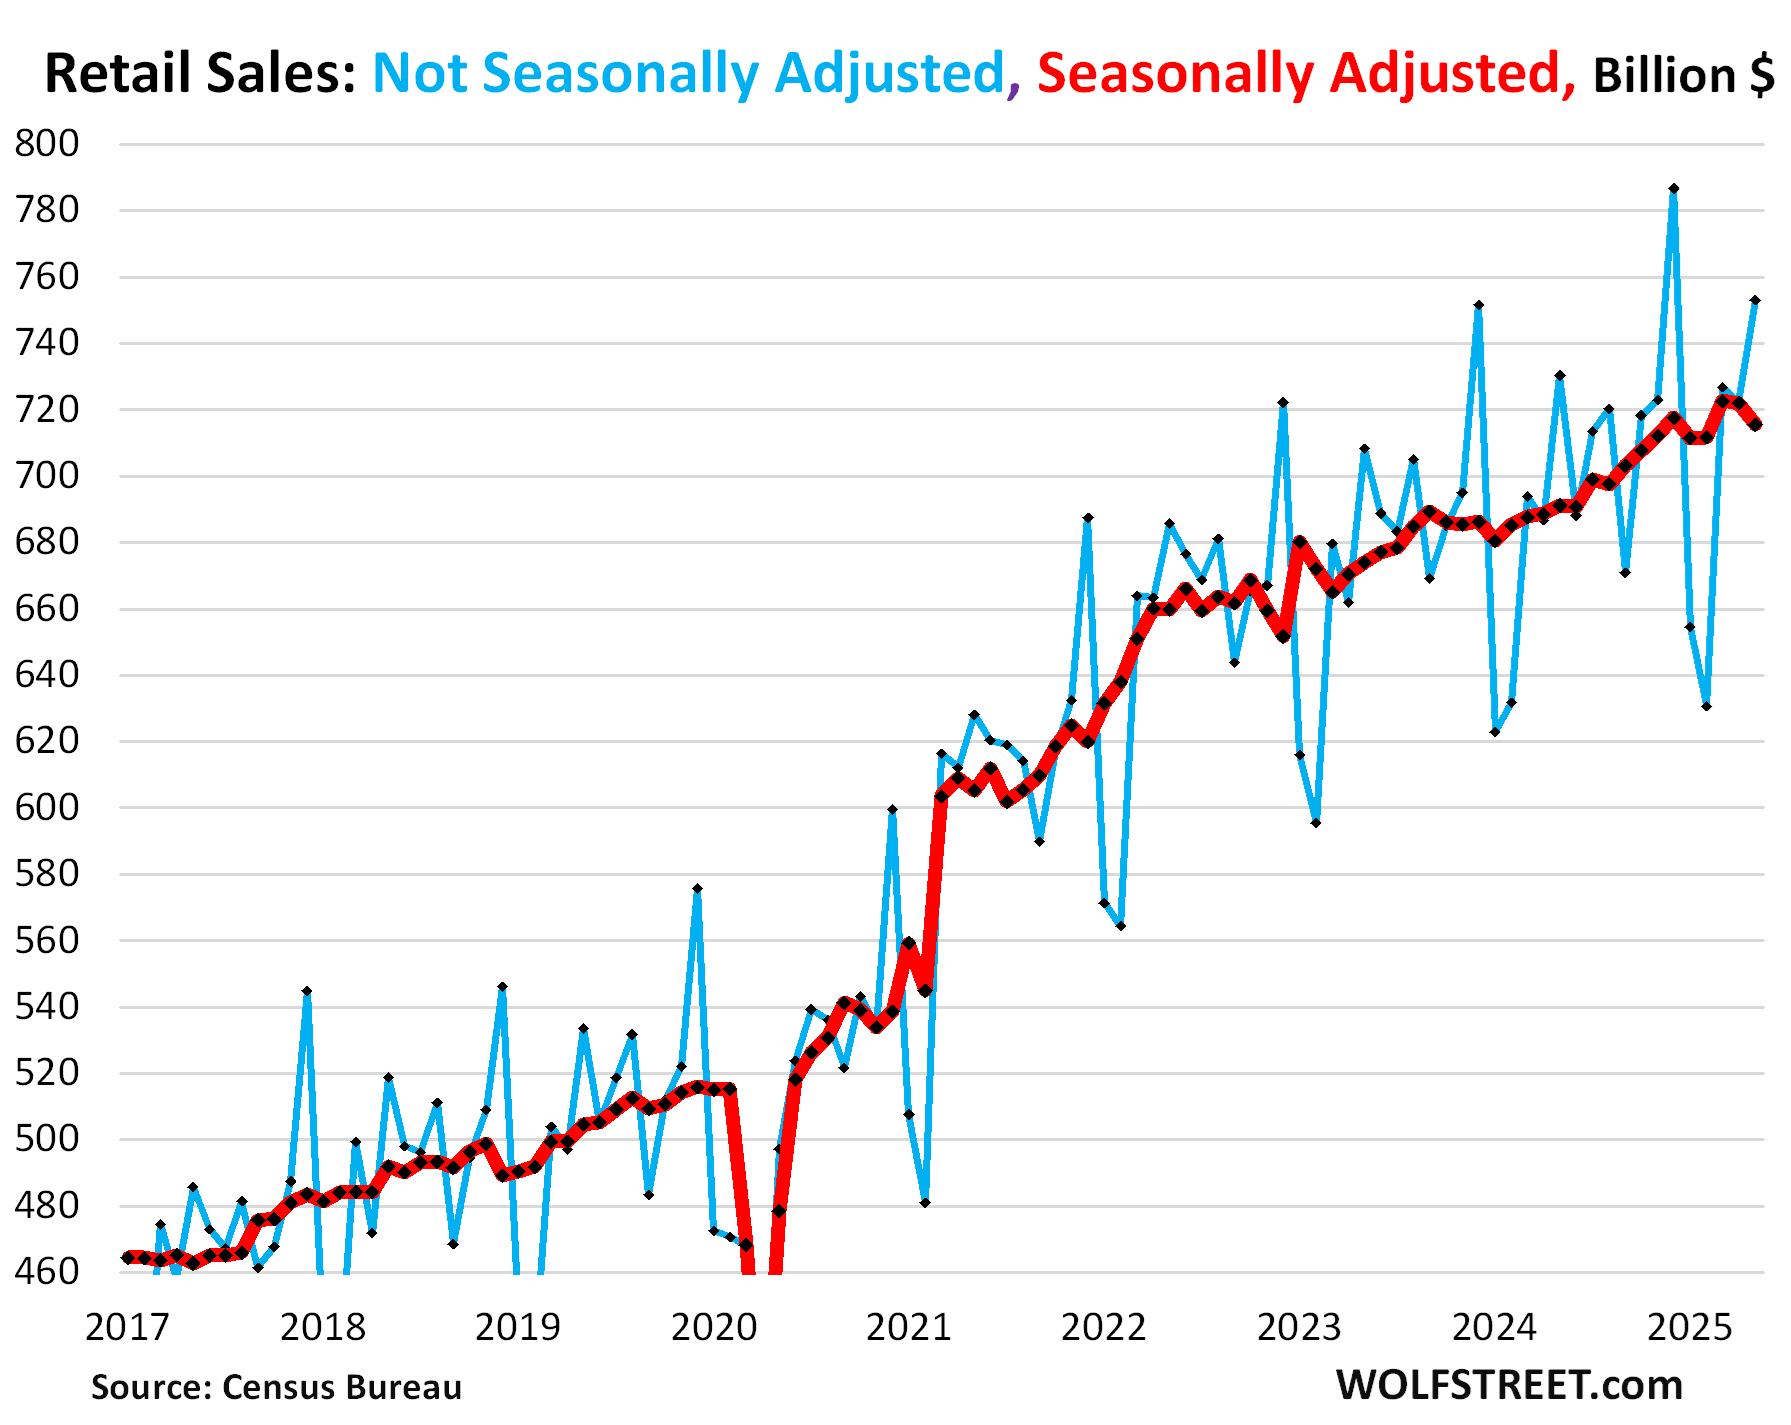
Retail sales in May, seasonally adjusted, fell by 0.9% from April, and in April they’d dipped a hair from March, but in March they’d spiked by 1.5% from February (red in the chart). So, compared to February, retail sales in May were up by 0.5%. Year-over-year retail sales were up by 3.5%.
Not seasonally adjusted, retail sales jumped by 4.3% in May from April, to $753 billion, the second-highest ever, behind only December 2024 (blue in the chart). Year-over-year, they were up by 3.1% from May 2024.
Seasonal adjustments include an adjustment for the number of “selling days.” In May 2025, there was one more selling day (27 days) than in May 2024 (26 days). So seasonal adjustments subtracted that extra selling day compared to May a year ago. Which is one of the reasons seasonal adjustments were a little harsh in May. But ecommerce retailers, restaurants, and many other retailers were open seven days a week, including Memorial Day, so they were open 31 days in May, same as last year, and these seasonal adjustments can get confusing and uncertain quickly.
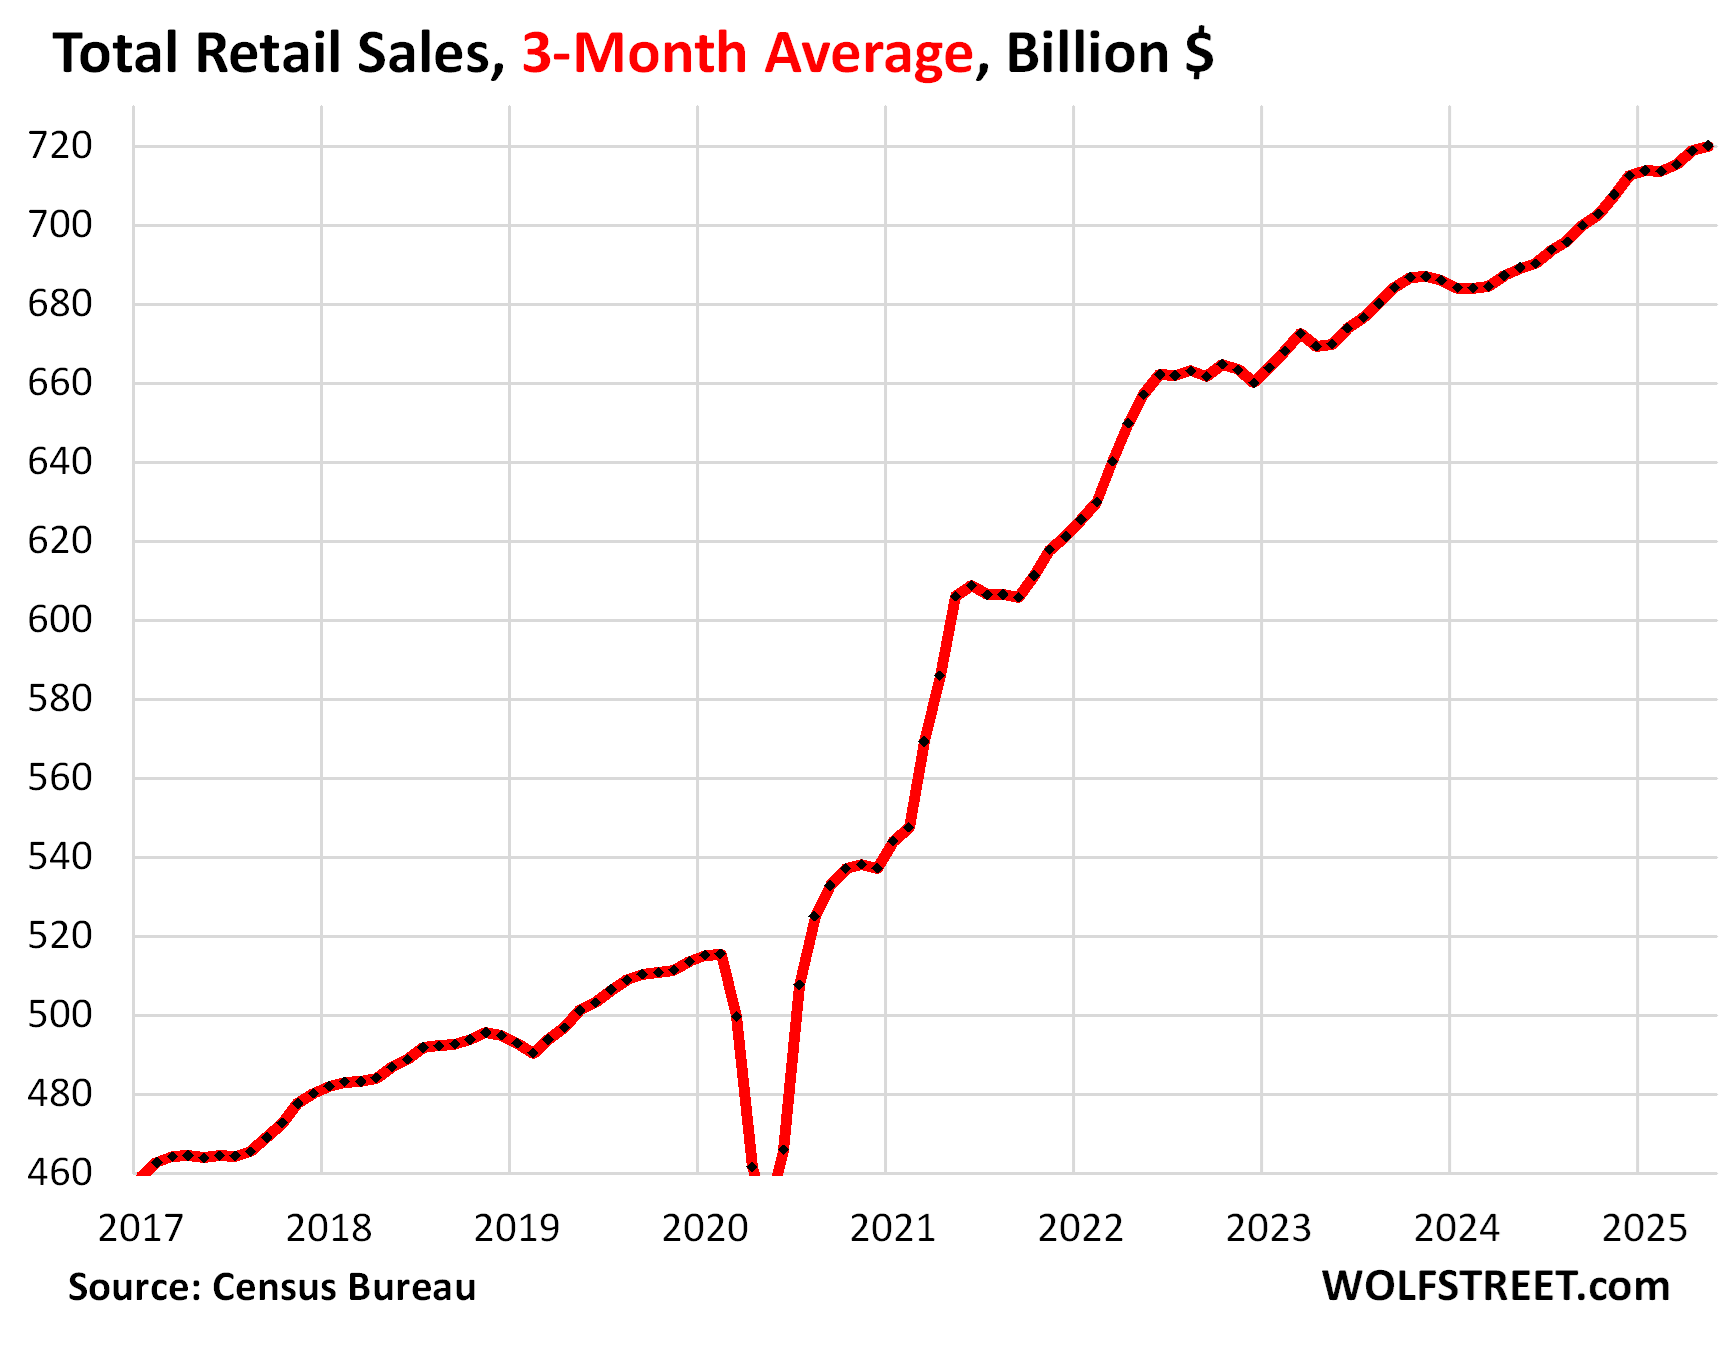
The three-month moving average cancels out the month-to-month squiggles and a portion of the seasonal adjustments including those dealing with calendar shifts.
For May, the three-month average – the average of the month-to-month spike in March, the dip in April, and the drop in May – rose by 0.2%, seasonally adjusted.
Note the declines in this trend in late-2023/early-2024, in late 2022, and in the summer of 2021. But not this year so far – though it’s not exactly stellar growth either.
Each of the big categories of retailers has sales dynamics that are different from the others, and so we look at them separately.
New and used vehicle dealers and parts stores (#1 retailer category, 19% of total retail sales):
Not seasonally adjusted, sales fell for the second month in a row, to $146 billion, from the record spike in March, but were still the third-highest level of sales ever, behind only March and April, and up by 2.4% from a year ago.
Seasonally adjusted, sales fell by 3.5% in May from April, but were up by 3.2% from May last year.

March is always one of the best months of the year for vehicle sales – it’s tax refund season and tax refunds were big this year – but this March showed an even bigger jump than normal from February and January, in part because harsh winter weather early in the year had caused people to stay home, and when the sun came out in March, they went shopping.
The other reason cited was the hype about the tariffs, and some people might have tried to speed up their purchases and bring them into March to front-run any effects from the tariffs. But so far, those tariff-effects on prices have remained elusive, and maybe people smartened up and quit chasing after hype?
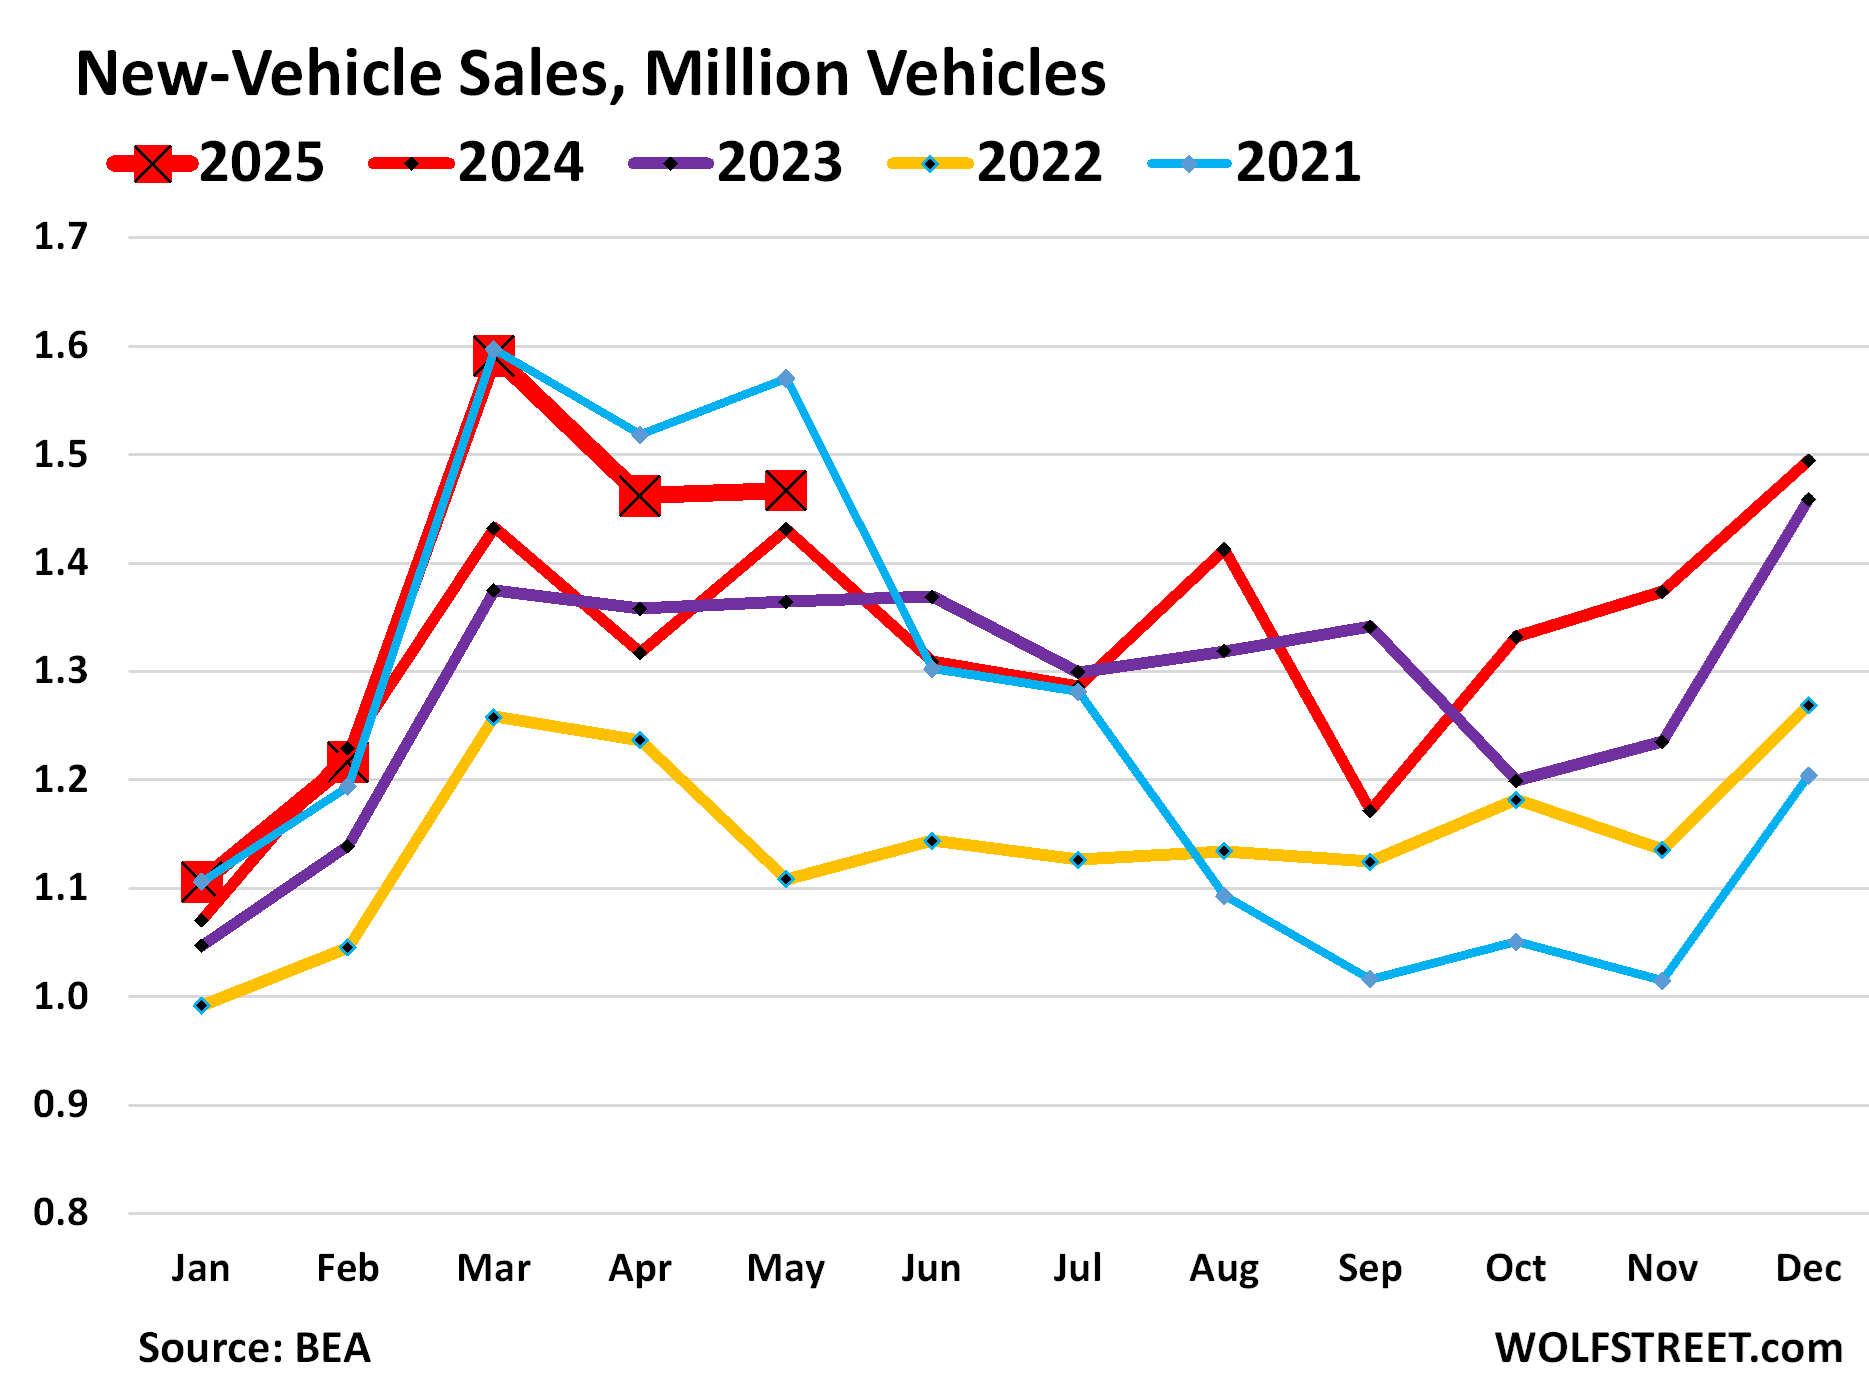
In terms of new-vehicle unit sales, it had been a huge March, followed by a solid April and May, all three of them the best since 2021, according to data from the Bureau of Economic Analysis earlier in June, based on data from automakers, not surveys of retail stores.
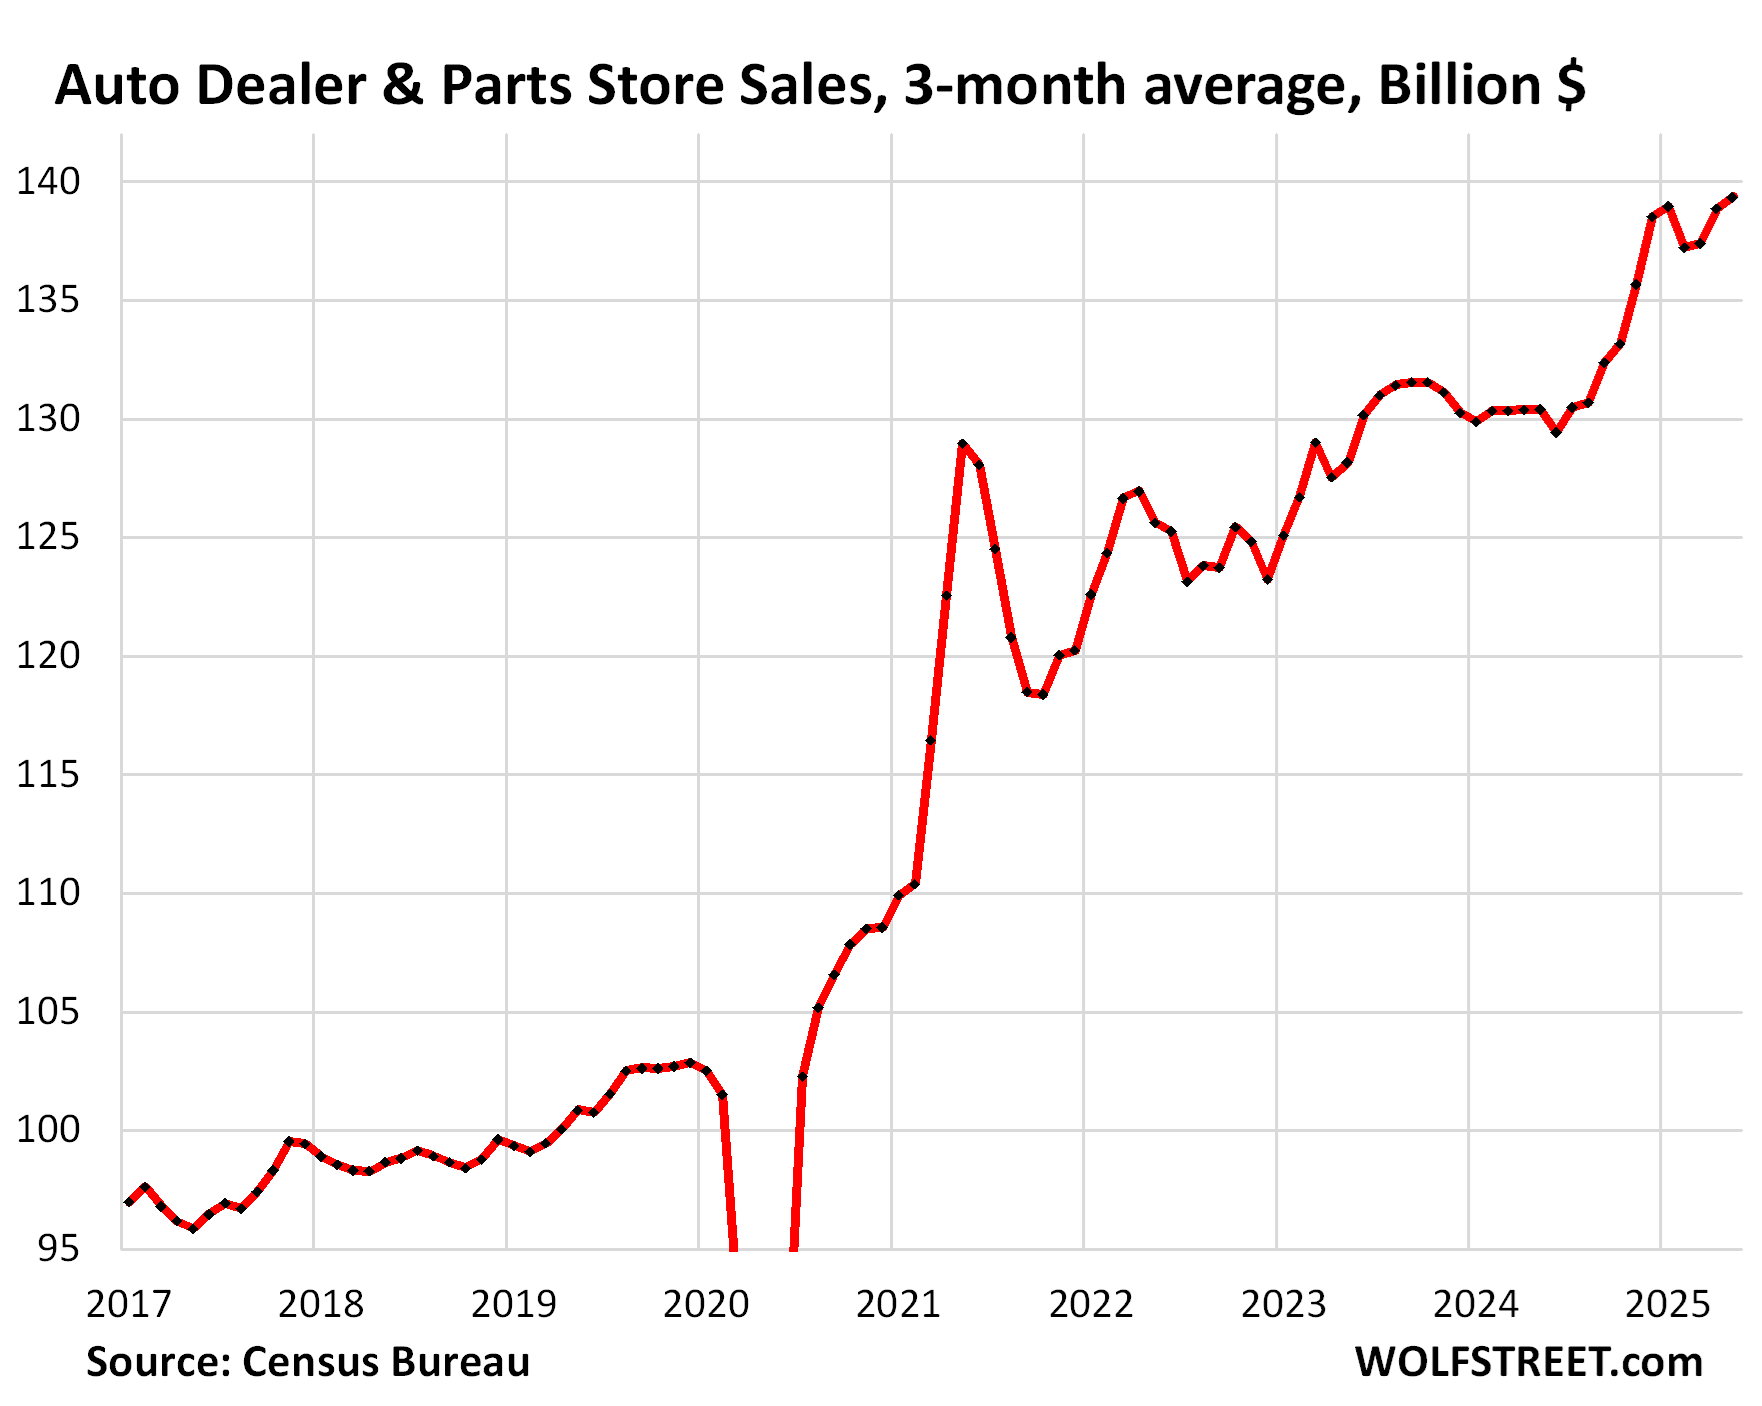
Back to dollar-sales: The three-month average of retail sales at auto dealers and parts stores rose by 0.34% (+4.2% annualized) in May from April, to a new record of $139 billion, seasonally adjusted, up 6.9% from a year ago.
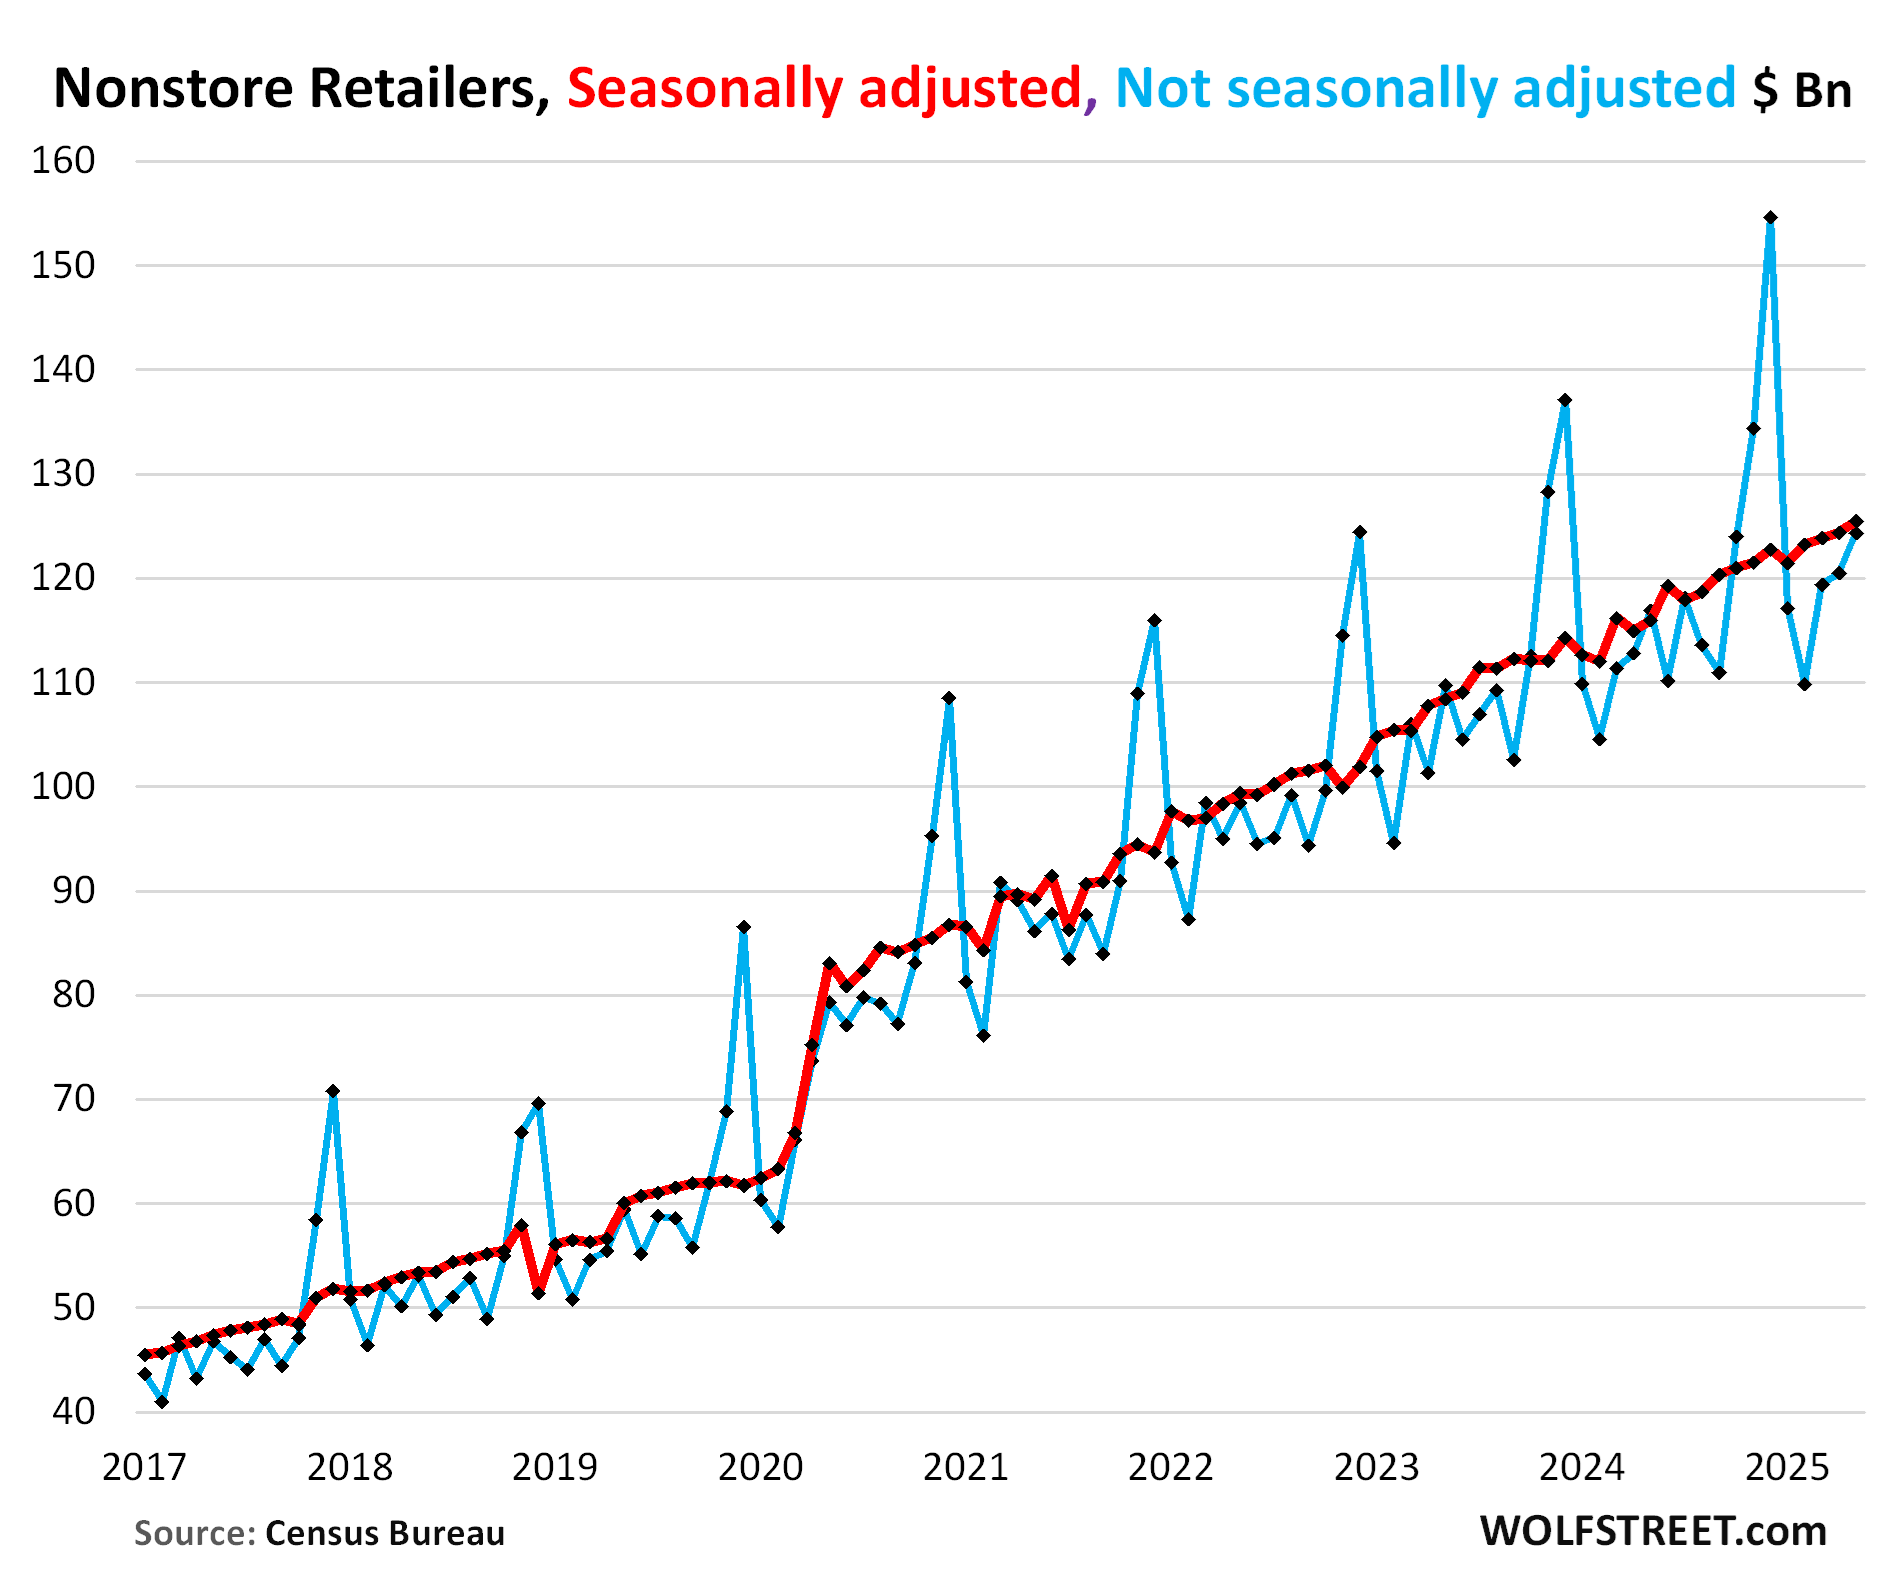
Ecommerce and other nonstore retailers (#2 retailer category, 17% of total retail sales):
Not seasonally adjusted, sales jumped by 6.3% year-over-year to $124 billion.
Seasonally adjusted, sales jumped by 0.9% in May from April, and by 8.2% year-over-year.
There is no sign of weakness here, just growing at a solid pace, tariffs or no tariffs.
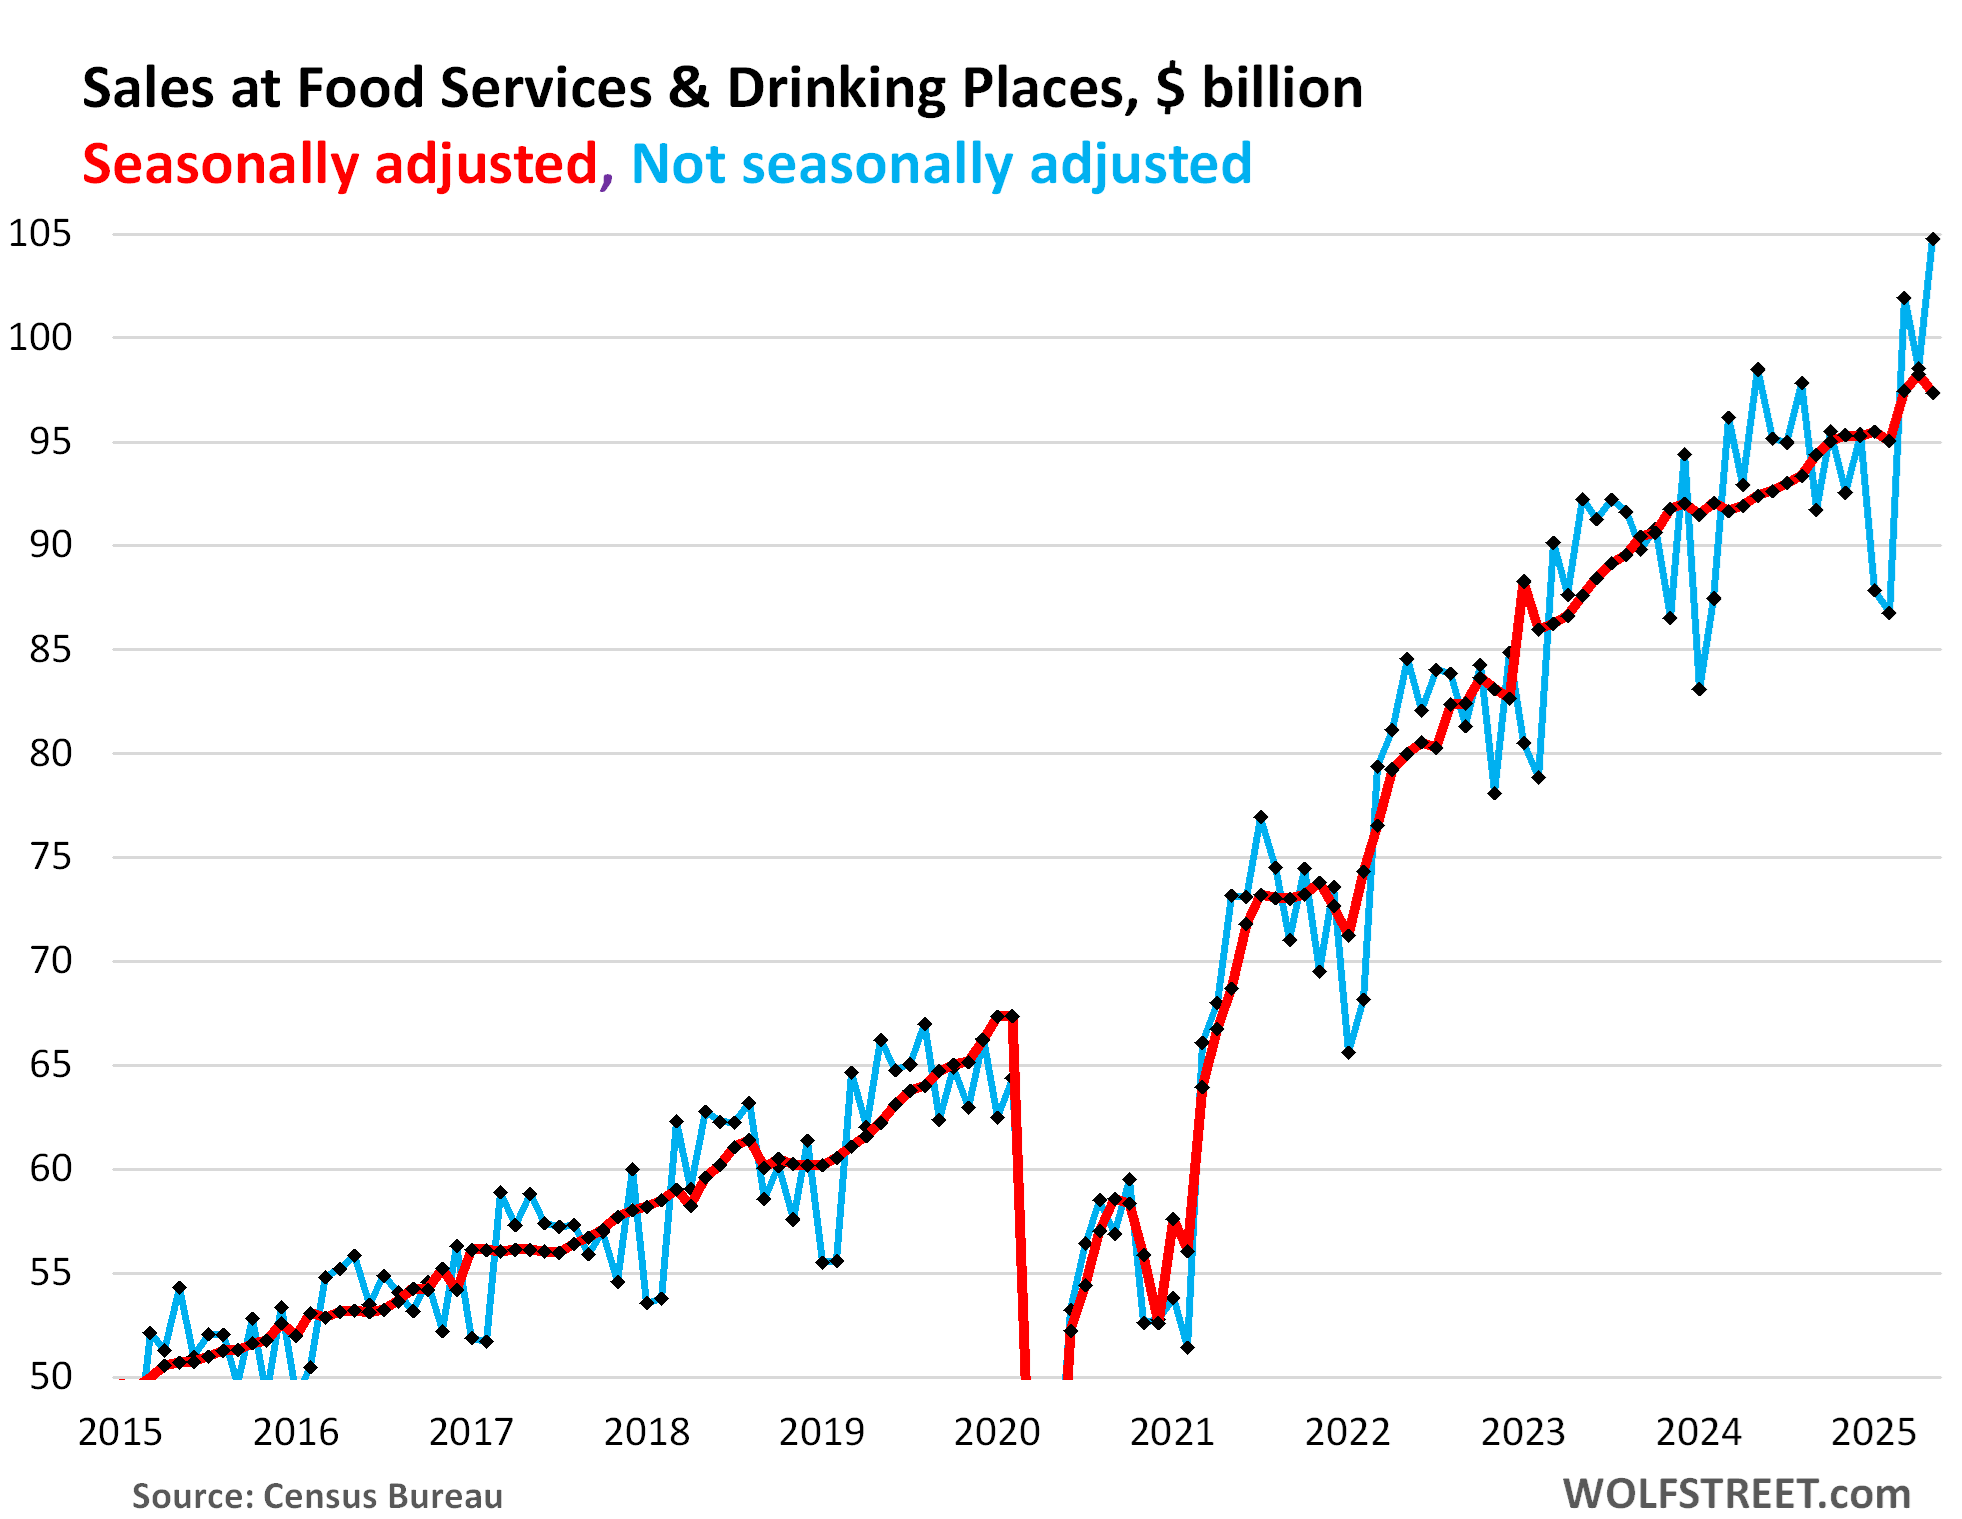
Food services and drinking places (#3 category, everything from cafeterias to restaurants and bars, 13% of total retail sales). Most of it is discretionary spending – money that consumers want to spend to enjoy life.
Not seasonally adjusted, sales at these establishments spiked by 6.3% in May from April to a record of $105 billion, up by 6.4% year-over-year. So this looks pretty strong.
Seasonal adjustments whacked that big sales gain down to a big drop – which is somewhat of a headscratcher.
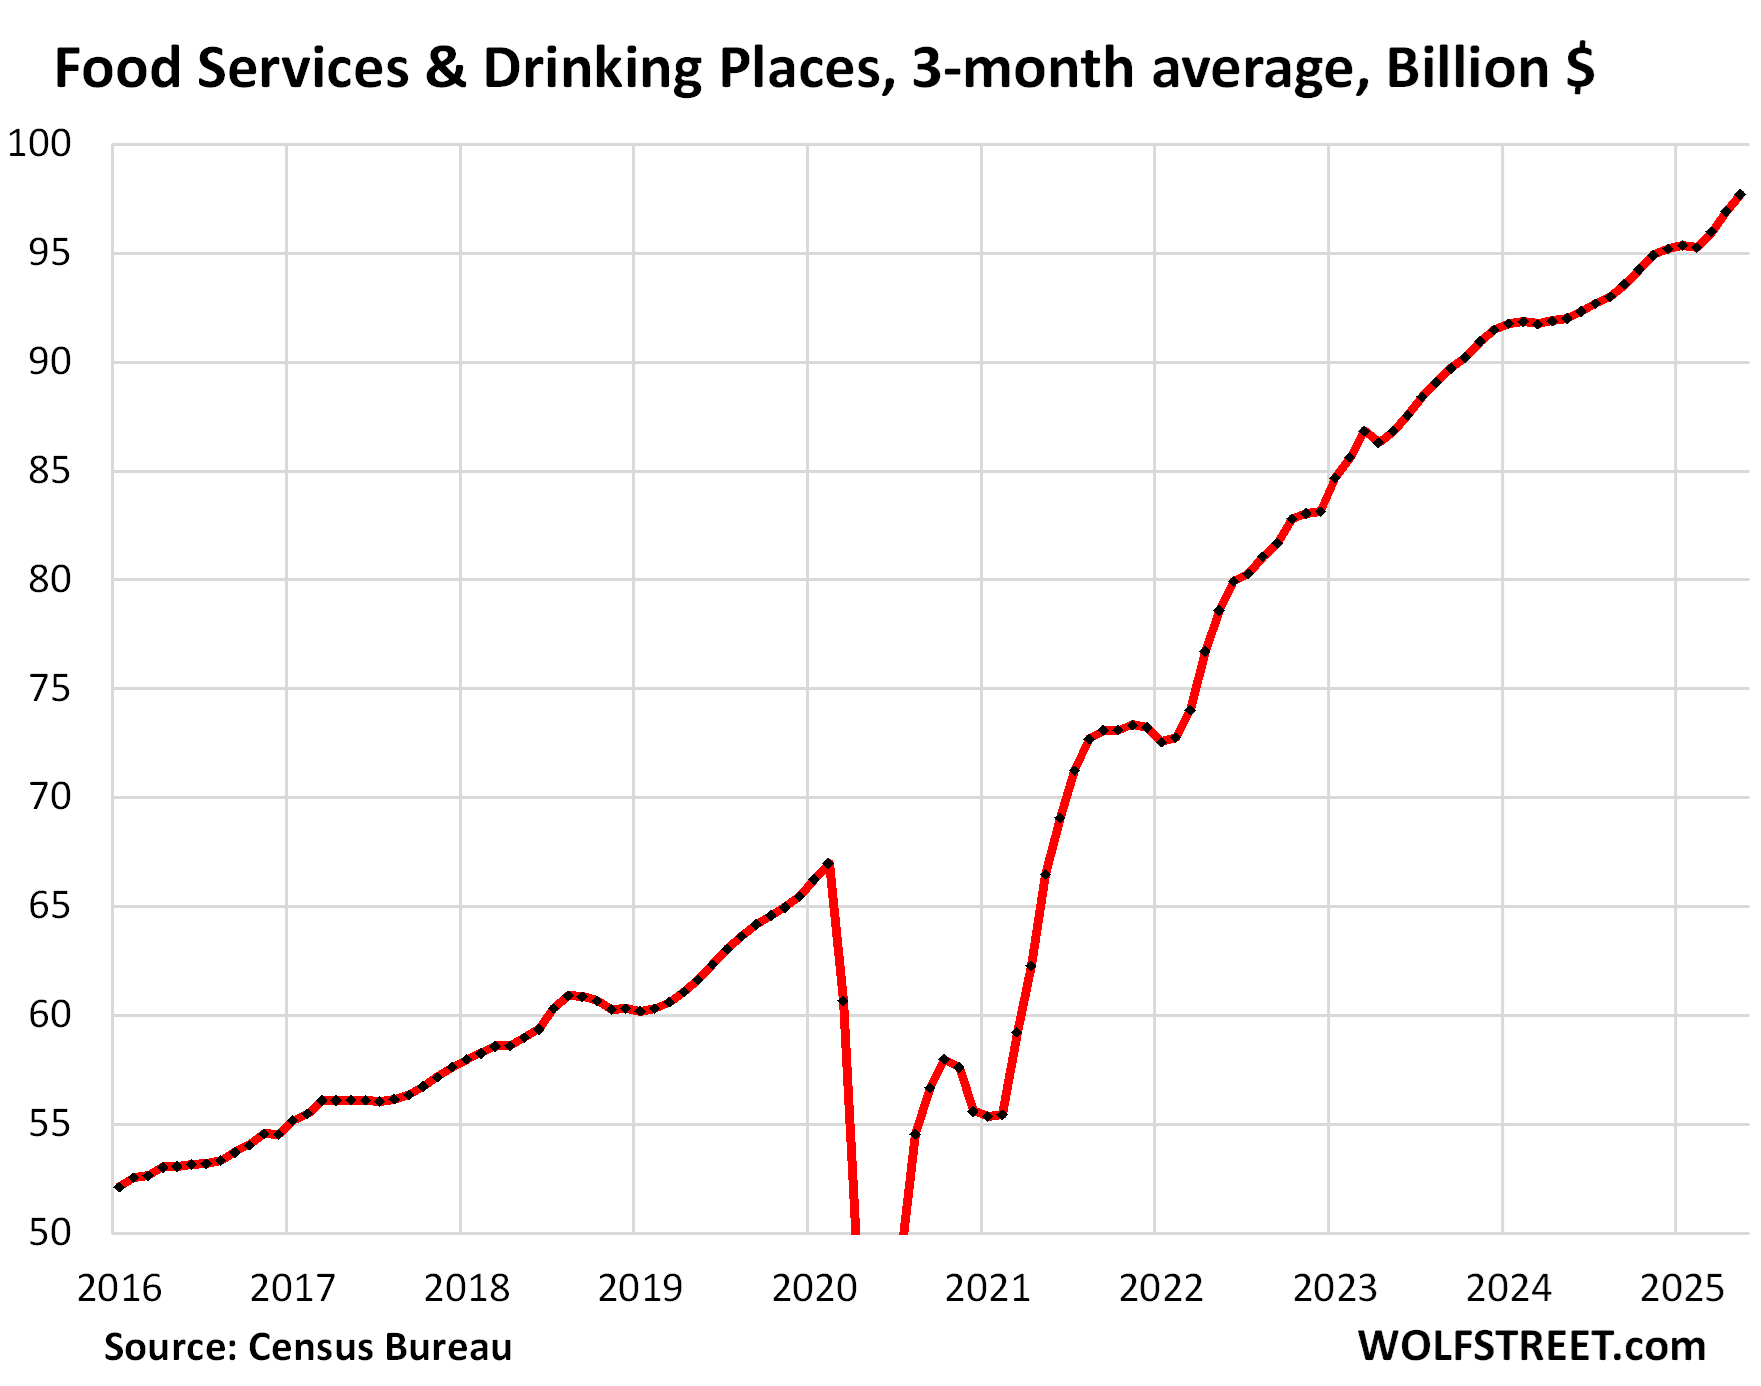
Because the seasonal adjustments are somewhat of a headscratcher, we look at the three-month average, seasonally adjusted, where at least part of the seasonal adjustments cancel each other out.
Three-month average seasonally adjusted sales at food services and drinking places jumped by 0.8% for the month, and by 6.2% year-over-year.
And this is the trend we’ve been seeing all along: Consumers are not backing off from doing stuff they want to do. And the pace of growth picked up in recent months, after flat-lining in late 2024 and early 2025 (maybe due to particularly crappy winter weather and the fires in Los Angeles).
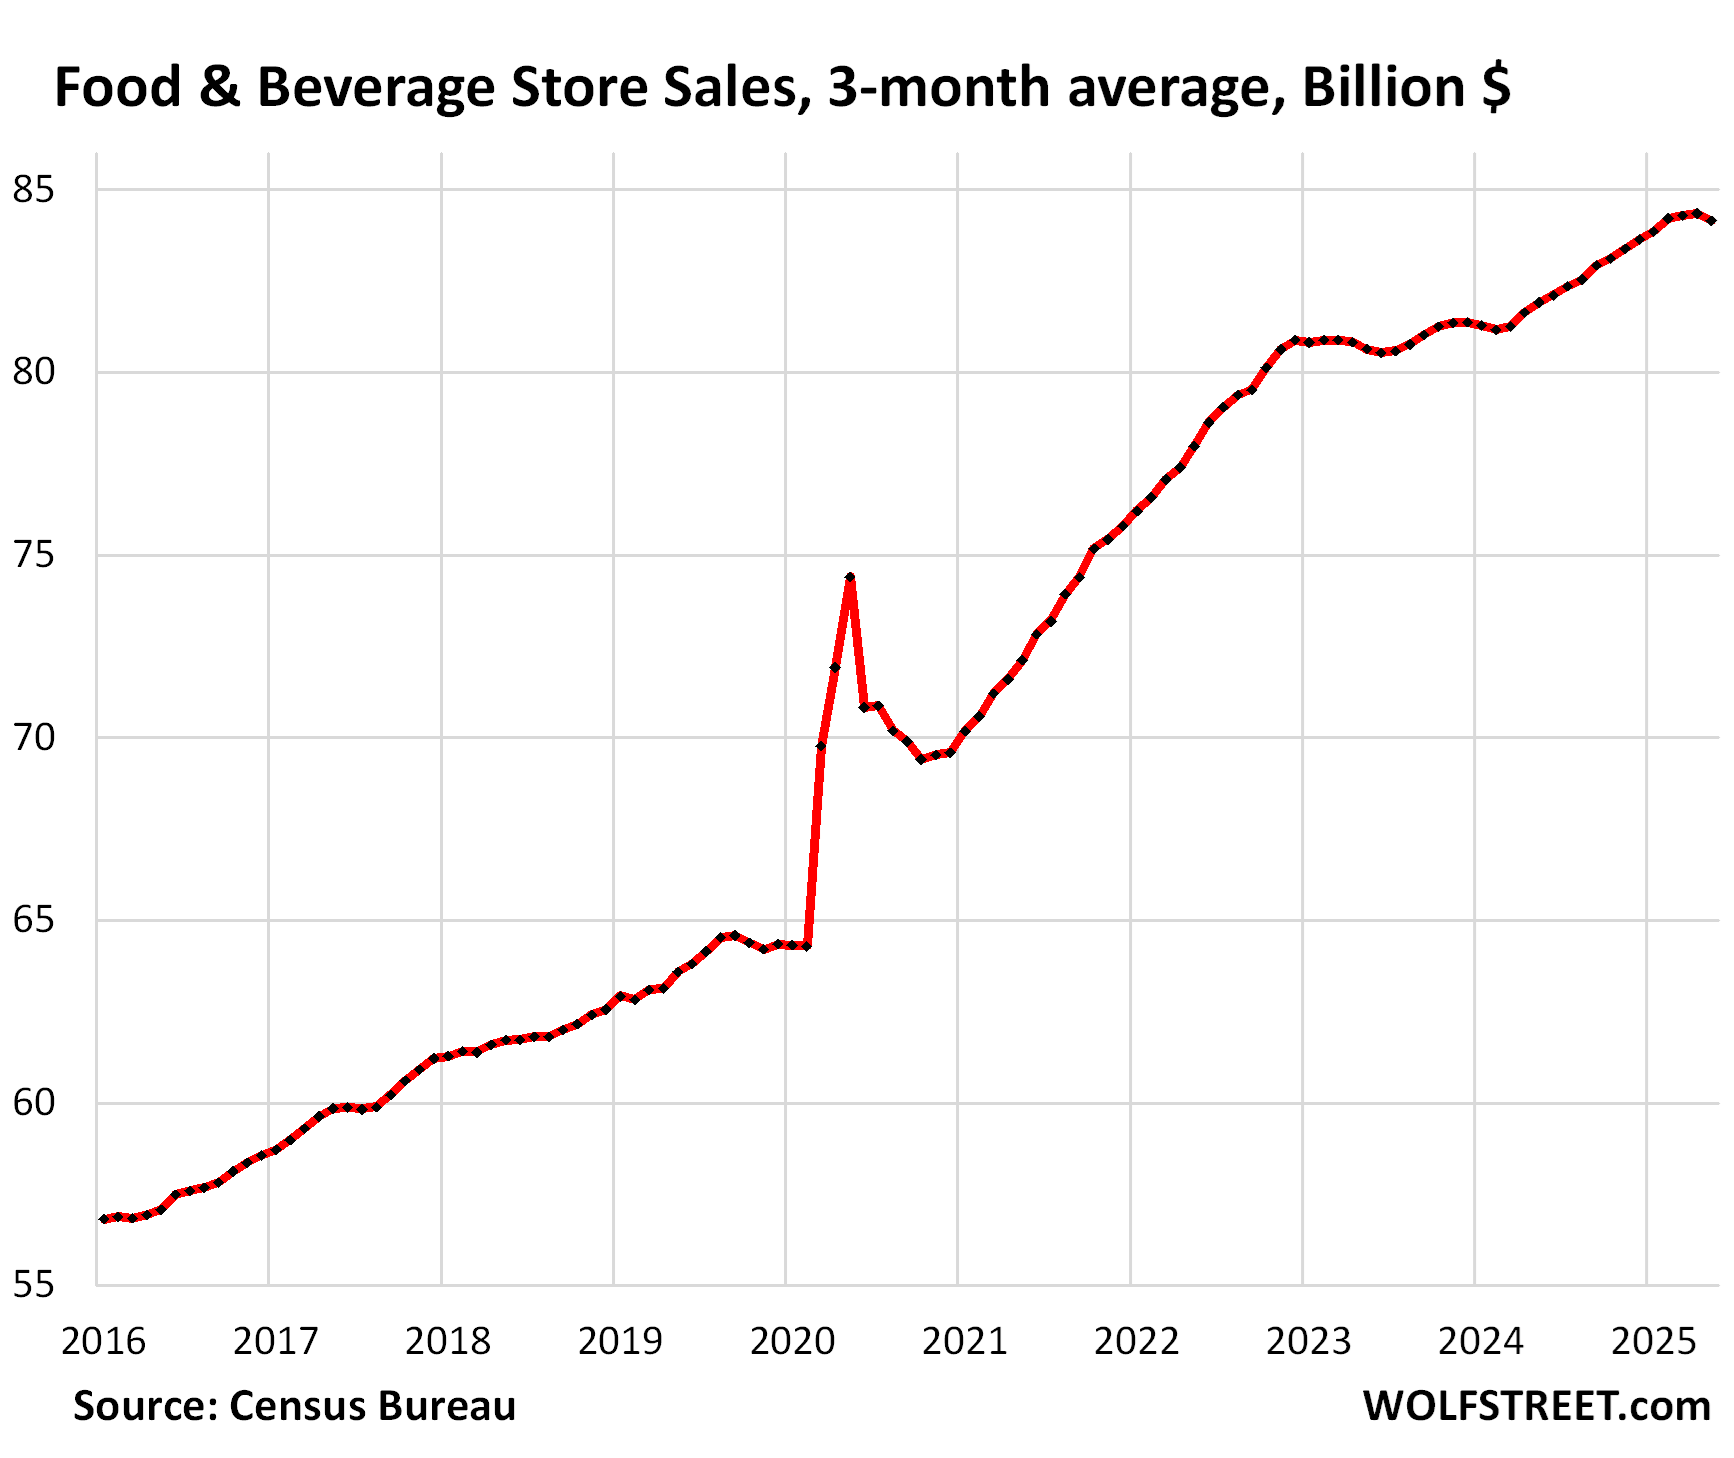
Food and Beverage Stores (#4 category, 12% of total retail sales).
Seasonally adjusted, sales fell by 0.7% in May from April, but were up 2.2% year-over-year.
Not seasonally adjusted, sales jumped in May to $87 billion, and were up by 2.5% from a year ago.
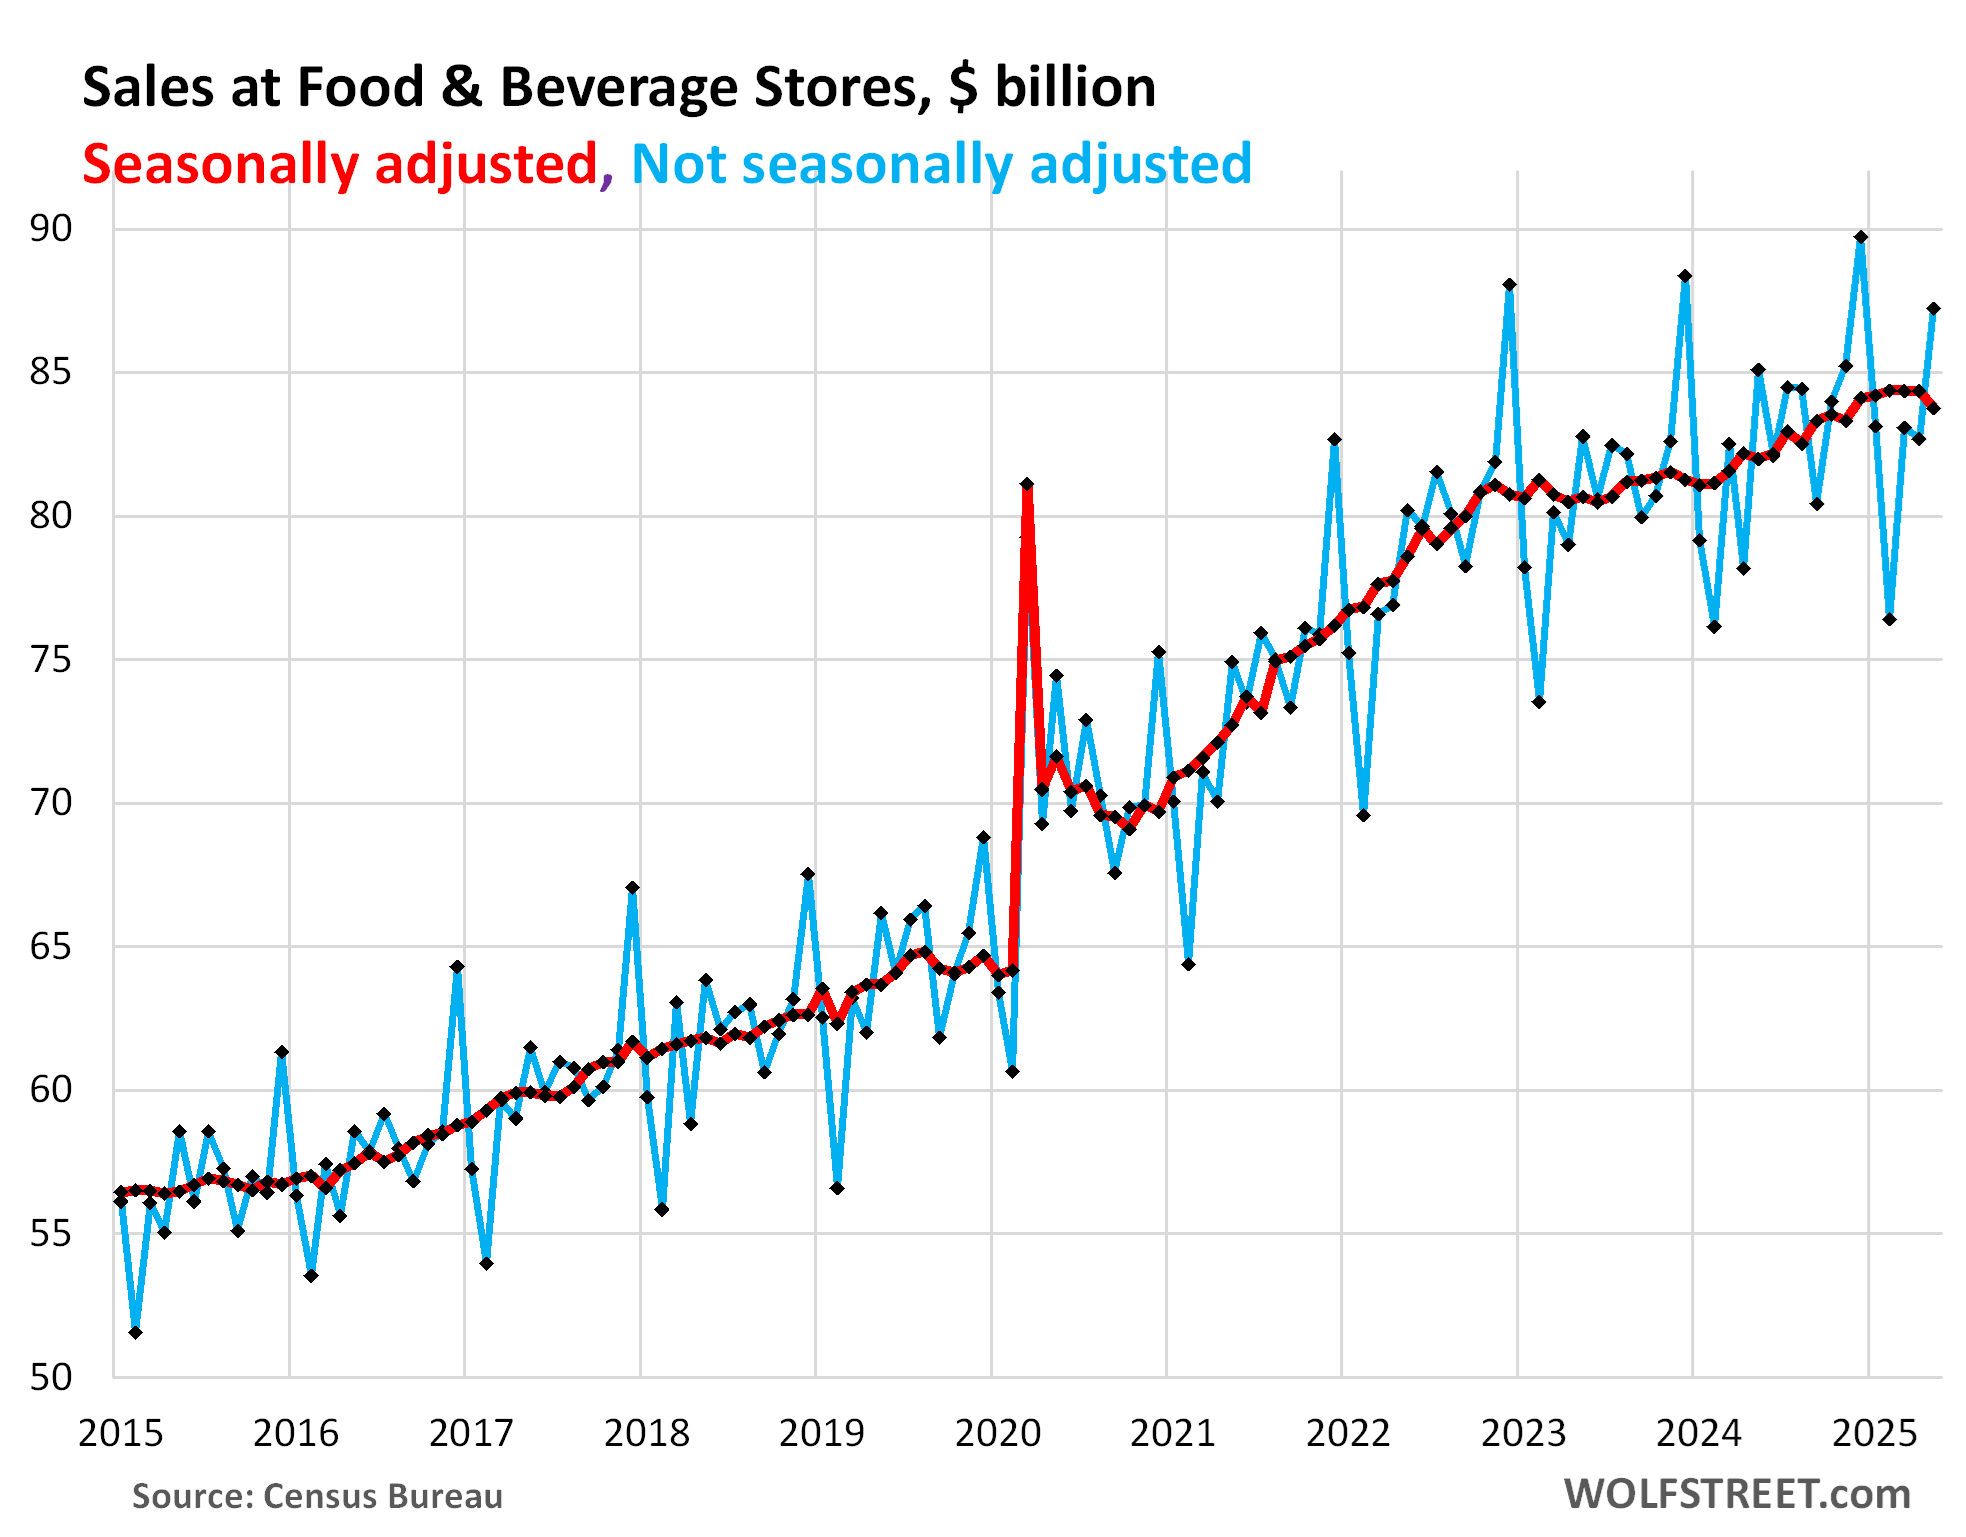
The grocery business is never a high-growth industry. It grows with the population and with price increases, and both of those growth drivers have recently slowed a lot amid a crackdown on illegal immigration, while food inflation has cooled dramatically from the red-hot price increases in 2021 and 2022.
The three-month average shows this trend:
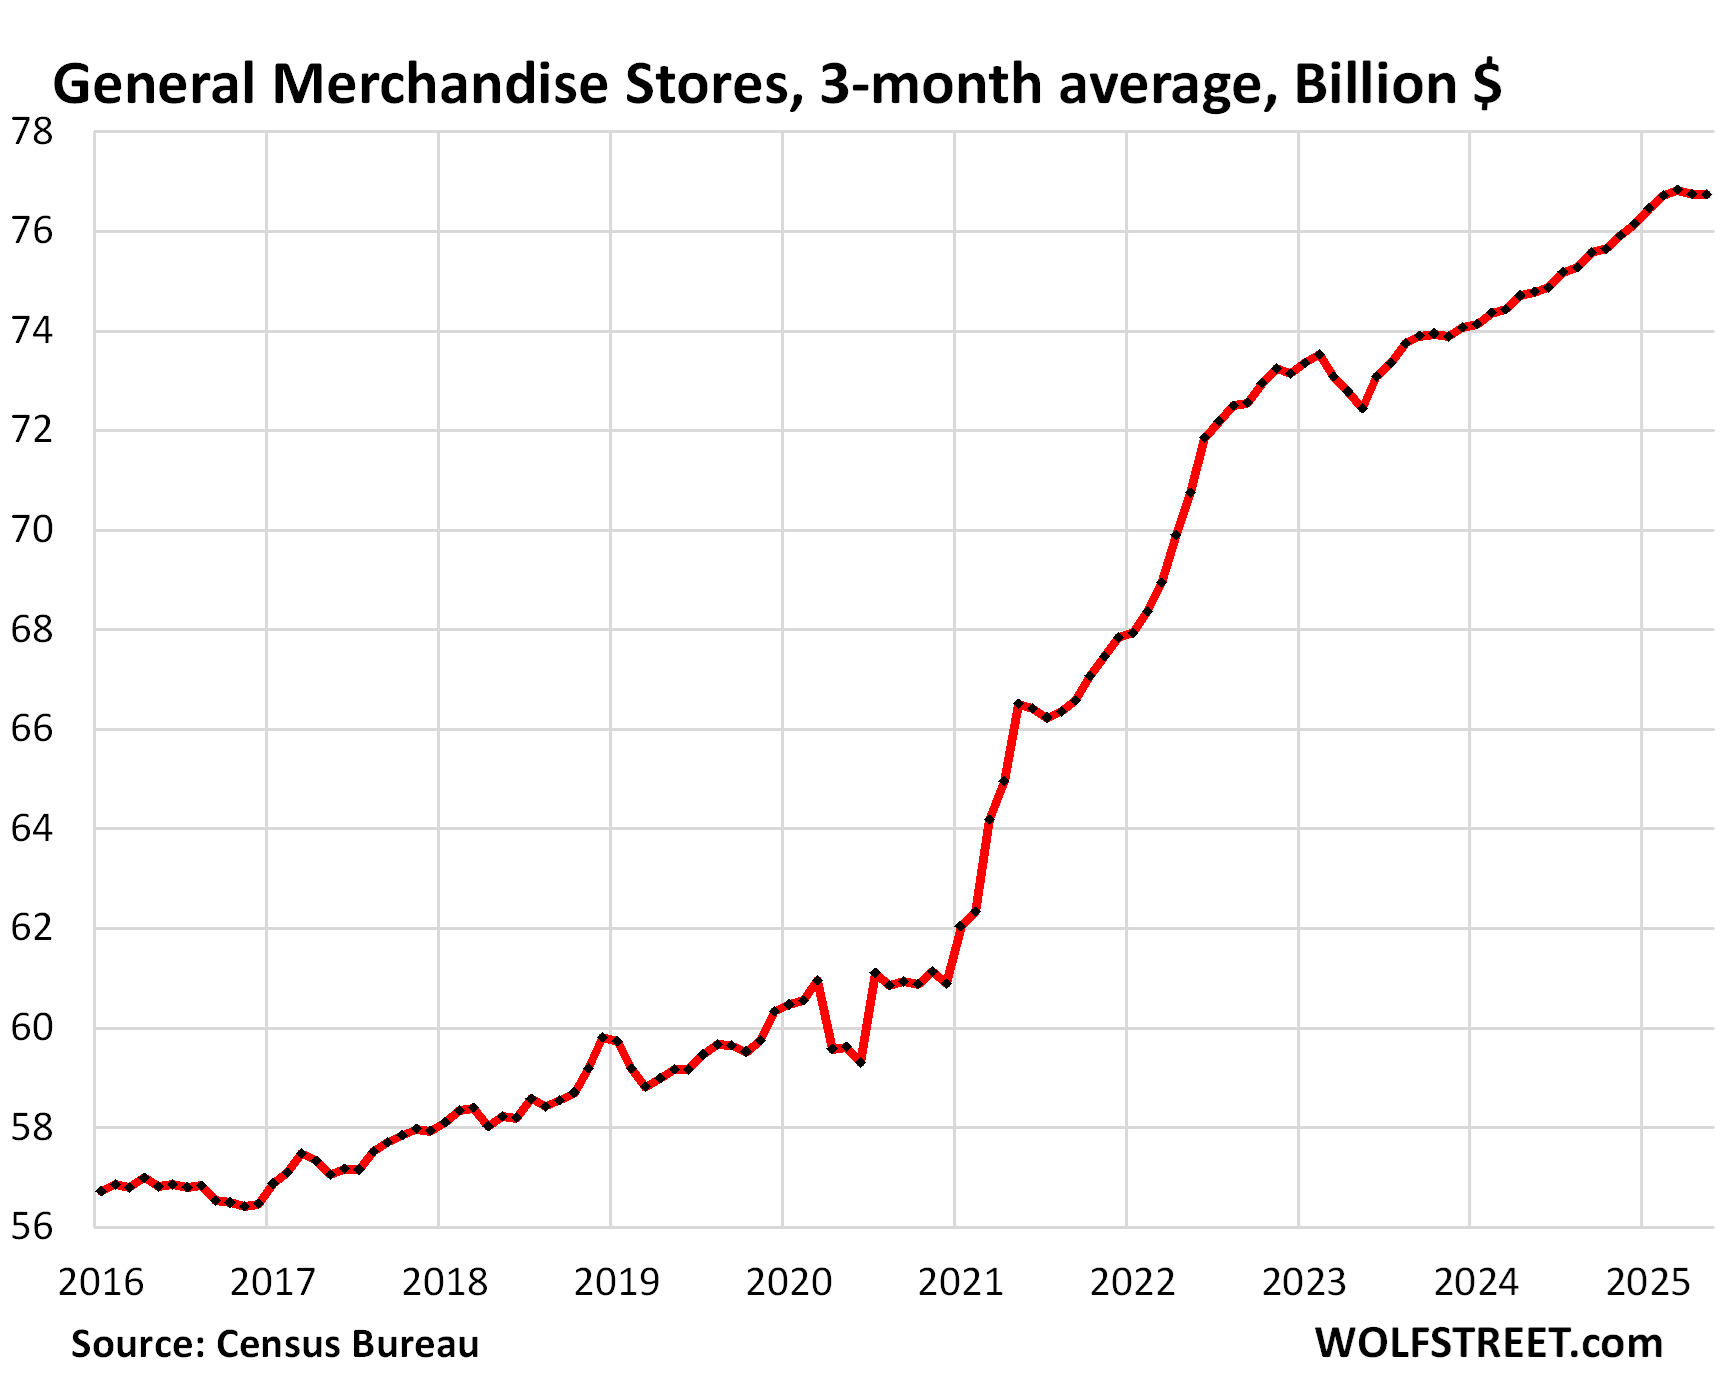
General merchandise stores (#5 category, 11% of total retail sales), including retailers such as Walmart, which is also the largest grocer in the US, but not including their huge ecommerce sales, which are part of “nonstore sales” above:
Not seasonally adjusted, sales jumped by 8.3% in May from April and rose by 3.5% year-over-year to $80 billion.
Seasonally adjusted, sales inched up by 0.1% in May from April and rose by 2.5% year-over-year.
The three-month average of seasonally adjusted sales has been flat for the past four months. But it’s still up by 2.7% year-over-year.
Note the sharp slowdown in sales in the first half of 2023, followed by a bounce-back for three months, followed by three months of flatline. And consumer spending turned out to be fine back in 2023.
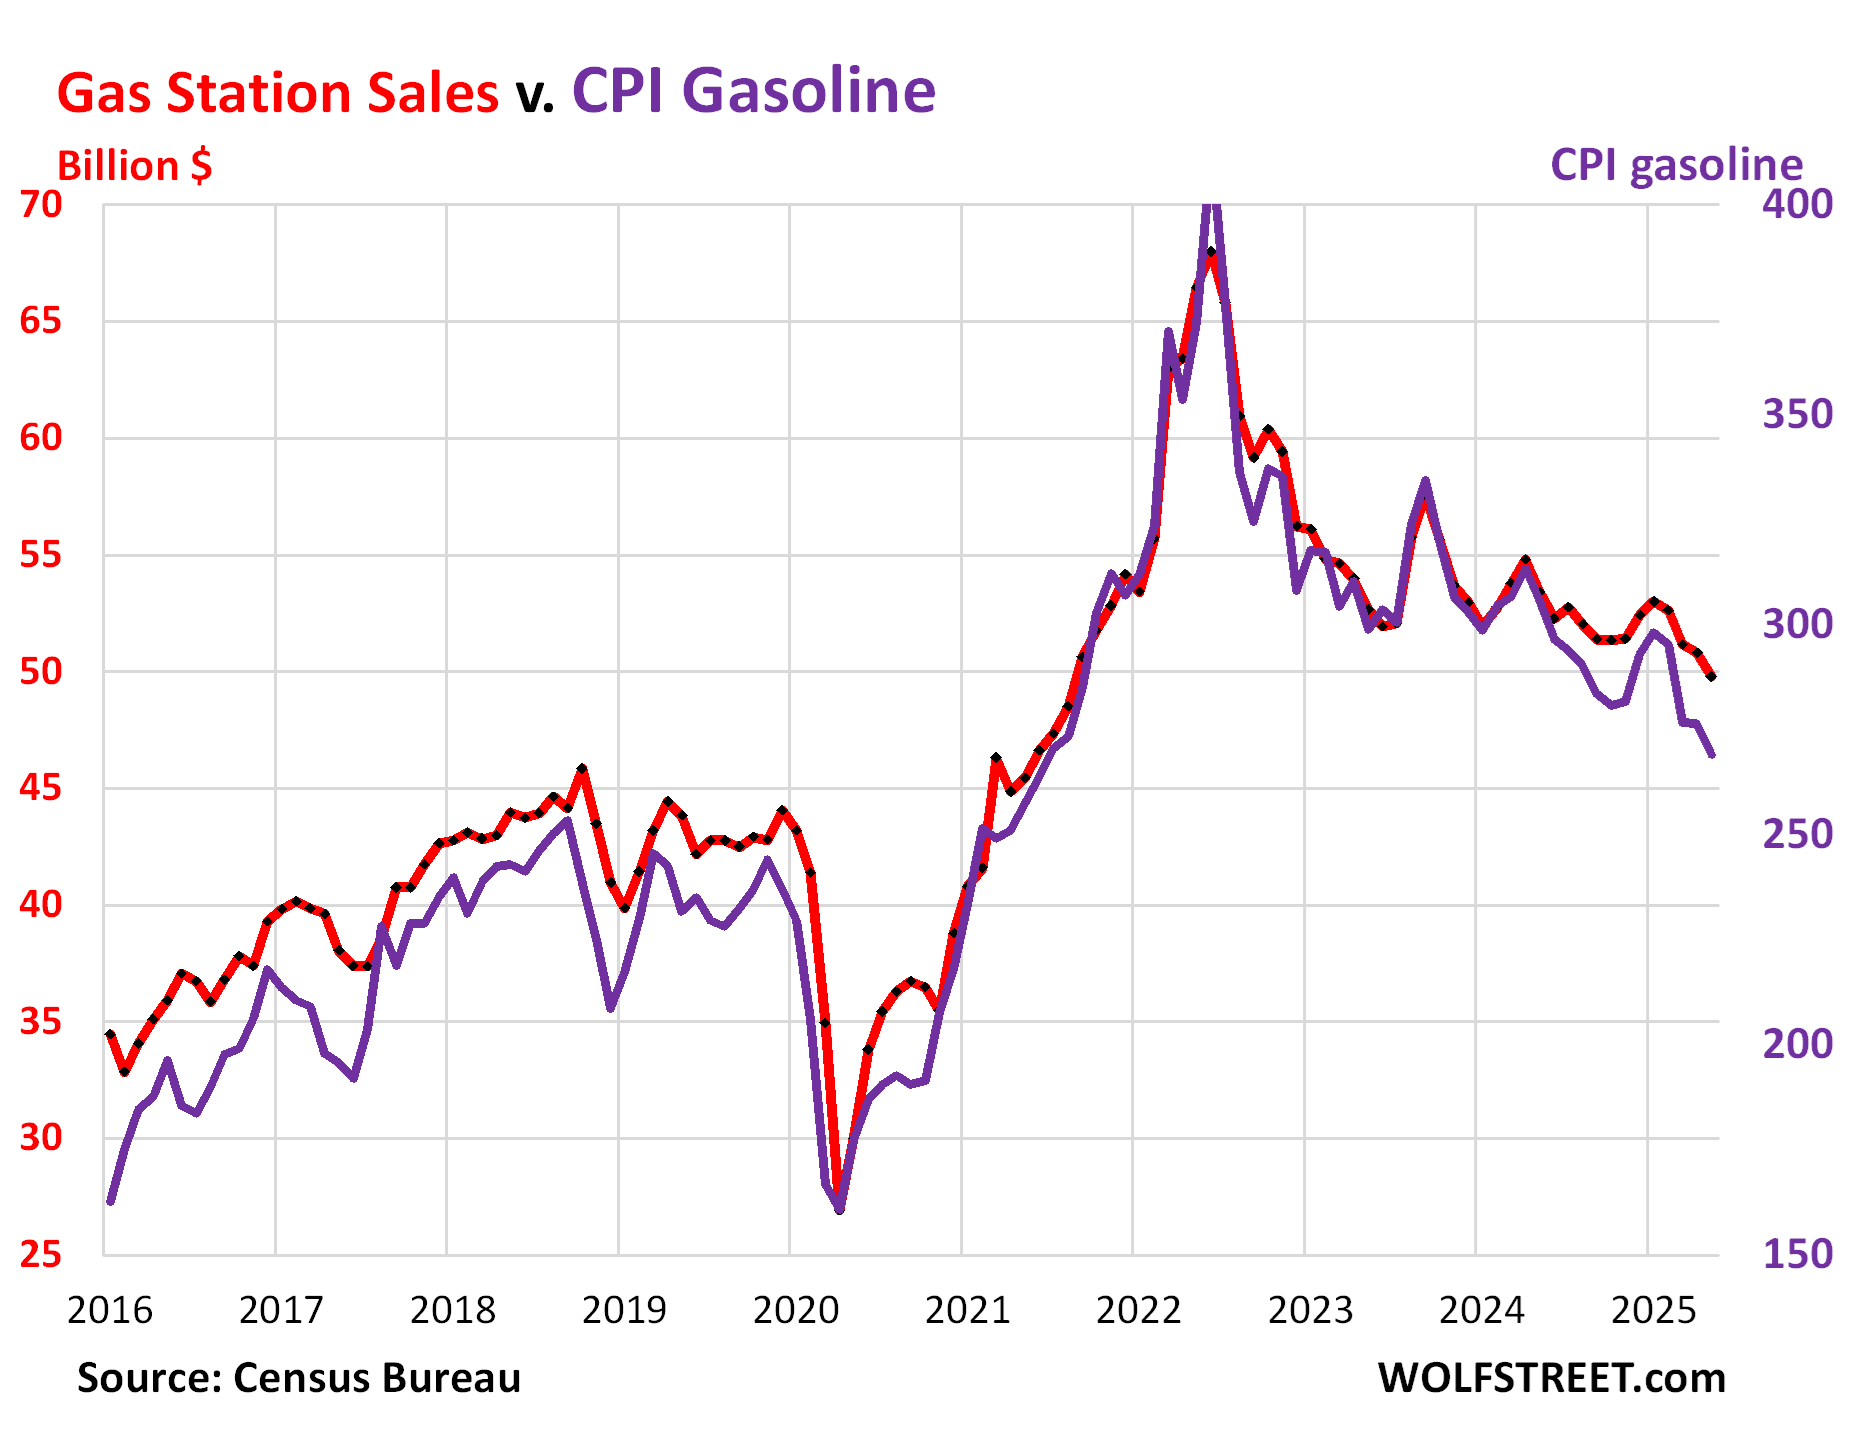
Gas stations (#6 category, 7% of total retail sales). Dollar-sales at gas stations move in near-lockstep with the price of gasoline. The price of gasoline started heading lower in mid-2022 and has continued to move lower.
Seasonally adjusted, sales fell by 2.0% in May from April and by 6.8% year-over-year, to $50 billion (red in the chart below).
The CPI for gasoline dopped by 2.6% in May from April and by 12.0% year-over-year (purple).
So people actually bought more gallons of gasoline than they did last year, as gasoline prices have fallen faster than the amounts consumers spent on gasoline. Anyone having to deal with the worsening traffic congestion on their way to work has first-hand experience that more people are driving more and clogging up the streets and highways more.
What we’re looking at here is not a sign of consumers cutting back, but of prices falling because the price of crude oil has plunged – and that’s a good thing for the rest of the economy:
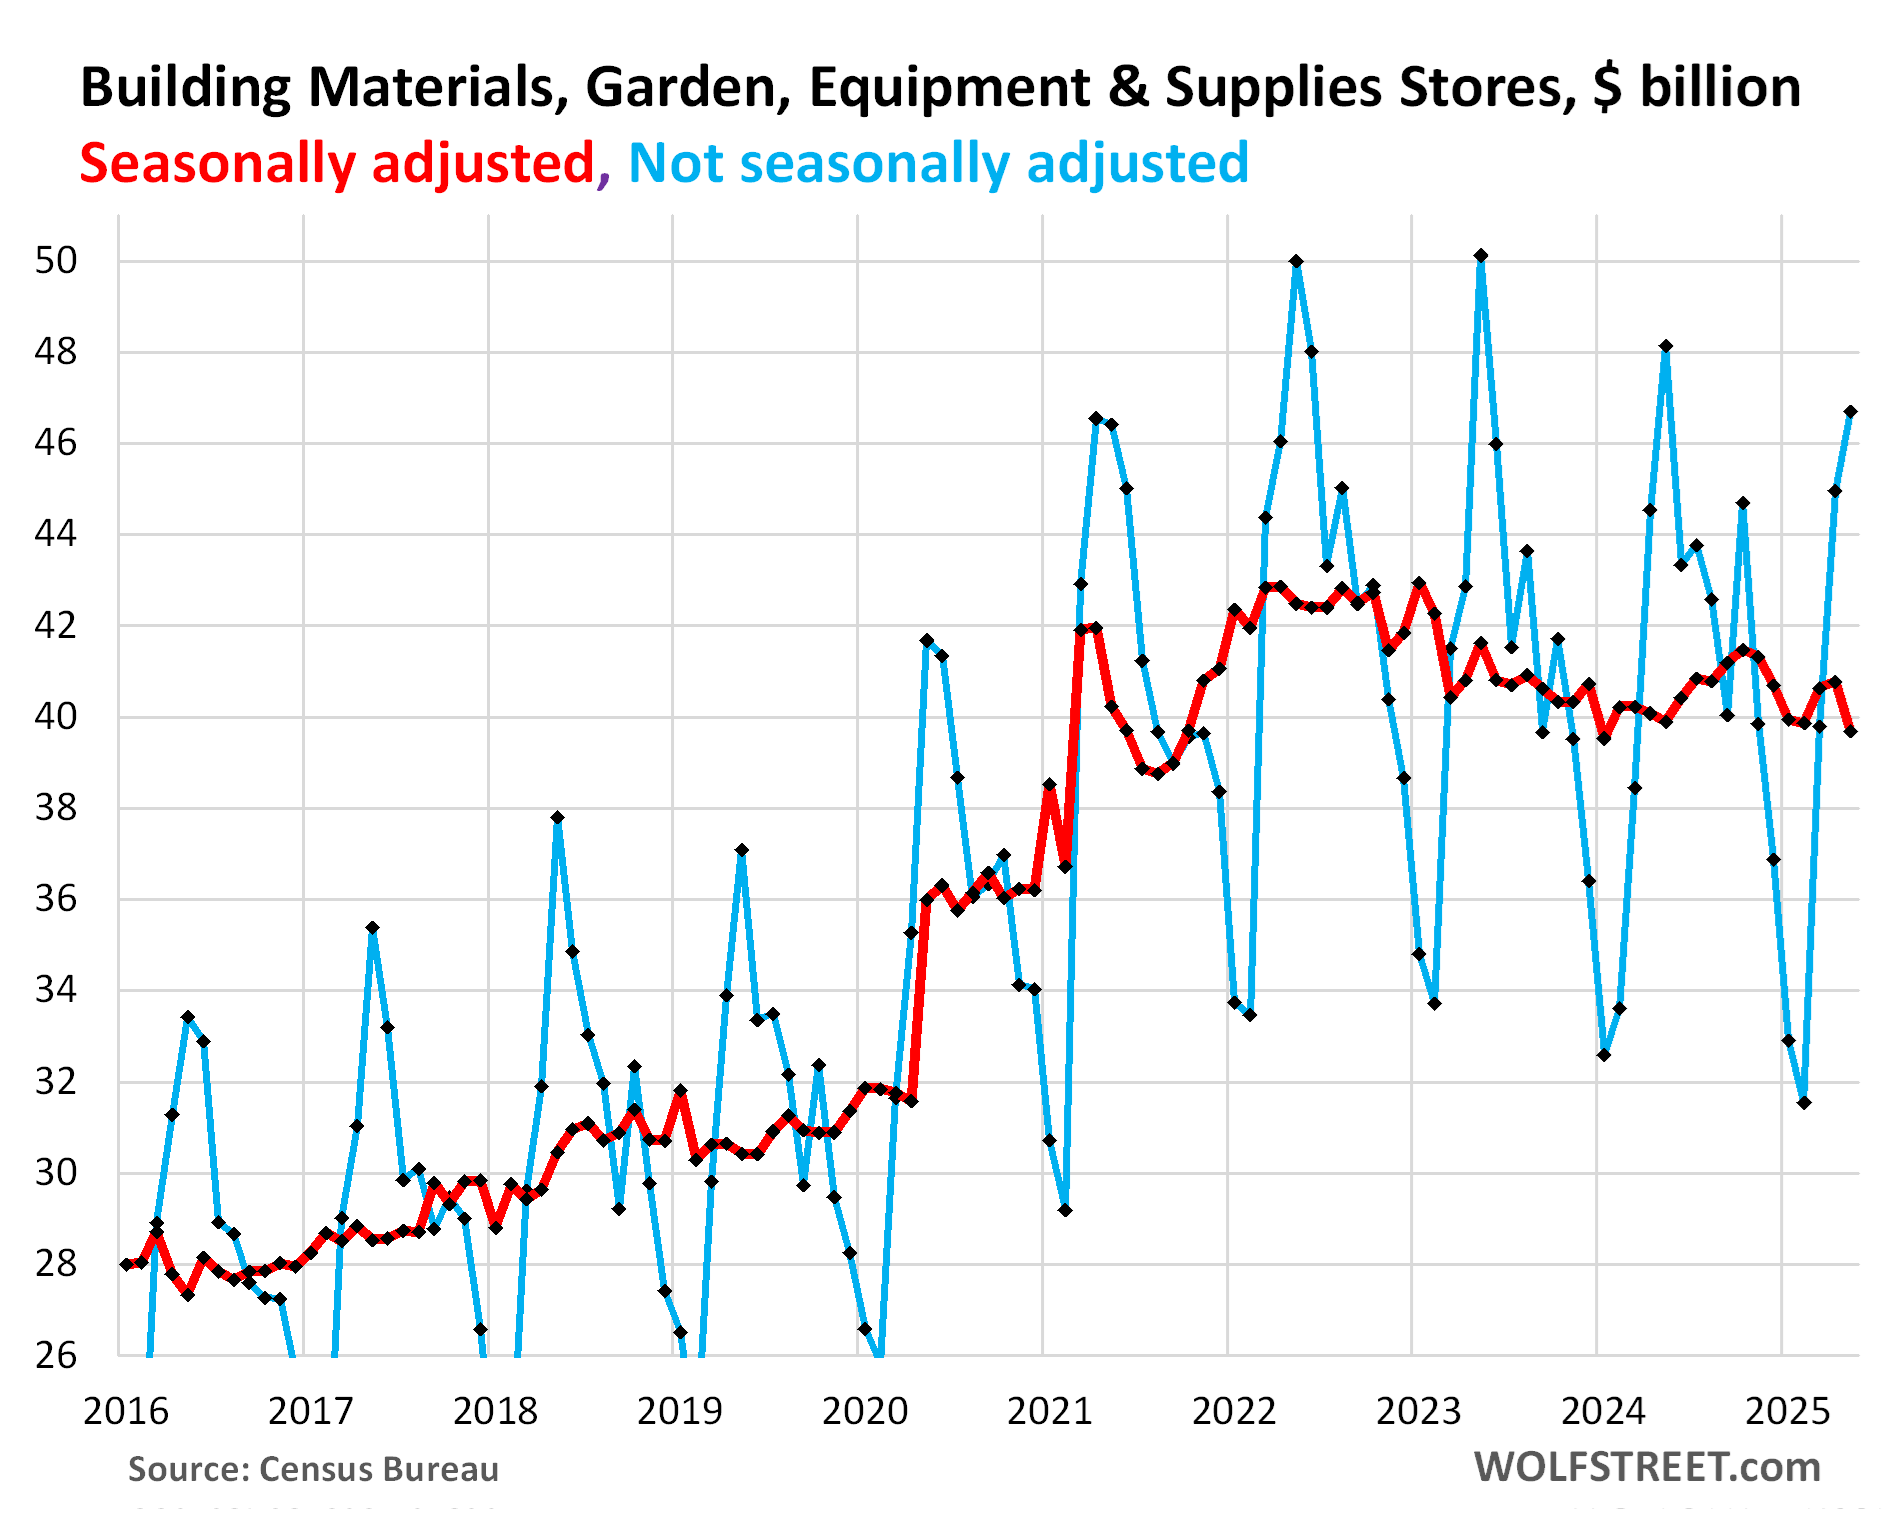
Building materials, garden supply and equipment stores (#7 category, 6% of total retail sales):
This is a very seasonal business, so the seasonal adjustments are huge, and if they’re off just a little bit, it makes a substantial difference. That business boomed during Covid and has since then gradually slowed, and that slowing trend continues, but it’s not smooth.
Not seasonally adjusted, sales jumped by 3.8% in May from April, to $47 billion, but were still down by 3.0% year-over-year.
Seasonally adjusted, sales fell by 2.7% in May from April, but were down only 0.5% year-over-year.
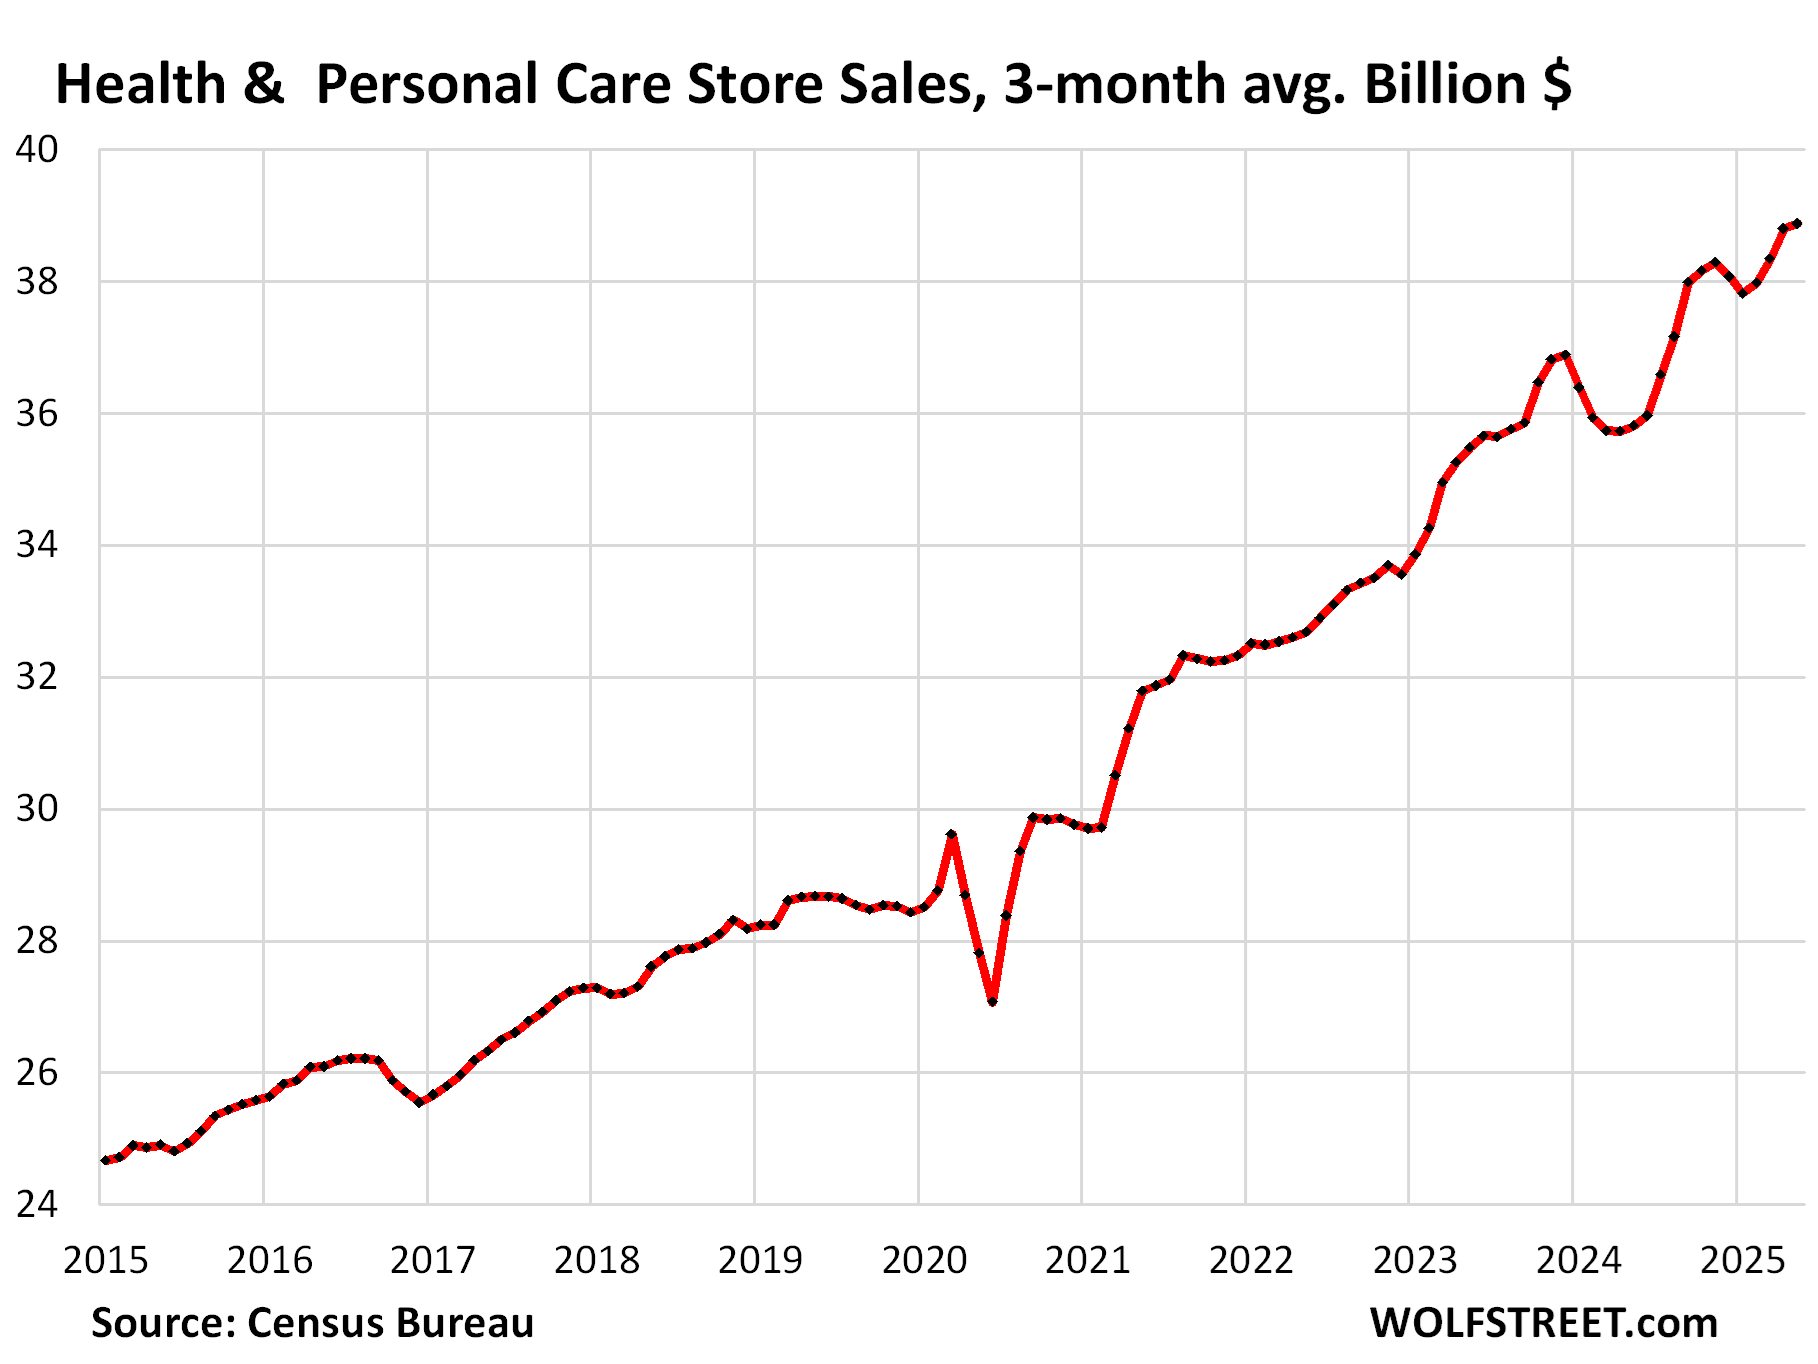
Health and personal care stores (#8 category, 5% of total retail sales):
Sales dipped by 0.1% in May from April, seasonally adjusted, to $39 billion, but were up by 7.8% year-over-year.
The three-month average shows the trend beyond the month-to-month squiggles. It ticked up 0.2% in May from April and rose by 8.6% year-over-year.
Note the weakness in late 2024 and the big drop in early 2023. And the longer-term trend continued:
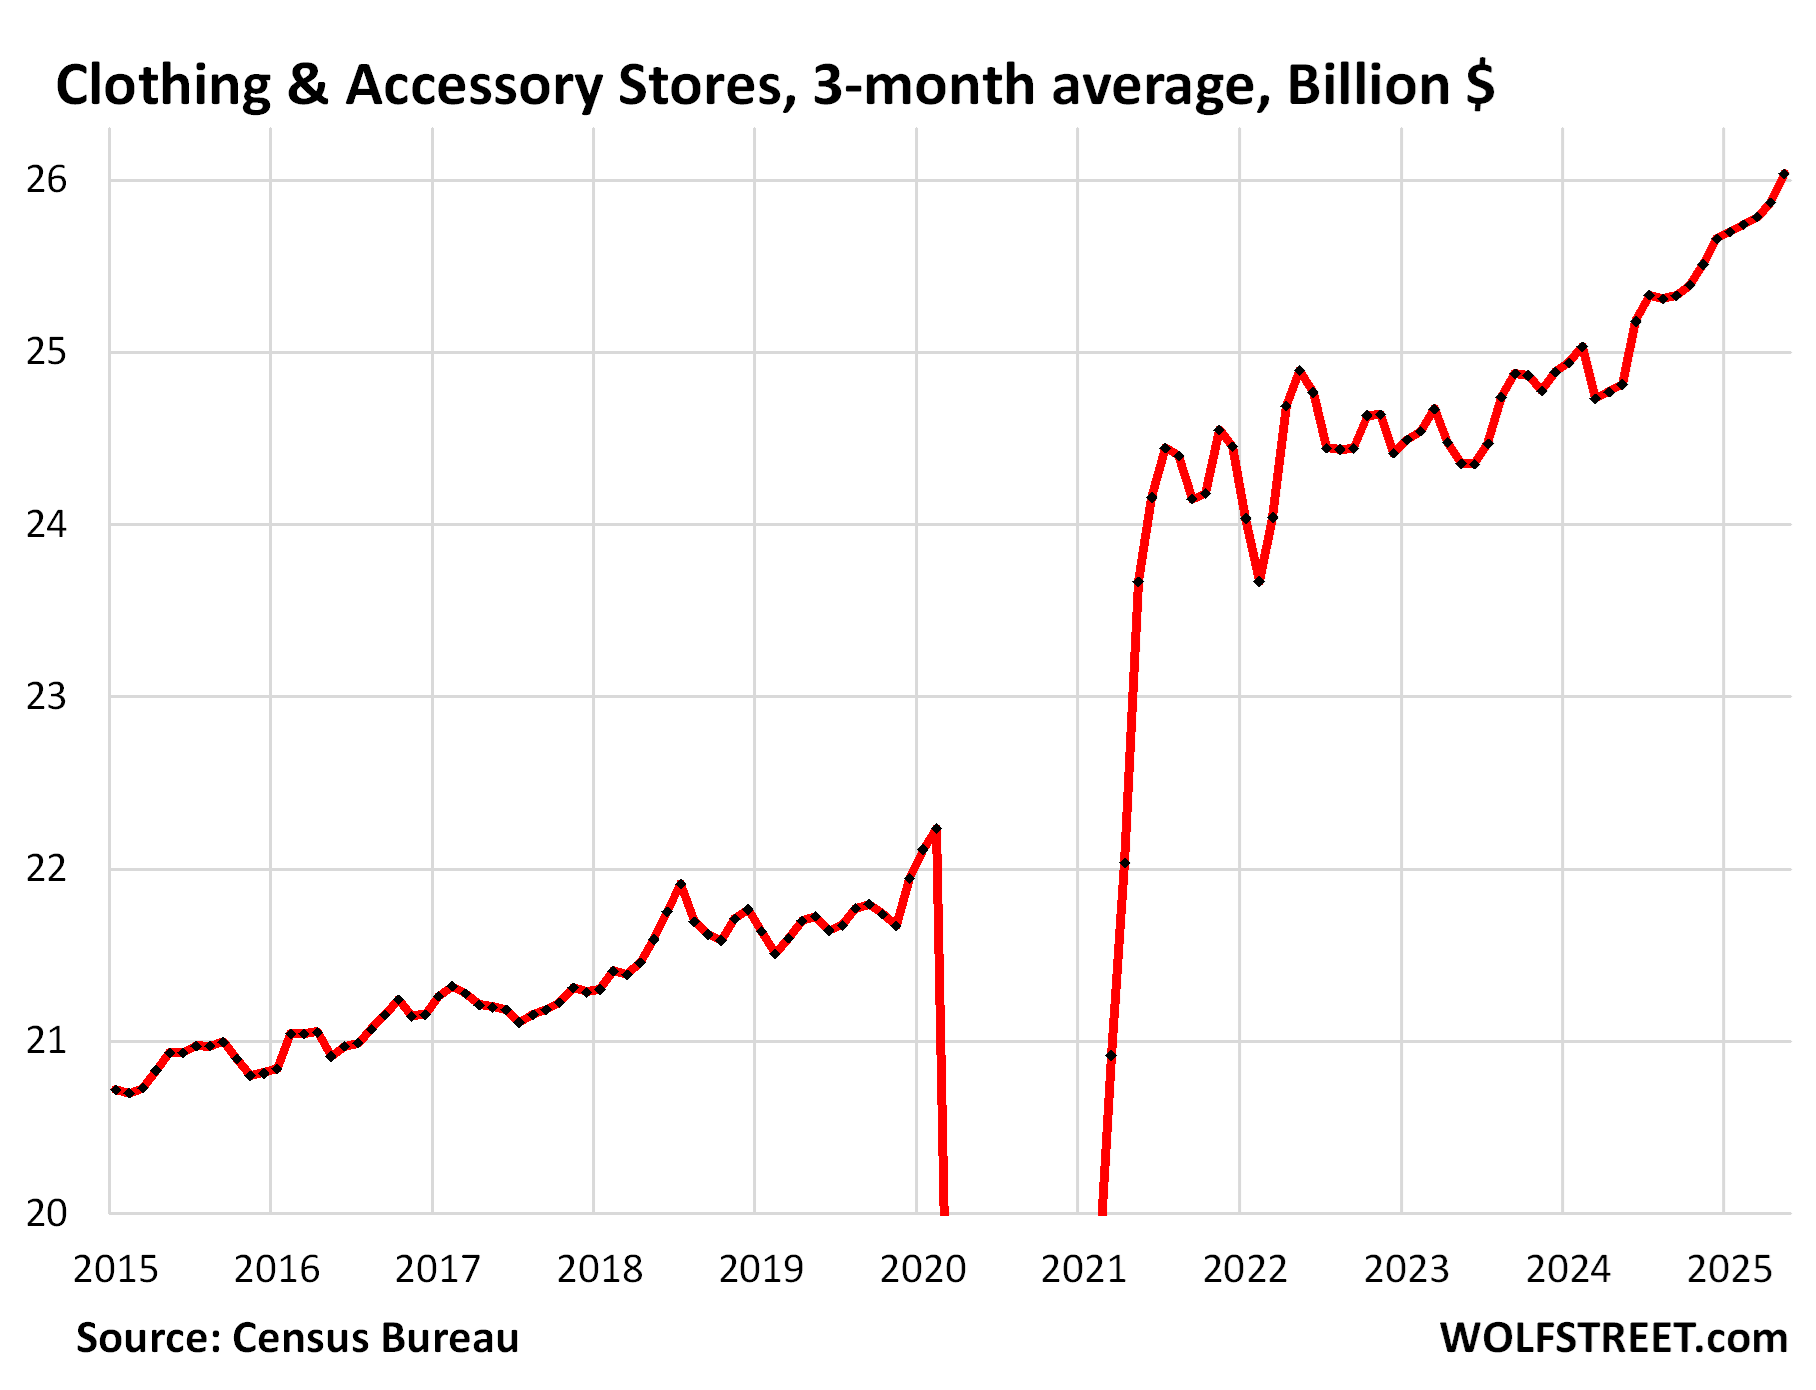
Clothing and accessory stores (#9 category, 4% of total retail sales):
People are not cutting back on buying clothes; on the contrary. Sales jumped by 0.8% in May from April, seasonally adjusted, and were up by 3.7% year-over-year.
The three-month average jumped by 0.6% in May from April and was up by 4.9% year-over-year.
Note that these are clothes bought at brick-and-mortar stores, and not online. Clothes bought online are part of ecommerce sales above.
Once we look at these nuts and bolts… we see that consumers are buying goods at a good clip, and they’re not suddenly cutting back. And it makes sense. Employment growth has been solid, unemployment has been low, wages have risen at a good clip, and consumers have accumulated trillions of dollars in interest-earning cash in CDs and money market funds waiting for a place to go. The mood may be ultra-sour, but the spending on goods goes on.
Enjoy reading WOLF STREET and want to support it? You can donate. I appreciate it immensely. Click on the mug to find out how:

![]()
