Baker Hughes printed the cleanest weekly headline: the U.S. rotary rig count rose 4 to 599 for the week ended September 25, 2026, with oil rigs up 3 to 455 and gas rigs up 1 to 135. That is 50 rigs above the year-ago print of 549.
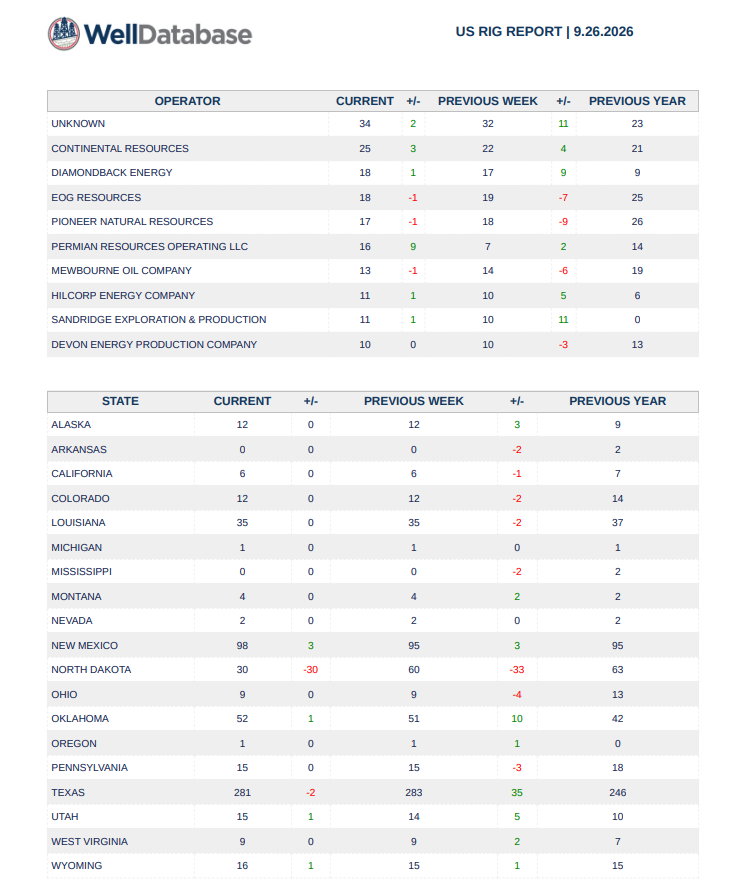
WellDatabase’s September 26 report sits almost on top of that total at 598, but the week-over-week change is −26. The drop is not a national collapse. It is almost entirely a 30-rig swing in North Dakota and the Williston Basin (ND 60 → 30; Williston 64 → 34), the same kind of classification event Energy News Beat has flagged in prior weeks. Year over year, WellDatabase is still up 13. Oil-directed activity on that tape is 428 (+3 week, +30 year). Gas is 131 (+1 week, +14 year).
Enverus continues to run higher because it tracks a broader working fleet with GPS, often in the mid-630s to low-660s on public snapshots (661 on September 6; Lower-48 land near 630 around September 10). The three sources disagree on the weekly print and on how many units “count.” They agree on the structure: activity is higher than a year ago, oil still dominates, gas is the clearer year-over-year growth story, and the Permian remains the center of gravity.
Three tapes, one structural story
|
Source
|
Latest total
|
Week change
|
Year change
|
Oil
|
Gas
|
Notes
|
|---|---|---|---|---|---|---|
|
Baker Hughes (Sept. 25)
|
599
|
+4
|
+50 (from 549)
|
455 (+3)
|
135 (+1)
|
Misc. 9; Permian 270 (+1); Canada 208 (+11)
|
|
WellDatabase (Sept. 26)
|
598
|
−26
|
+13
|
428 (+3)
|
131 (+1)
|
ND/Williston −30; vertical −23
|
|
Enverus (latest public)
|
~630–661
|
mixed / higher baseline
|
~+13–14% on mid-year snapshots
|
n/a public
|
n/a public
|
GPS daily; broader active fleet
|
Baker Hughes is the long-running Friday rotary census the market quotes. WellDatabase is the granular operator/county/basin / well-type cut. Enverus is the near-real-time GPS view that almost always prints higher. Use all three; do not treat a single week’s WellDatabase delta as a Bakken shutdown when Baker Hughes still shows Williston in the mid-20s.
Oil versus natural gas
Oil still runs about three-quarters of the Baker Hughes count (76 / 23 / 2 oil-gas-misc). Both oil and gas added rigs this week on the Baker Hughes tape. On WellDatabase, oil is 428 of 598, and gas is 131, plus 8 thermal and a sliver of unknown.
The year-over-year gas story is stronger than the weekly noise. WellDatabase gas is +14 versus last year (117 → 131). Baker Hughes gas is +18 year-over-year. Haynesville is the standout basin on that tape: 56 rigs, unchanged on the week, +17 versus 39 a year ago. That matches the broader theme of gas-directed work responding to LNG export demand and power-sector pull, even when oil prices wobble week to week.
Horizontal wells still dominate: 515 on WellDatabase (−3 week, +4 year) versus 42 vertical (−23 week, a swing that lines up with the ND/undisclosed reclass) and 40 directional. Depth is concentrated in the 10k–15k ft band (264 rigs) and >20k ft (107).
States and basins that are growing
States (WellDatabase, current vs. year ago)
- Growing or holding with a clear year-over-year lift:Texas: 281 (−2 week, +35 year from 246). Still more than 45% of the WellDatabase total.
- Oklahoma: 52 (+1 week, +10 year from 42).
- New Mexico: 98 (+3 weeks, +3 years from 95). Combined with Texas, this is the Permian engine.
- Utah: 15 (+1 week, +5 years from 10).
- Wyoming: 16 (+1 week, +1 year).
- Alaska: 12 (flat week, +3 year).
- Montana and West Virginia: small absolute counts, both up versus last year.
The outlier is North Dakota at 30 (−30 week, −33 year from 63). Treat the weekly collapse as a data event until Baker Hughes and Enverus confirm a real stack-out. Baker Hughes has recently shown North Dakota in the mid-20s to low-30s, not a 30-rig one-week disappearance.
Louisiana is flat at 35 week-over-week and slightly down year-over-year. Pennsylvania (15) and Ohio (9) are soft versus last year, consistent with a mature Appalachia maintenance program rather than a new drilling boom.
Basins (WellDatabase)Permian: 270 (+1 week, +17 year from 253). Still ~45% of the WellDatabase count. Baker Hughes has the basin at 270 as well, +17 versus 253 a year ago. This is the growth core.
Haynesville: 56 (flat week, +17 year from 39). Best gas-basin growth print on the page.
- Eagle Ford: 50 (−1 week, +5 year from 45).
- Granite Wash: 20 (+2 week, +5 year).
- Cana Woodford: 20 (−1 week, +2 year).
- OTHER: 101 (+3 week, +3 year) — the residual bucket is not shrinking.
- Williston: 34 (−30 week). Same caveat as North Dakota.
- Marcellus 23 and Utica 10: flat to slightly down year over year.
County-level heat on the WellDatabase map remains West Texas / Southeast New Mexico (Lea, Eddy, Midland, Martin, Howard, Reeves, Loving, Ward) with secondary clusters in Oklahoma and the Haynesville corridor.
Top operators (WellDatabase current / week / year-ago)
Unknown 34, Continental Resources 25 (+3 week, +4 year), Diamondback 18, EOG 18 (−1 week, −7 year), Pioneer 17 (−1 week, −9 year), Permian Resources Operating 16 (+9 week), Mewbourne 13, Hilcorp 11, SandRidge 11, Devon 10.
The operator tape is mixed: some large publics are leaner than a year ago (EOG, Pioneer), while Continental, Diamondback, Hilcorp, SandRidge, and Permian Resources show more activity. That lines up with Enverus research that private and smaller operators have taken a disproportionate share of incremental rigs this cycle.
DUC wells: five years of drawing the inventory down
Drilled-but-uncompleted wells are the buffer between a rig and first oil or gas. The last five years have been a drawdown, not a rebuild.
- Pandemic-era peak was roughly 8,900 DUCs in 2020.
- By December 2024 the EIA shale-region count was about 5,798.
- By December 2025 it was about 5,020 (−14% year over year; Permian down sharply from ~1,280 to ~821 in that World Oil recap of EIA data).
- April 2026 EIA estimates were about 4,972 — described at the time as the lowest in the series back to 2013 after 14 months of completions outrunning new drills.
August 2026 snapshots put the EIA-style national total near 4,385–4,919 depending on the aggregator, with Permian DUCs around 839 (+15 month-over-month in one OilPriceAPI/EIA cut). MacroMicro shows 4,919 for August.
From the ~8,900 peak to ~4,900 is a draw of roughly 45%. From late-2024 levels near 5,800 to ~4,900 is another ~15%. Completions have been using the backlog up. That is why production can stay high even when the rig count is only in the high 500s: longer laterals, faster cycle times, and a smaller but still-usable DUC queue.
Two caveats matter. First, EIA DUCs are the standard market series and are not the same as a raw regulator extract of every well that has a spud and no first production. Buckhead Energy’s September 26 state-regulator rollup across 11 mineral states shows 9,815 wells in that broader inventory (Texas and New Mexico each listed at 2,000 on that methodology). Older wells in those extracts may never be completed. Enverus has previously argued that excluding wells drilled more than two years ago produces a much smaller “live” DUC number. Second, some basins have started to replenish as prices and rigs firmed in 2026; Permian DUCs ticking up in August is consistent with that, not a return to 2020 inventory.
Are we using them up? Yes, on a five-year basis. The industry no longer has an 8,000–9,000 well completion overhang. The remaining inventory is a working queue, not a strategic stockpile.
Oil storage and production cross-check
Rig counts are a leading indicator. The EIA Weekly Petroleum Status Report is the lagging physical check.
For the week ending September 18, 2026 (released September 23):
- U.S. crude production: 13.939 million b/d, essentially unchanged from 13.944 the prior week and in record territory.
- Commercial crude inventories excluding SPR: 426.4 million barrels, +3.0 million on the week, about 2% above the five-year average for this time of year. Analysts had expected a small draw.
- morningstar.com
Cushing, Oklahoma: 23.7 million barrels, +2.3 million. Still below the five-year average even after the build.
SPR: 284.6 million barrels, −0.4 million on the week. That is historically low (roughly 43% of the 2020 peak near 656 million) and far below year-ago levels.
Refinery utilization slipped to 94.0% from 96.8%, which helped the unexpected crude build.
The cross-check is straightforward. Production is running near 13.9 million b/d with a 599-rig Baker Hughes count — efficiency, not a 2014-style rig army. Commercial stocks are no longer at the emergency-tight levels seen earlier in 2026, but they are not sloppy either. Cushing rebuilt off the floor and is still not overflowing. The SPR remains a structural drawdown story. A 4-rig weekly add does not flood the market next month; DUC drawdown plus 10k–15k ft horizontals is how 13.9 million b/d happens at these rig levels.WTI settled around $92.41 on September 25 per the Odessa American recap of the Baker Hughes week, down sharply on the week even as the rig count rose — a reminder that the rig tape and the price tape do not move in lockstep.
Bottom line
Baker Hughes is up. WellDatabase is flat-to-up year over year once you look through the North Dakota reclass. Enverus is higher still. Growth is concentrated in Texas, New Mexico, Oklahoma, the Permian, and Haynesville gas. Oil rigs still set the level; gas rigs set more of the year-over-year change. DUC inventories have been worked down by roughly 45% from the 2020 peak and are no longer a large spare-capacity reservoir. U.S. crude output near 13.9 million b/d with commercial stocks only modestly above the five-year average is the production result of that efficiency-plus-drawdown regime.
The weekly number to watch next is not whether WellDatabase prints 598 or 628. It is whether Permian and Haynesville hold, whether the ND/Williston classification settles, and whether completions keep converting the remaining DUC queue fast enough to hold 13.9 million b/d if prices stay choppy. We love our subscription to WellDatabase.com, as we can get the granular data we need when writing articles on operators or oilfield service companies.
Making Appendices Great Again
Check out the World’s Greatest Podcast Show Notes at EnergyNewsBeat.co or EnergyNewsBeat.com.
Appendix: sources and links
Rig counts
- WellDatabase U.S. Rig Report, September 26, 2026 (attached report): total 598, −26 week, +13 year; state, basin, operator, well-type, wellbore, and depth tables.
- Baker Hughes North America Rig Count overview: https://bakerhughesrigcount.gcs-web.com/rig-count-overview/ (U.S. 599 as of Sept. 25, 2026; +4 week; +50 year).
- Baker Hughes NA rig count page / latest report: https://rigcount.bakerhughes.com/na-rig-count/
- AOGR Baker Hughes weekly table: https://www.aogr.com/web-exclusives/us-rig-count
- TipRanks / The Fly Baker Hughes wrap: https://www.tipranks.com/news/the-fly/baker-hughes-reports-u-s-rig-count-up-4-to-599-rigs-thefly-news
- Odessa American Permian/national recap: https://www.oaoa.com/local-news/us-rig-count-up-four-as-prices-decline-2/
- Enverus Daily Rig Count product: https://www.enverus.com/dailyrigcount/
- Enverus Drillinginfo daily snapshot (661 on Sept. 6, 2026): https://app.drillinginfo.com/drc/
- Enverus “The Rig Count Doesn’t Tell You What’s Coming,” Sept. 10, 2026 (L48 land ~630): https://www.enverus.com/blog/rig-count-doesnt-tell-you-whats-coming/
- Prior Energy News Beat three-source comparisons: https://energynewsbeat.co/tag/welldatabase/
DUC wells and drilling productivity
- EIA Short-Term Energy Outlook tables (Table 10a drilling productivity / DUC metrics): https://www.eia.gov/outlooks/steo/
- EIA Drilling Productivity Report hub: https://www.eia.gov/petroleum/drilling/
- Reuters on record-low DUC backlog, May 29, 2026: https://www.reuters.com/business/energy/record-low-us-shale-well-backlog-curbs-fast-output-gains-amid-export-surge-2026-05-29/
- MacroMicro U.S. DUC count vs. oil production: https://en.macromicro.me/charts/22350/us-drilled-but-uncompleted-wells
- OilPriceAPI DUC by basin (Permian 839, Aug. 2026 EIA-based): https://www.oilpriceapi.com/data/duc-wells
- Buckhead Energy U.S. Mineral & Drilling Activity Index, Sept. 26, 2026 (broader regulator DUC extract): https://www.buckheadenergy.com/us-drilling-activity-index
- World Oil 2026 U.S. drilling forecast recap of late-2025 EIA DUC levels: https://read.nxtbook.com/gulf_energy_information/world_oil/february_2026/special_focus_forecast_us_drilling.html
Oil production, storage, SPR, Cushing
- EIA Weekly Petroleum Status Report: https://www.eia.gov/petroleum/supply/weekly/
- EIA weekly supply estimates (production and stocks through week ending Sept. 18, 2026): https://www.eia.gov/dnav/pet/pet_sum_sndw_dcus_nus_w.htm
- EIA crude stocks including SPR: https://www.eia.gov/dnav/pet/pet_stoc_wstk_dcu_NUS_W.htm
- Oil & Gas 360 inventory wrap (commercial crude 426.4 million bbl, +3.0 million): https://www.oilandgas360.com/tag/crude-inventories/
- Dow Jones / Morningstar EIA recap: https://www.morningstar.com/news/dow-jones/202609235268/us-crude-oil-stockpiles-post-unexpected-build
- StorageCurve SPR series: https://storagecurve.com/crude-oil/us/strategic-petroleum-reserve/
- YCharts commercial crude ex-SPR: https://ycharts.com/indicators/us_ending_stocks_excluding_spr_of_crude_oil
Context
- YCharts U.S. horizontal rotary rigs (541 as of Sept. 25, 2026): https://ycharts.com/indicators/us_horizontal_rotary_rigs
- Trading Economics Baker Hughes total rigs: https://tradingeconomics.com/united-states/total-rigs
Figures in the body are from the September 26, 2026 WellDatabase report, Baker Hughes September 25 release, public Enverus snapshots, and the EIA WPSR for the week ending September 18, 2026. Weekly rig methodologies differ; year-over-year direction is the more durable signal.