
Electricity bills are rising across much of the United States, sparking heated debate. With AI fueling explosive data center growth, many point to hyperscale facilities as the culprit behind higher rates. But a new independent analysis from Energy + Environmental Economics (E3), released May 18, 2026, alongside corroborating work from Lawrence Berkeley National Laboratory (LBNL), paints a more nuanced picture: data centers are one factor among many, not the primary historical driver of rate increases. The relationship between load growth and retail rates is complex, and simplistic blame misses critical lessons about how electricity costs truly work — and why public understanding (including metrics like Levelized Cost of Energy or LCOE) needs updating.
Key Findings from the E3 Report
E3’s whitepaper, Understanding the Drivers of Rising Electricity Rates and the Role of Data Centers, reviewed 11 quantitative studies, interviewed experts, and performed original analysis (including PJM capacity auctions). It was funded by the Data Center Coalition but conducted independently.
Core conclusions:
No historical evidence of cost shifting from data centers to residential or small commercial customers under existing rate structures. In fact, data centers often generate net surplus revenue for utilities because of their high load factors (near-constant demand), which helps spread fixed costs over more kilowatt-hours sold.
One E3 analysis of Amazon data centers across four utility territories found each site generated roughly $3.4 million in net surplus on average (revenues exceeding incremental costs to serve them). Projections suggest even higher benefits over time.
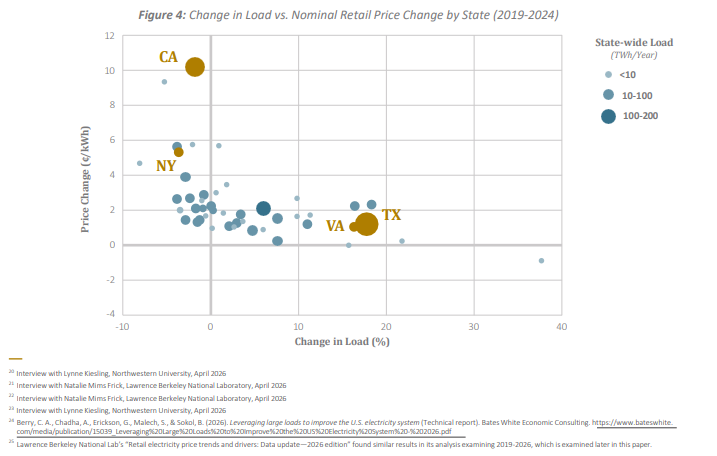
States with the largest load growth (e.g., Texas and Virginia, driven heavily by data centers) generally saw the smallest rate increases. States with flat or declining load (e.g., California and New York) often experienced the largest increases.
Load growth is only one driver among several. Major contributors to recent rate pressure include:
Inflation (labor, materials, financing)
Natural gas price volatility
Wildfire mitigation and grid resilience spending (especially in California)
Grid modernization and aging infrastructure replacement
Wholesale market design changes and supply dynamics (retirements, interconnection backlogs, resource accreditation rules)
In PJM (a key market with significant data center growth), E3’s analysis of the 2024/2025 to 2025/2026 capacity auctions attributed approximately 50% of the sharp capacity price increase to load growth (data centers represented ~93% of recent PJM load growth in the studied period). The other ~50% came from market design changes, power plant retirements, reduced accreditation of certain resources, and other supply-side factors. Capacity costs are only one component of a typical residential bill.
Regulatory adaptation is accelerating: At least 38 new large-load tariffs have been implemented since 2018, with 30 in 2025–2026 alone. These often include minimum demand charges, contribution-in-aid-of-construction (CIAC) requirements, long-term contracts, and exit fees to better align costs with causation.
Corroboration from LBNL and Other Sources
LBNL’s Retail Electricity Price Trends and Drivers: Data Update–2026 Edition (data through 2025) reaches very similar conclusions:
National average retail prices rose ~29% nominally (all sectors) from 2019 to 2025, with residential up ~33%. Real (inflation-adjusted) increases were modest.
States with the highest load growth generally saw real price declines. Load growth (especially commercial/industrial) spreads fixed transmission and distribution (T&D) costs.
Primary drivers of increases: T&D investments (wildfire mitigation, storm recovery, modernization), fuel/wholesale costs, new generation needs, policy costs (RPS compliance, net metering), and inflation.
Data centers feature prominently in future projections (EPRI estimates 9–17% of U.S. electricity by 2030, up from ~4–5% today), but historical empirical data do not show them as a dominant driver of past rate hikes outside specific constrained markets like parts of PJM.
Other analyses (e.g., Charles River Associates, Institute for Energy Research reviews of state-level data) align: rate increases have often tracked inflation or specific policy/infrastructure choices more than data center timing. Some media and advocacy pieces highlight future risks or PJM-specific wholesale spikes and call data centers a major contributor — these reflect legitimate concerns about projected strains but often overstate historical causation.
Virginia nuance (world’s largest data center market): E3’s earlier JLARC-commissioned study found current rates properly allocate costs with minimal historical shifting. However, unconstrained future growth would require massive new infrastructure, creating upward rate pressure for all customers unless mitigated by better planning, tariffs, and interconnection rules that pace load to infrastructure readiness.
The Real Cost of Electricity: It’s Not Just “Cheap Generation”
Retail electricity rates recover a utility’s full revenue requirement — embedded (historical) costs plus a regulated return — divided across sales (kWh), shaped by rate design across customer classes. Bills rise when total costs grow faster than sales volume, or when costs are misallocated.
Key insight from E3 and LBNL: High load-factor customers like data centers can lower average rates for everyone by improving system utilization — if they pay their full incremental costs plus a fair share of fixed costs. This is the opposite of subsidization.
Contrast this with public discourse that often fixates on the Levelized Cost of Energy (LCOE) of new generation (especially renewables). LCOE is a useful generation-side metric comparing technologies on a per-MWh basis over their lifetime. But it is incomplete for understanding customer bills because it largely ignores:
Transmission & distribution costs (often the biggest recent drivers)
System integration, capacity, and reliability needs
Policy adders (RPS compliance, net metering cost shifts)
Rate design and cost allocation
Wholesale market dynamics and capacity prices
This is exactly where redefining or supplementing LCOE for public understanding becomes relevant. Average people see rising bills and hear “solar/wind is the cheapest,” yet costs go up. A better framework would emphasize:
Full “all-in” or system LCOE (including integration, transmission, and firming costs)
Cost causation principles in rate design (new large loads should pay for the incremental infrastructure they trigger)
Utilization and load factor effects — not all demand growth is equal
Transparent bill breakdowns showing generation vs. delivery vs. policy vs. other components
Metrics focused on customer bill impact and revenue requirement per kWh sold, rather than isolated generation costs
E3 stresses distinguishing incremental costs caused by new loads from baseline needs. Without this, debates stay polarized (“data centers are evil” vs. “any load growth is always good”).
Who Is Responsible?
Not data centers alone. Responsibility is shared:
Data center operators & tech companies: Rapid, concentrated demand strains systems. They should engage in proactive co-investment (e.g., “bring your own generation,” long-term contracts, flexibility, on-site resources) and support better forecasting.
Utilities: Prudent planning, accurate forecasting (avoiding both under- and over-build), and proposing fair tariffs.
Regulators & policymakers: Updating cost allocation, approving adaptive large-load tariffs, streamlining (but not shortcutting) permitting for needed supply and transmission, and balancing reliability, affordability, and decarbonization. PJM and several states (Georgia, Arizona, Missouri, Texas via SB 6) are already adapting.
Broader system factors: Retirements without adequate replacement, interconnection queues, supply chain/inflation pressures, and policy-driven costs (wildfire rules, renewable mandates without full cost accounting).
One key fact: Blue States are, on average, 38% higher than Red States in energy.
Data centers bring real benefits: jobs, tax revenue, and economic activity. When properly integrated, their steady demand can support grid investments that benefit all customers.
Looking Ahead
Projections show continued strong data center growth. Forward-looking studies flag risks in tight supply situations, but tools exist: tailored tariffs, financial commitments from large loads, demand flexibility, “bring your own generation,” improved planning/forecasting, and accelerated (yet reliable) supply additions.
The E3 report recommends strengthening planning to avoid speculative overbuild, regularly updating cost allocation, enabling innovative supply/load integration, and closing research gaps.
Bottom Line
Data centers are not the main historical driver of rising electricity rates, according to rigorous quantitative reviews by E3 and LBNL. Multiple factors — many unrelated to load growth — explain most increases. However, in capacity-constrained markets like PJM, their contribution to wholesale price signals is significant and requires proactive management.
The deeper issue is helping the public (and policymakers) understand the real mechanics of electricity costs beyond headline LCOE numbers or scapegoating one industry. Transparent cost causation, modern rate design, and system-level thinking will determine whether this wave of load growth becomes a burden or a catalyst for a stronger, more affordable grid.The data centers aren’t going away — nor is our growing digital economy.
A smart policy that aligns incentives, allocates costs fairly, and accelerates needed infrastructure can turn rapid demand growth into lower unit costs for everyone.
What do you think? Should data centers be required to bring their own generation or sign long-term firm contracts? How do we better communicate the difference between generation LCOE and actual customer bills? Join the conversation on the Energy News Beat Channel.
Appendix: Sources and Links
- E3 Whitepaper (May 2026): Understanding the Drivers of Rising Electricity Rates and the Role of Data Centers — PDF
- E3 Summary Page: Are Data Centers Driving Up Electricity Rates? A New E3 Whitepaper Examines the Quantitative Evidence
- LBNL Retail Electricity Price Trends and Drivers: Data Update–2026 Edition — PDF
- E3 JLARC Virginia Data Center Study (related prior work): E3 page and JLARC materials
- EIA Electric Power Monthly (price and sales data): EIA site
- Additional context: EPRI data center scenarios, PJM capacity auction reports and IMM analyses, various state tariff dockets (Georgia, Arizona, Missouri, Texas SB 6), and cross-referenced reporting from Utility Dive, Reuters, and others on PJM dynamics.
This article synthesizes publicly available analyses for the Energy News Beat audience. Views expressed aim for maximum truth-seeking based on the cited evidence.