Norway’s Aker Solutions has secured more work from Dragados Offshore, picking up a contract to build steel substructure for the BalWin2 high-voltage direct current (HVDC) converter station, part of the 2 GW offshore wind grid connection system in Germany. The BalWin2 project is being developed by Amprion Offshore.The contract, valued between NOK1.5bn ($147m) and NOK 2.5bn ($245m), builds on a previous agreement announced in February and involves the execution of an option for a second converter station within the broader BalWin project.Work on the substructure will take place at Aker Solutions’ fabrication yard in Verdal, Norway. The company expects the project to support more than 450 jobs at peak activity. Aker Solutions’ scope of work includes procurement, fabrication engineering, and construction.Preparatory work is set to begin in the first quarter of 2026, with construction starting in early 2027. Final delivery is scheduled for 2029.
The announcement above prompted me to examine the overall German Energy mix and the rankings of energy costs in Germany. As part of a larger article, we are examining the overall costs of Net Zero policies and their negative environmental impacts.
Germany’s Overall Energy Mix
Based on available data, Germany’s energy mix for electricity generation in 2024 is as follows (percentages are approximate and based on net public electricity generation unless stated otherwise):
-
Wind: 29.4% (predominantly onshore wind at 25.9%, with offshore contributing the rest)
-
Coal: 21% (includes lignite at ~14% and hard coal at ~7%)
-
Solar: 13.5%
-
Natural Gas: 12.1%
-
Biofuels/Biomass: 9.1%
-
Hydropower: 8.7%
-
Net Imports: 5.1% (Germany was a net importer in 2024, with imports mainly from Denmark, Norway, Sweden, and France)
-
Oil: 0.7%
-
Other (e.g., non-renewable waste, unspecified): 0.3%
Notes:
-
Renewables (wind, solar, biofuels, hydropower) accounted for ~59% of net public electricity generation in 2024, up from 56% in 2023.
-
Primary energy consumption (including electricity, heating, and transport) is broader. In 2023, Germany’s primary energy consumption was 3,169.55 TWh, with fossil fuels (coal, gas, oil) dominating, though renewables have grown significantly (~60% of the power mix in 2024 came from renewables).
-
Energiewende: Germany’s energy transition policy has driven renewable growth, with wind and solar contributing ~43% of the power mix in 2024, up from 8% in 2010.
This mix reflects electricity generation specifically. For total primary energy (including transport and heating), fossil fuels (oil, gas, coal) still play a larger role, but exact percentages for 2024 are not fully detailed in the sources.
Ranking Energy Costs for Top 10 Countries (Last 10 Years)
Ranking the cost of energy across countries over the last 10 years is complex due to varying metrics (e.g., household vs. industrial prices, electricity vs. total energy, wholesale vs. retail), currency fluctuations, and data availability. The most consistent data available is for household electricity prices (EUR/kWh, including taxes and VAT) from Eurostat for EU countries, covering 2015–2024. Non-household (industrial) prices and total energy costs (including gas, heating) are less uniformly reported across non-EU countries.
Assumptions and Scope:
-
Metric: Household electricity prices (EUR/kWh) for medium-sized consumers (2,500–5,000 kWh/year), as these are widely reported.
-
Timeframe: 2015–2024 (or latest available data).
-
Countries: Focused on EU countries and select non-EU countries (e.g., Norway, UK) where data is available. Global non-EU countries (e.g., USA, China) lack consistent EUR-based household price data over 10 years.
-
Data Source: Primarily Eurostat, supplemented by IEA and other sources where applicable.
-
Cost Ranking: Based on average household electricity prices over the period, adjusted for inflation where possible. Note that costs vary by year due to market dynamics (e.g., 2022 energy crisis).
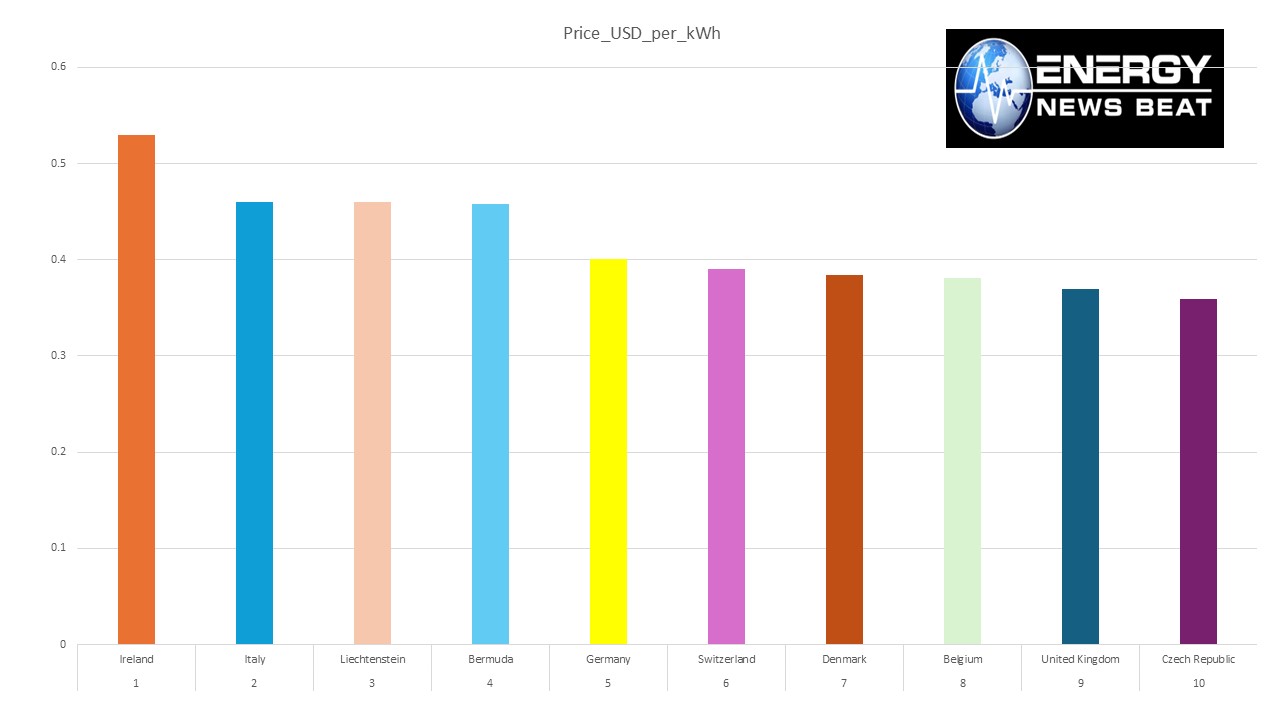
Top 10 Countries by Household Electricity Prices (2015–2024): Below is a ranking based on average household electricity prices (EUR/kWh) for the second half of each year, derived from Eurostat data and other sources. Prices are averaged over 2015–2024 (or available years) and include taxes and VAT. Non-EU countries like the USA or China are excluded due to inconsistent data in EUR/kWh over the full period.
|
Rank
|
Country
|
Avg. Price (EUR/kWh)
|
Notes
|
|---|---|---|---|
|
1
|
Germany
|
~0.32
|
Highest in EU due to renewable energy fees (EEG until 2022), taxes.
|
|
2
|
Denmark
|
~0.29
|
High taxes, strong renewable integration.
|
|
3
|
Belgium
|
~0.27
|
High network and environmental costs.
|
|
4
|
Ireland
|
~0.25
|
Rising prices post-2020 due to gas reliance.
|
|
5
|
Italy
|
~0.24
|
High energy import costs, taxes.
|
|
6
|
Austria
|
~0.22
|
Stable prices, renewable-heavy mix.
|
|
7
|
Spain
|
~0.22
|
Spiked in 2022 due to gas prices.
|
|
8
|
Netherlands
|
~0.21
|
Price drops in 2020 due to tax refunds.
|
|
9
|
Sweden
|
~0.20
|
Low prices due to hydro, nuclear; spiked in 2022.
|
|
10
|
France
|
~0.19
|
Nuclear-heavy mix keeps prices relatively low.
|
Key Observations:
-
Germany: Consistently the highest due to renewable energy surcharges (EEG, abolished in 2022), grid fees, and taxes. Prices peaked in 2022 (~0.35 EUR/kWh) during the energy crisis.
-
Denmark and Belgium: High due to taxes and renewable investments, though Denmark’s prices are partly offset by efficient energy use.
-
2022 Spike: The Russia-Ukraine war drove prices up across Europe, with Germany’s wholesale prices hitting 235 EUR/MWh in 2022 (vs. 40 EUR/MWh in 2020).
-
Non-EU Data: Limited data for countries like the USA (avg. 0.12 EUR/kWh in 2020, converted from USD) or China prevents inclusion in the ranking. Norway (0.18 EUR/kWh in 2020) could rank ~10th if included.
-
Industrial Prices: Germany also had the highest non-household prices (~0.18 EUR/kWh in 2020), impacting industry competitiveness.
Limitations:
-
Data Gaps: Full 10-year data for non-EU countries (e.g., USA, Japan) in EUR/kWh is unavailable or inconsistent.
-
Total Energy Costs: Combining electricity, gas, and heating costs is complex and not uniformly reported.
-
Wholesale vs. Retail: Wholesale prices (e.g., Germany’s 78.51 EUR/MWh in 2024) differ significantly from retail prices.
-
Currency Fluctuations: Non-EU prices require conversion, introducing variability.