

Delinquency rates unchanged, more buyers paid cash to dodge interest rates, prime is pristine, subprime (14% of originations) is (always) in trouble.
By Wolf Richter for WOLF STREET.
About 80% of new vehicles purchased in the US in 2024 were financed with loans or leases, down from 85% in Q1 2022, as higher interest rates have induced a larger share of buyers to pay cash. Due to their convenience, leases have remained popular with people who could easily pay cash.
In terms of used vehicles, about 37% of the purchases were financed, down from 42% in early 2022, as a larger share of buyers paid cash. This financing data is from Experian, based on the credit data it obtains and collects on all consumers.
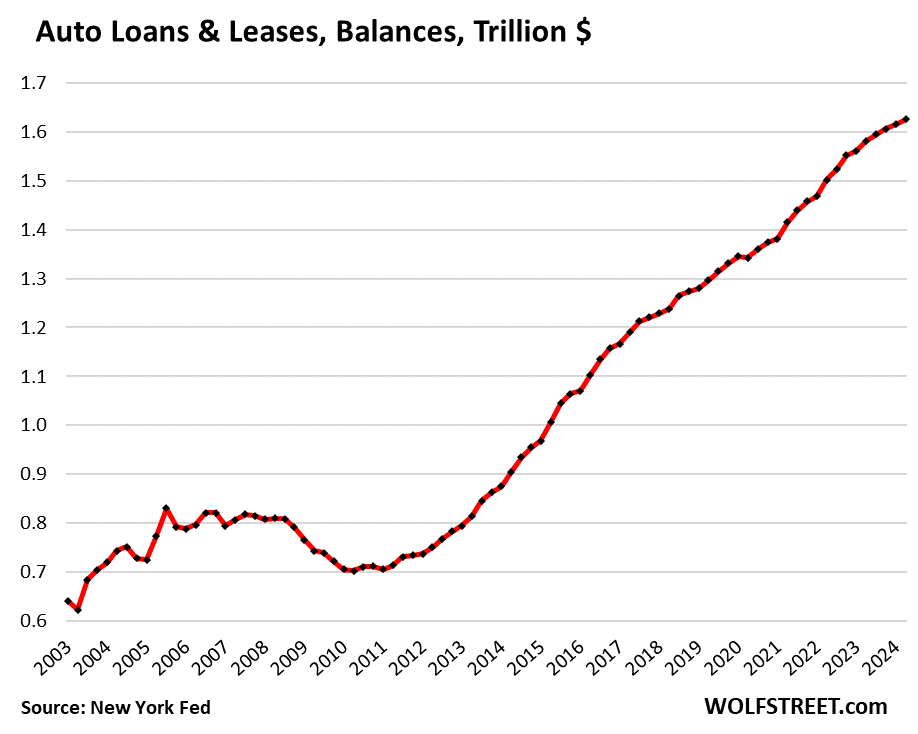
So, total balance of auto loans and leases for new and used vehicles rose by only 0.6% in Q2 from Q1, and by only 2.8% year-over-year, to $1.63 trillion, according to data from the New York Fed’s Household Debt and Credit Report.
The 2.8% growth rate for the 12-month period was the smallest since Q1 2021 (+2.7%) and the second smallest since 2011, though new and used vehicle retail sales during this period been the highest since before the pandemic.
The two main factors that caused the growth of auto loan balances to be so unusually low were:
A larger portion of our Drunken Sailors, as we facetiously and lovingly have come to call them, paid cash to dodge the high interest rates;
Used-vehicle prices have come down hard, and new vehicle prices have started to fall, reducing the amounts to be financed (see here for details and charts of new-vehicle CPI and used-vehicle CPI).
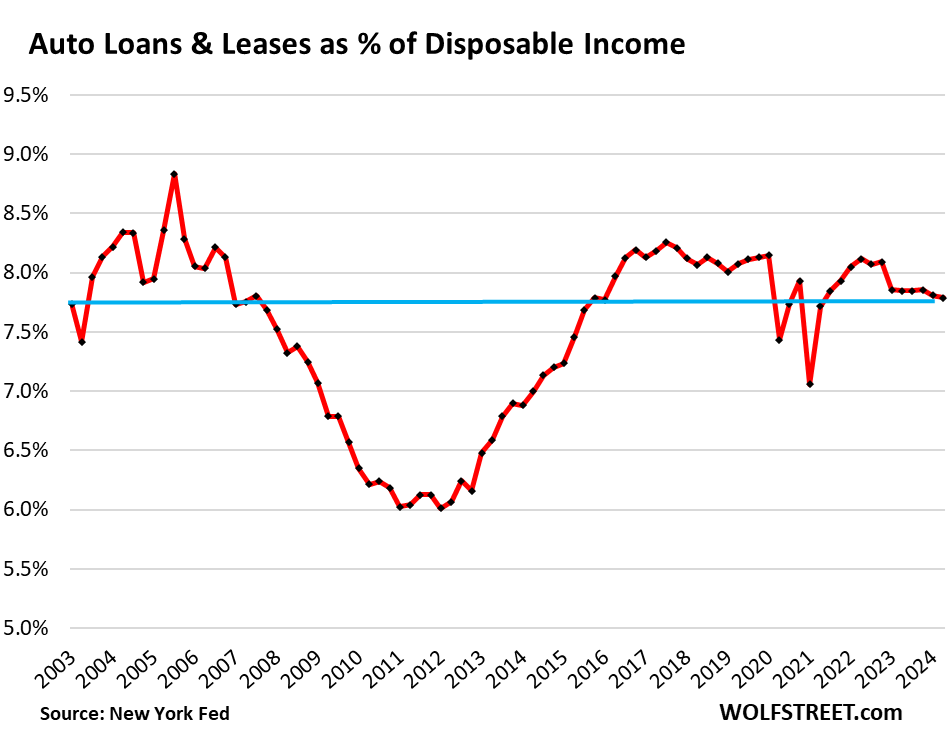
And the auto-debt burden dipped further.
One way to measure the burden of auto-loan debt on households is the comparison to their disposable income, which includes wages, interest, dividends, rental income, farm income, small business income, transfer payments, etc. minus payroll taxes and social insurance payments. It’s what households have left over to pay for their costs of living and service their debts.
Disposable income has risen faster than auto-loan balances. So, the total balance of auto loans and leases dipped to 7.79% of disposable income, the lowest since the free-money Q1 2021, and beyond the free-money era, the lowest since 2015.
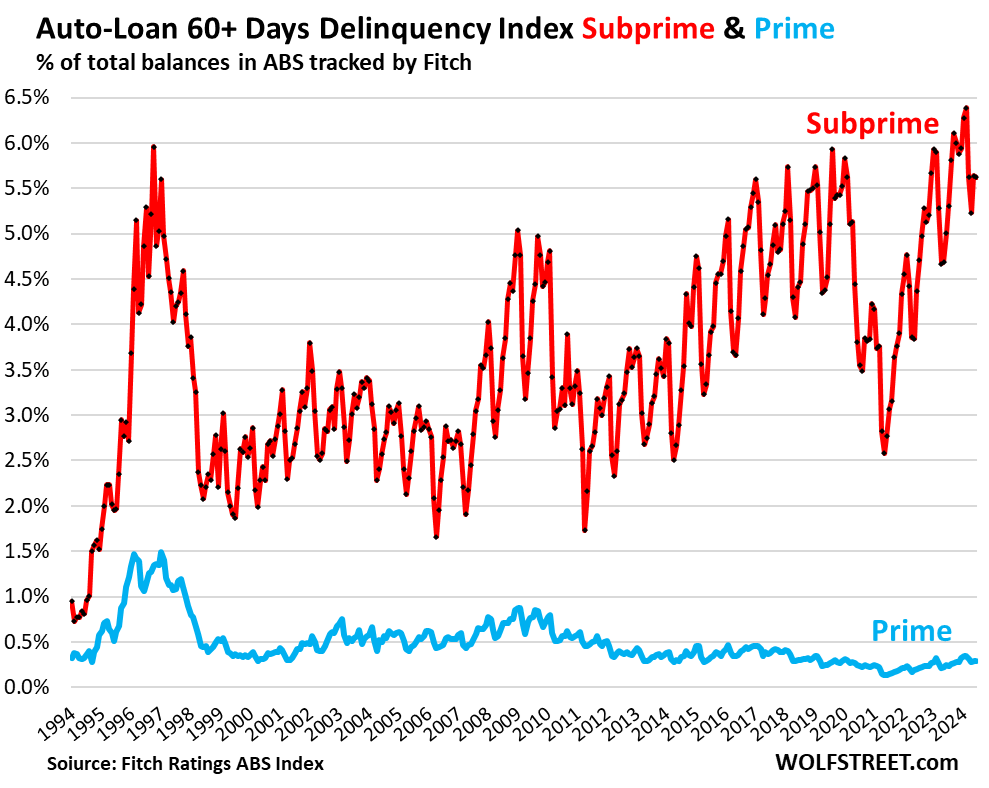
Subprime = bad credit, high risk, high profit. Not low income.
Subprime lending plays almost no role in new vehicle financing and is confined to used vehicles, particularly older used vehicles, and largely through subprime-specialized dealer/lender chains. In 2024, the share of subprime lending dropped to 14% of total loan and lease originations.
Subprime auto lending depends on lenders being able to securitize these auto loans into Asset Backed Securities (ABS) and sell them as bonds to pension funds and other institutional investors.
But as yields on Treasury bills rose to levels previously occupied by subprime auto-loan ABS, investors lost some interest, and funding got more difficult. And as the pandemic free-money dried up, delinquencies in the subprime segment jumped from multi-year lows.
During the free-money era, the specialized subprime dealer/lenders loosened their credit standards and got very aggressive and very greedy with huge profit margins and interest-rate spreads. At the same time, used-vehicle prices exploded. And the risks piled up. And when used-vehicle prices began to tank and interest rates began to jump, those risks came home to roost.
In 2023, several PE-firm-owned subprime-specialized dealer-chains filed for bankruptcy, and even the large publicly traded subprime dealer/lender Car-Mart disclosed massive problems in December, after investors got leery of buying the subprime auto-loan ABS.
Subprime 60-plus day delinquency rate in June dipped a hair to 5.62% (from 5.64% in May), but was up 61 basis points from June last year, according to Fitch data, which tracks subprime ABS. The rate, which is very seasonal, had hit a record in February of 6.39%.
But prime loans are rock-solid with minuscule delinquency rates below 0.3% for the past three months (blue).
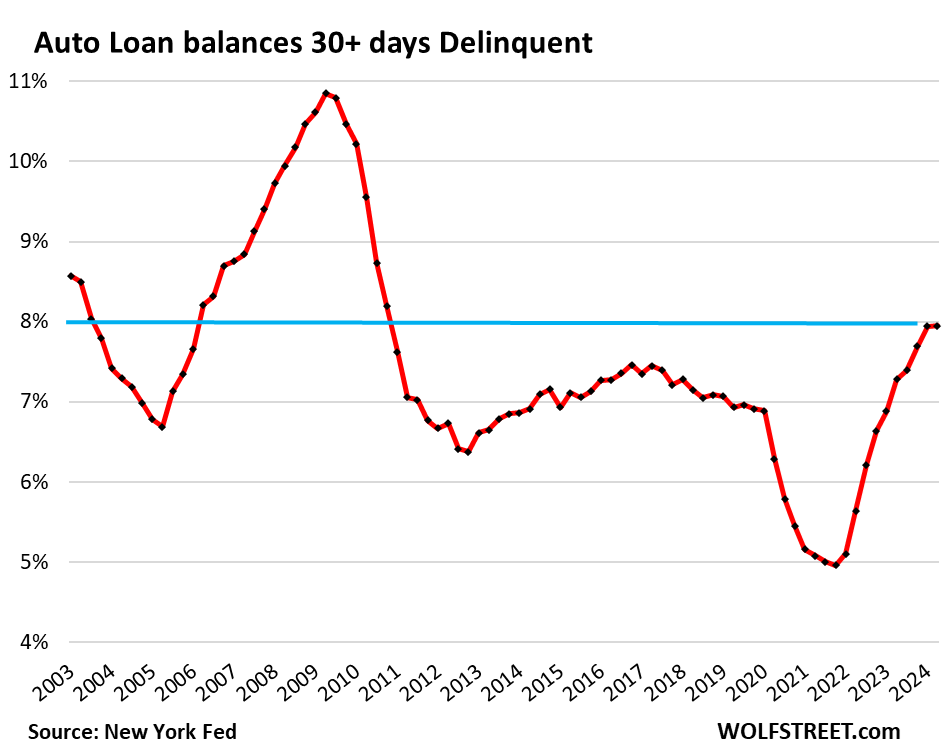
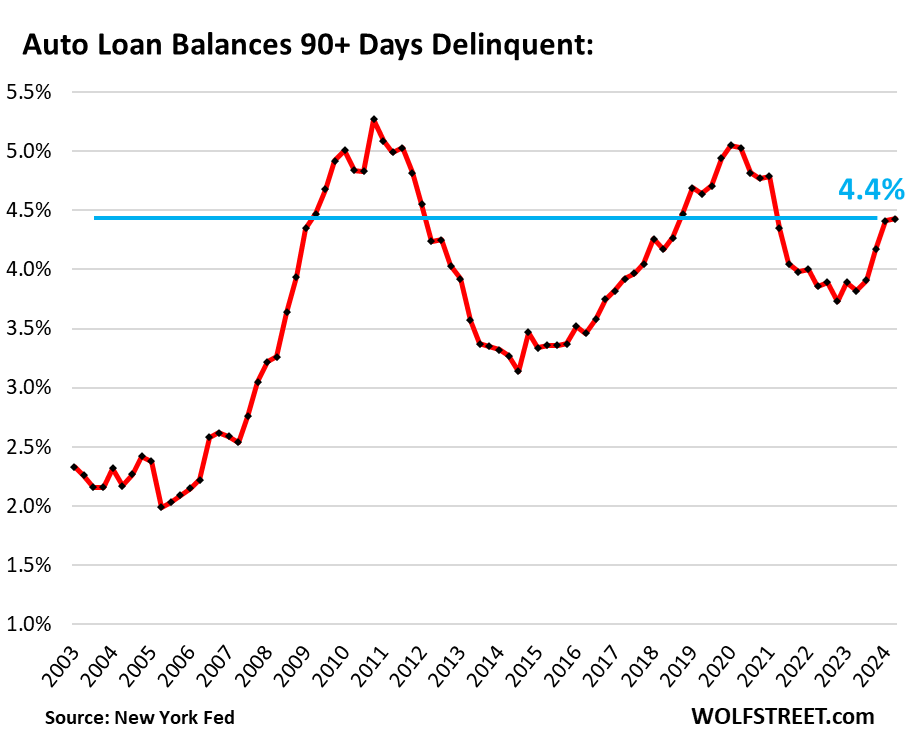
Overall auto-loan delinquency rates, according to the New York Fed’s data, come in two flavors:
The 30-day delinquency rate tracks borrowers as they transition into delinquency. It’s usually higher than the 60-day or 90-day delinquency rates as many borrowers catch up again with their payments and come out of delinquency, no big deal.
The 60-day delinquency rate – which Fitch tracks above – is more serious than the 30-day rate. Fitch splits it into two: subprime, which is always in trouble; and prime, which is in pristine condition. Also, Fitch’s data is based on the ABS that Fitch tracks. For these two reasons, it cannot be compared to the delinquency rates by the New York Fed, based on Equifax data from all consumers.
The 90-day delinquency rate (“serious delinquencies”) tracks the borrowers that are having trouble catching up. It is the lowest rate because many borrowers are able to cure their arrearage before it gets this far.
The 30-plus-day delinquency rate in Q2, at 7.95%, was essentially unchanged from Q1, according to New York Fed data from Equifax. During the Good Times before the pandemic, the rate was between 7.2% and 7.5%. The difference is the surge in the corner of subprime.
The 90-plus-day delinquency rate, at 4.4% in Q2, was also essentially unchanged from Q1.
In both metrics (30-days and 90 days), it looks like the rise from the ultra-low levels of the free-money era has topped out:
In case you missed the earlier parts of household debt and credit, from Wednesday and Tuesday:
Here Come the HELOCs: Mortgages, the Burden of Mortgage Debt, Delinquencies, and Foreclosures in Q2
Enjoy reading WOLF STREET and want to support it? You can donate. I appreciate it immensely. Click on the beer and iced-tea mug to find out how:
Would you like to be notified via email when WOLF STREET publishes a new article? Sign up here.
Take the Survey at https://survey.energynewsbeat.com/