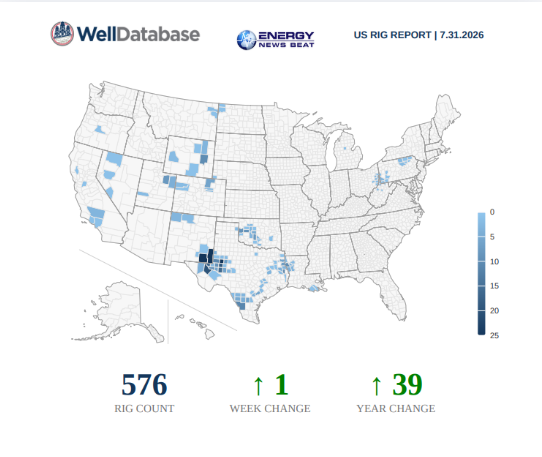
U.S. oil and gas drillers added a single active rig in the latest weekly tallies, signaling continued capital discipline and steady rather than accelerating activity heading into late summer 2026. According to the WellDatabase US Rig Report dated July 31, 2026 (published in partnership with Energy News Beat), the national active rig count reached 576, up 1 from the prior week and up 39 from the same period a year earlier.
Baker Hughes, the long-standing industry benchmark for rotary rig activity, reported a parallel modest gain. Its North America Rig Count for the week ending July 31, 2026, showed the U.S. total at 588, up 1 from 587 the previous week. Oil-directed rigs rose by 1 to 451, while gas-directed rigs held flat at 127 (with miscellaneous making up the balance). This follows a slight dip the prior week and keeps the count roughly 45–46 rigs higher than mid-to-late July 2025 levels.
Enverus, which tracks a broader share of the fleet daily primarily via GPS, continues to report higher absolute numbers consistent with its methodology. Recent late-July readings hovered near 648, essentially flat week-over-week. Enverus typically captures a wider set of active units than the weekly rotary census approaches used by Baker Hughes and WellDatabase.
Comparing the Counts
Differences across the three sources are expected and well-documented:
- Baker Hughes: Focuses on significant rotary rigs actively drilling (the traditional industry barometer). Latest: 588 (+1 WoW).
- WellDatabase: Provides detailed operator, state, basin, and well-type visibility; current snapshot 576 (+1 WoW, +39 YoY).
- Enverus: Higher-frequency GPS-based tracking of >95% of the fleet, often running 60–70+ rigs above Baker Hughes.
All three point to the same underlying trend: activity has recovered meaningfully from 2025 lows and stabilized in the mid-to-high 500s (Baker/WellDatabase) to mid-600s (Enverus), without a sharp acceleration.
Basins and States with the Strongest Activity
The accompanying WellDatabase map for July 31 shows the heaviest concentration of active rigs (darkest blue shading on the 0–25 scale) across the Permian Basin in West Texas and southeastern New Mexico. Secondary clusters appear in Oklahoma, North Dakota (Williston/Bakken), Pennsylvania (Appalachia), and scattered locations in Colorado, Louisiana, and Wyoming. Alaska and most of the eastern seaboard remain quiet.
From the most recent detailed basin breakdown available (WellDatabase as of the prior week ending July 24, which provides useful context given the modest national change):
- Permian remained the clear leader at approximately 256 rigs (still nearly half of national activity despite a weekly dip in that report).
- Haynesville held near 55 with solid year-over-year gains.
- Eagle Ford showed recent weekly strength around the mid-40s.
- Other notable plays included the Williston, Cana-Woodford, Marcellus, and Utica.
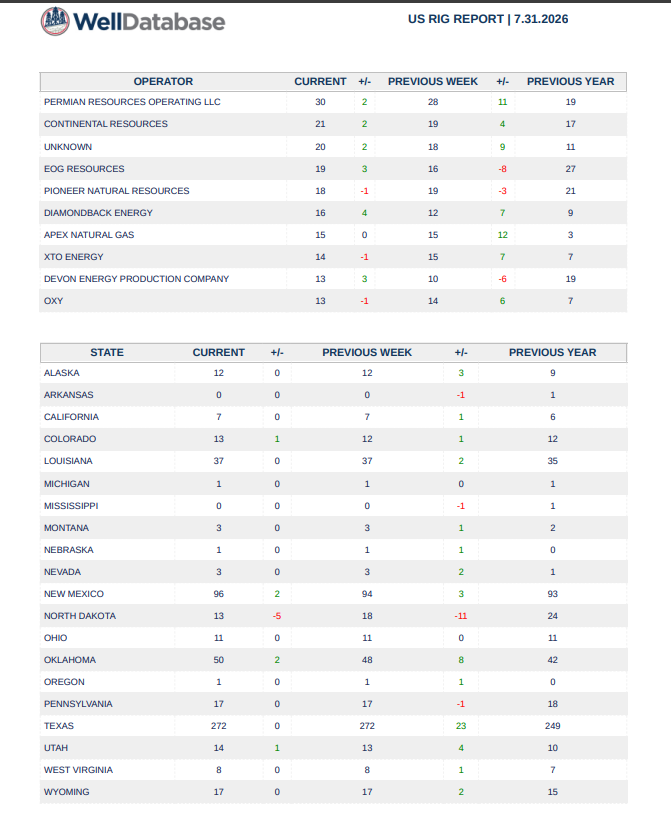
State-level leadership tracks the basins: Texas dominates by a wide margin, followed by New Mexico, Oklahoma, Louisiana, North Dakota, and Pennsylvania. These states continue to host the bulk of both oil- and gas-directed work.
The modest national +1 gain this week was likely distributed rather than concentrated in any single basin, consistent with operators prioritizing high-return acreage and efficiency over broad fleet expansion.
Implications for Investors and Consumers
For investors, the data reinforce a picture of disciplined U.S. shale operators. Companies are maintaining enough activity to support production growth or flat-to-modest increases while protecting balance sheets and returning capital to shareholders. Service providers (drilling contractors, pressure pumpers, and equipment suppliers) benefit from the stable base and year-over-year recovery, but the lack of a sharp upcycle limits near-term upside in day rates and utilization. Energy equities and related ETFs may see support from the higher year-ago comparisons and the absence of a sharp drop-off, yet the “modest gain” narrative suggests limited catalysts for aggressive multiple expansion unless oil prices strengthen further or inventory draws accelerate.
For consumers, the steady rig count is generally constructive. Continued drilling, combined with well-known efficiency gains (more production per rig), helps underpin domestic oil and natural gas supply. This reduces the risk of sudden shortages and supports more stable energy prices at the pump and for home heating/electricity, even as global factors (geopolitics, OPEC+ decisions, and demand trends) continue to influence the broader market. A plateau rather than a boom also lowers the chance of oversupply that could pressure prices sharply lower in the near term.
Overall, U.S. drillers are in a “steady as she goes” mode. The modest one-rig gain on July 31 keeps activity well above year-ago levels without signaling a return to the rapid build-ups of prior cycles. Watch the Permian closely—it remains the swing factor for both national totals and future production.
We highly recommend getting a subscription to WellDatabase.com
Appendix: Sources and Links
- WellDatabase / Energy News Beat US Rig Report, July 31, 2026 (attached map and summary: 576 total, +1 week, +39 year).
- Baker Hughes Rig Count Overview: https://rigcount.bakerhughes.com/ (latest weekly North America data; July 31, 2026 report available via the NA Rig Count page).
- Baker Hughes detailed historical and weekly tables: https://www.aogr.com/web-exclusives/us-rig-count
- Enverus U.S. Daily Rig Count: https://www.enverus.com/dailyrigcount/ and https://app.drillinginfo.com/drc/
- Prior-week comparative analysis (July 24 data used for basin/state context): Energy News Beat – “Mixed Rig Totals Signal Slowing on Active Rigs”
energynewsbeat.co
- Real-time confirmation of Baker Hughes July 31 figures via market reports on X (multiple independent posts citing 588 total / 451 oil / 127 gas).
Data current as of July 31, 2026. Methodological differences mean absolute numbers should not be mixed without context; trends across providers are more informative than single-week point estimates.