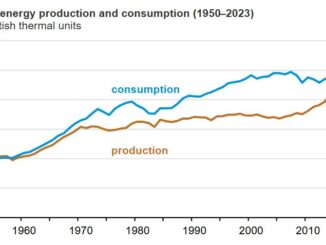


Beginning with this month’s Short-Term Energy Outlook (STEO), we are including new regional crude oil and natural gas production forecasts to provide a more complete breakout of U.S. Lower 48 (L48) states production data.
We will include a crude oil and marketed natural gas production forecast for:
- Appalachia
- Bakken
- Eagle Ford
- Haynesville
- Permian
- The rest of the U.S. L48

Note: L48=Lower 48 states
The forecasts will be available in STEO Table 4a and STEO Table 5a. Previously, our crude oil and natural gas production forecasts were limited to total L48, Alaska, and Federal Gulf of Mexico.
We are also adding two new tables to STEO with additional production details. Table 10a will detail drilling and productivity metrics for these regions, and Table 10b will detail production for tight oil and shale natural gas. This information was formerly published in the Drilling Productivity Report, which we will no longer publish.
New production tables
The new forecasts show production geographically, rather than by geologic formation. Most of the crude oil or natural gas in the United States comes from counties overlaying these five major producing areas. The category that covers the rest of the L48 aggregates production from smaller regions such as Niobrara and Anadarko. Together, the five regions and the rest of L48 together account for our total L48 production forecast.
The Permian was the source of 45% of U.S. crude oil production in 2023—the most of any region in the United States—and 20% of the marketed natural gas—the second most of any U.S. region. We forecast crude oil production in the Permian will increase by 320,000 barrels per day (b/d) to average 6.6 million b/d in 2025. Most of the natural gas produced in the Permian is associated natural gas, produced from oil directed wells. Completion of new natural gas pipelines will allow producers to transport more of the associated natural gas, removing constraints on crude oil production. We estimate that marketed natural gas production from the Permian will also grow by 1.8 billion cubic feet per day (Bcf/d) to 25.5 Bcf/d in 2025 with the new pipelines in place.
Production from Appalachia and Haynesville together accounted for 46% of all U.S. marketed natural gas production in 2023 but less than 2% of U.S. crude oil production in 2023.
We forecast that in 2025 the Appalachia and Haynesville regions will continue to be large sources of natural gas. We expect the Haynesville region to account for 14% of the U.S. marketed natural gas production in 2025 because the region is close to infrastructure connecting natural gas supply to growing liquefied natural gas export facilities. The Appalachia region has been the source of almost a third of the marketed natural gas production for over a decade, and we expect the trend to continue in 2025.
The Eagle Ford and Bakken combined was the source of 19% of U.S. crude oil production in 2023 and 9% of marketed natural gas production in 2023. Crude oil production in the Eagle Ford and Bakken has contracted, decreasing from around a quarter of U.S. production in 2017 to 19% in 2023. We estimate that in 2025 these two regions will supply slightly less than a fifth of U.S. total crude oil production.
Drilling productivity metrics
The new STEO Table 10a includes the active rig count, new wells drilled, and new wells completed. The drilled but uncompleted well count (DUC) is derived from these metrics.
The updated STEO tables will also provide a comprehensive overview of productivity metrics, breaking down each region’s monthly production into two key components: new-well production and existing production change. New-well production represents the output from wells in their first full month of production, while existing production change captures the difference in monthly production from wells beyond their first full month. The existing production change metric details show how production would change if no new wells were added. The production metrics presented in the STEO tables are reported as a one-year trend of raw data points to capture the trend of technological advances and efficiency gains.
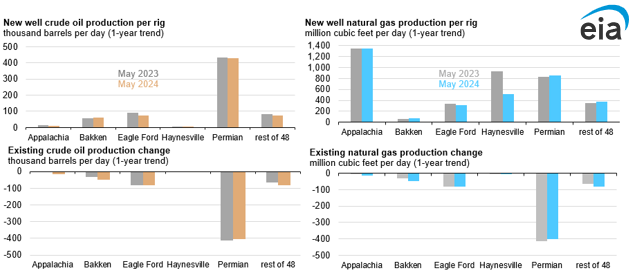
Note: Rest of 48=rest of the Lower 48 states
Take the Survey at https://survey.energynewsbeat.com/