
Four already-run auctions locked that figure in. December’s auction could add $5–10 billion more if forecast load stays in and clears at the cap. Politicians did not invent the number — and data centers did not invent the tight grid that produced it.
If you live in the 13-state-plus-D.C. PJM region — about 67 million consumers — two documents landed this week that sound like they disagree. On Wednesday, Drew Bond argued in the Washington Times that “politicians, not data centers, are causing an energy crisis,” and that AI loads have become “a convenient scapegoat for politicians who are eager to distract from the real cause of rising utility rates: government policy.” On Thursday, PJM’s independent market monitor, Monitoring Analytics, reported that including existing and forecast data-center load in the capacity market has already produced “an irreversible increase of $29.4 billion in capacity market costs for all customers to date.”
Both can be true in their own lanes, and both overreach as a national slogan. The monitor’s figure is a PJM wholesale capacity counterfactual, not a verdict on every U.S. electric bill since 2015. Bond even concedes the PJM exception — “in the PJM market data center growth has accelerated price increases” — before arguing that any new load would have done the same. Another $5–10 billion could be added in December if forecast data-center load stays in that auction and it clears at the cap — a forecast, not a result.
What the nine-month bill actually shows
The Q3 2026 State of the Market report, released Nov. 12, covers January through September 2026 — the first nine months, not “the third quarter.” A same-day S&P Global account called the $111.61 and $101.66 figures third-quarter results. Wholesale power cost $111.61/MWh, or $70.81 billion, up 40.9% from $79.19 ($48.60 billion) a year earlier. Energy was still the largest piece, at $70.89/MWh, or 63.5% of the total, up 46.3%. Capacity jumped 81.1%, to $19.42/MWh (17.4%). Transmission rose 4.6%, to $19.16/MWh (17.2%). Together, 98.1%. Without data-center load and its impact on capacity costs for the 2025/2026 and 2026/2027 Delivery Years only, that average would have been $101.66/MWh — a $9.95, or 9.8%, adder that “does not include the impact on energy or transmission costs” and does not include the 2027/2028 or 2028/2029 delivery years, which had not begun. Joseph Bowring said the energy market was competitive in the first nine months. The capacity auctions for those four delivery years “were not competitive, primarily as a result of the inclusion of forecast demand for data centers.”
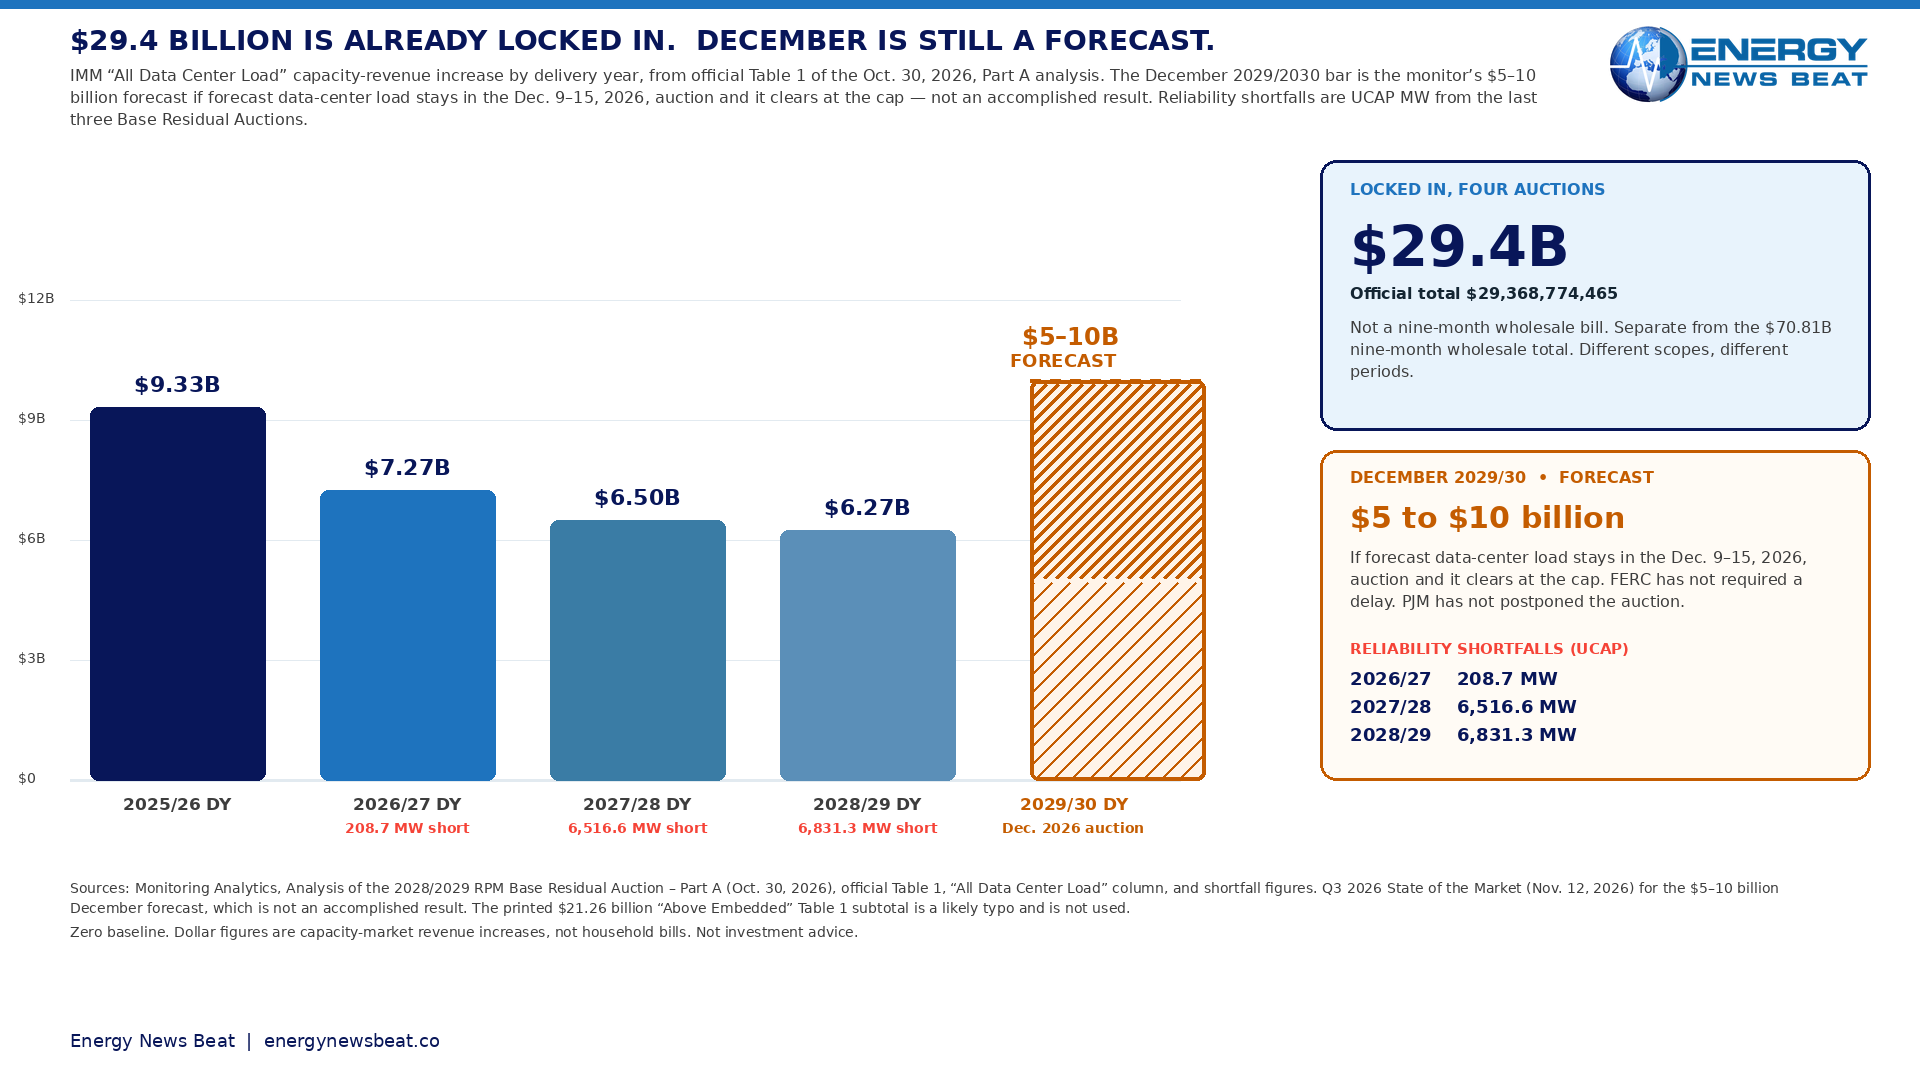
The $29.4 billion that is already locked in
The $29.4 billion figure measures how much capacity-market revenues rose because existing and forecast data-center load was included in the peak-load forecast for four already-run Base Residual Auctions.
Official Table 1 in the Oct. 30 analysis of the 2028/2029 auction lists, under the “All Data Center Load” column, $9.33 billion in 2025/2026 ($9,332,103,858), $7.27 billion in 2026/2027 ($7,271,197,971), $6.50 billion in 2027/2028 ($6,497,653,512), and $6.27 billion in 2028/2029 ($6,267,819,123). The four lines sum to $29,368,774,464. The monitor states the total as $29,368,774,465, or $29.4 billion. “Irreversible” means those auctions have already been run. That total should not be compared with the $70.81 billion January–September wholesale bill; they measure different things over different periods. Later-year impacts were compressed by a temporary FERC-accepted cap and floor, with the cap initially $325 per MW-day, from a settlement with Pennsylvania Gov. Josh Shapiro’s office. A separate $7.6 billion ARR/FTR under-return is a congestion-rights issue, not part of the $29.4 billion.
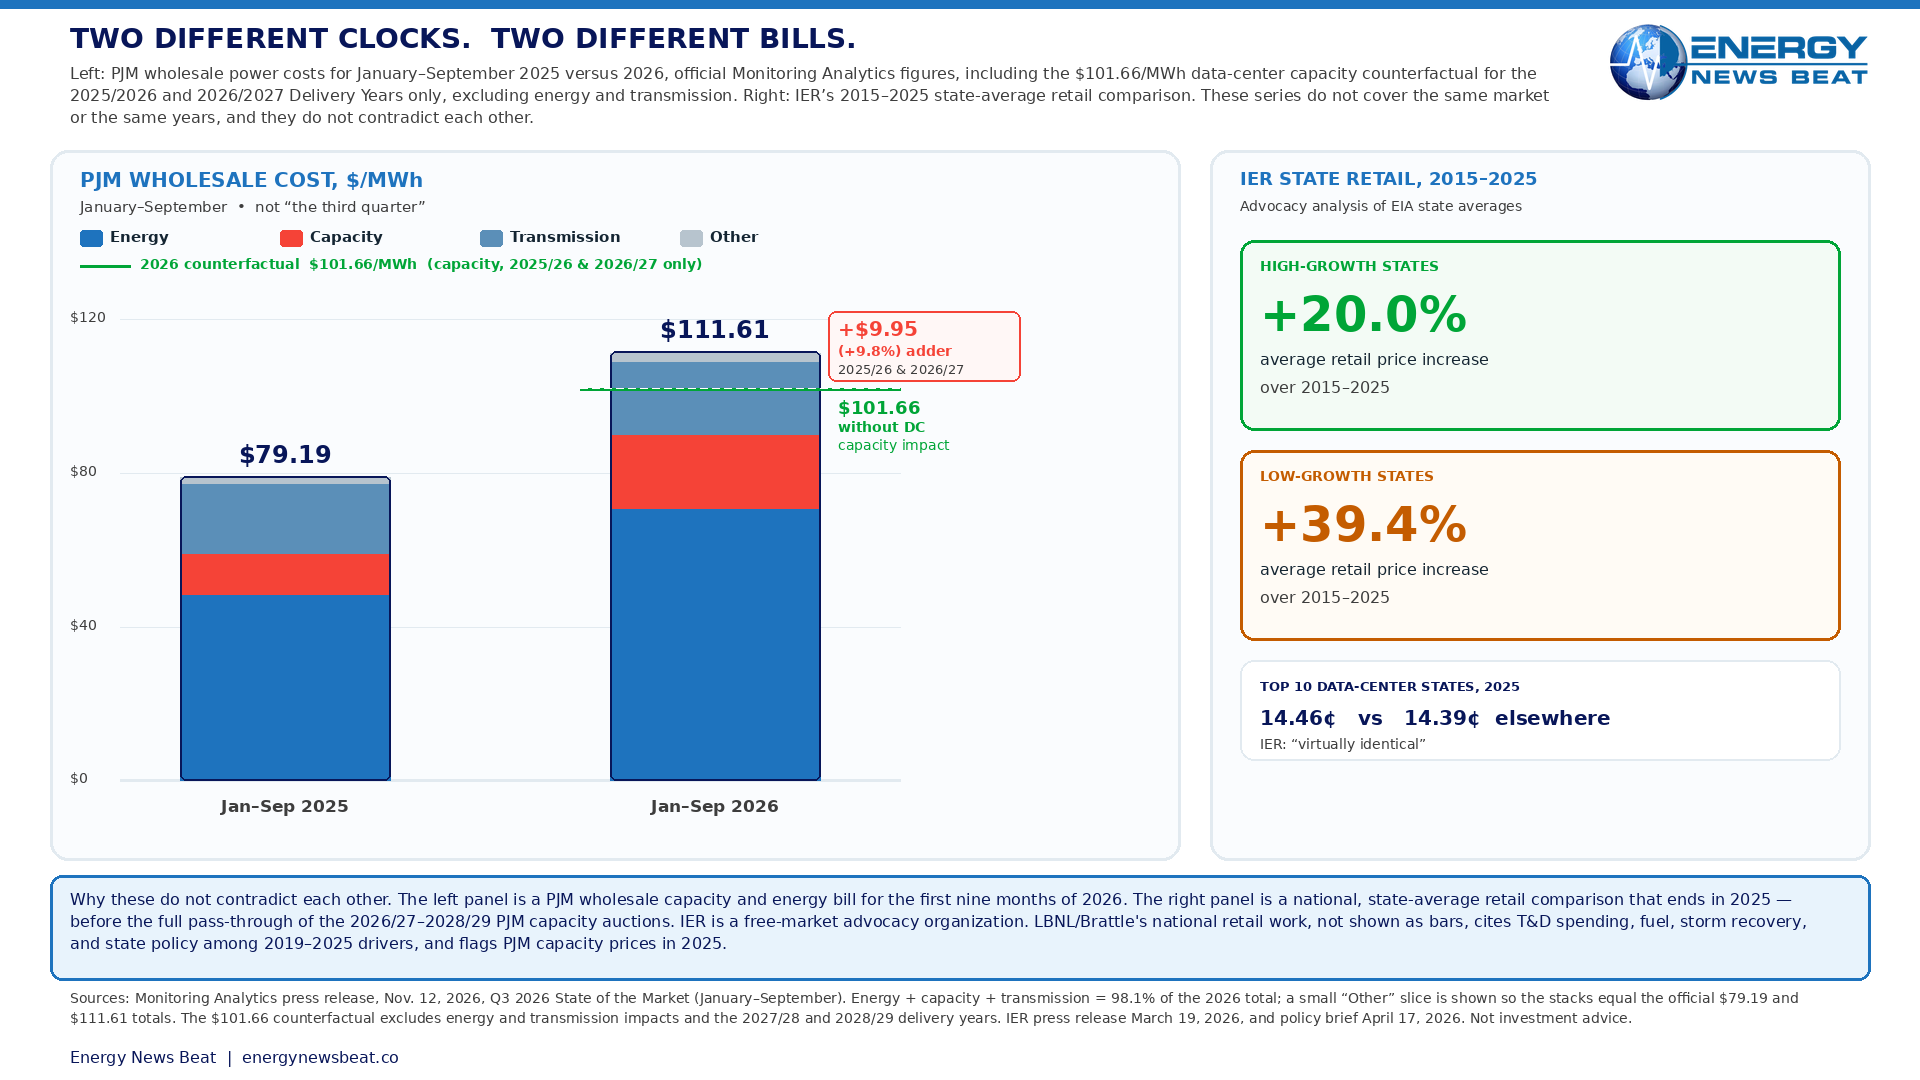
December is a forecast, and the shortfalls are already real
The next auction, for the 2029/2030 delivery year, is scheduled for December 9–15, 2026. The monitor warns that leaving forecast data-center load in that auction “effectively ensures that the auction will clear at the maximum price and add another $5 to $10 billion of data center related costs to all customers.” That is a forecast, contingent on the load remaining in and the auction clearing at the cap. FERC has not required a delay. PJM has not postponed the auction. The reliability gap is already on the books: 208.7 MW short in the 2026/2027 auction, 6,516.6 MW in 2027/2028, and 6,831.3 MW in the 2028/2029 auction, run in July. The monitor also says PJM missed its reliability target on June 1, 2025, and June 1, 2026, and that “there would have been no shortfall but for the forecast data center load.”
The monitor says PJM has “failed to implement the broad public policy mandate” in the governors’ and White House principles and the Ratepayer Protection Pledge, “to ensure that data centers pay their own costs.” It wants that load removed and replaced with bilateral “bring your own new generation,” or BYONG, contracts, or a reliability backstop. In official wording: “PJM should postpone the December auction until it can remove all forecast data center load from the auction, and run a reliability backstop auction for all data center load that wants to interconnect and does not have a bilateral contract for generation.” Spokesman Jeffrey Shields told the Pennsylvania Capital-Star that PJM fundamentally disagrees with the monitor’s view that it can take control of how data-center costs are shared; that, he said, is up to state utility regulators that approve local utilities’ rate structures. He said PJM’s FERC filings track the February 2026 principles.
What Bond argued — and what the studies behind him show
Bond’s Nov. 11 column is opinion, not a news report. He closes: “Yet Silicon Valley is not causing the energy crisis. If anything, it is helping solve the problem created by Washington’s red tape.” The Institute for Energy Research, a free-market advocacy organization, found no significant link between data-center concentration and faster 2015–2025 rate increases. High-growth states averaged a 20.0% price rise; low-growth states, 39.4%. The top 10 data-center states averaged 14.46¢/kWh in 2025, “virtually identical” to 14.39¢ elsewhere. IER used state-average EIA retail prices, which smear a PJM wholesale shock across a whole state, and the series ends in 2025, before the 2026/27–2028/29 auctions fully pass through. Bond cites a DOE-funded Lawrence Berkeley National Laboratory and Brattle update of 2019–2025 retail rates as finding grid infrastructure investment the primary driver, followed by gas prices, disaster recovery, and state energy and environmental policies. The LBNL deck lists T&D spending, fuel costs, storm recovery, wildfire mitigation, and state policies among the drivers, and finds rising PJM capacity prices were “a significant contributor” to 2025 retail increases in many mid-Atlantic states. That supports Bond on the national increase through 2025, not on PJM capacity in 2026–2029.
Bond points to blocked lines in New Hampshire and Maine, and writes that “from 2022 to 2026, PJM Interconnection was forced to freeze new grid applications in the eastern U.S.” That last line is Bond’s characterization. PJM did pause and overhaul its interconnection queue under a reform FERC accepted on Nov. 29, 2022 (Docket ER22-2110), which moved PJM to a first-ready, first-served cluster process, not a documented four-year freeze of all new applications on the evidence opened here. He cites Brent Nelson of Ascend Analytics, who said on Dec. 2, 2025 — not in reaction to this week’s report — that “even without data centers, load growth from other causes would still eventually cause the same capacity market cost increases.” Bond treats the White House Ratepayer Protection Pledge as evidence that hyperscalers are already bringing their own power. The White House page lists 300-plus organizations, 80% of U.S. power delivered, 23 governors, and seven hyperscalers in a voluntary pledge to “build, bring, or buy” needed power. The monitor says that pledge has not been implemented in the capacity market.
Where the two sides talk past each other — and where they do not
The clash is mostly geography and timing. The monitor measured PJM wholesale capacity from 2025/26 through a December 2029/30 risk; IER and LBNL measured national or state-average retail rates through 2025. Both can be true: data centers were not the main reason bills were already high far from PJM, and data-center load can still be the main reason PJM’s capacity auctions hit the cap. They also reinforce each other: rapid new load hit a grid already expensive to maintain and slow to interconnect. Bond concedes that data-center growth “has accelerated price increases” in PJM; the monitor supplies the number. Both sides say the new load should pay for the generation it requires. The live fight is whether that happens before December, or whether households in 13 states and D.C. are billed another $5–10 billion first.
Consumer and investor views
For households, wholesale is not the retail bill. Hedging, rate cases, and state allocation rules delay and redistribute costs, and capacity is only 17.4% of the nine-month wholesale average. The consumer test is whether forecast data-center load stays in December’s auction, and whether states assign the next increment to the loads that caused it. For investors, a postponed auction or a BYONG rule would change who pays and when supply gets built — not a reason to treat $29.4 billion as a single-year earnings number, or $5–10 billion as cash already spent. This is not investment advice.
Caveats and criticism
The $29.4 billion figure includes both actual and forecast data-center load. The monitor has repeatedly called those forecasts unverified or overstated, including load that may have been canceled or is unlikely to appear on time. The $9.95/MWh nine-month adder excludes energy and transmission, so it understates the total data-center imprint. IER is an advocacy organization, and its 2015–2025 state averages cannot rebut a 2026–2029 PJM capacity result. LBNL is a national retail study.
Stu’s Take
| The market monitor did not say data centers caused America’s energy crisis, and Drew Bond did not erase a $29.4 billion PJM capacity bill. Four already-run auctions locked that figure in. Another $5–10 billion could be added in December if forecast data-center load stays in the auction and it clears at the cap — a warning, not a result already in the bank. Bond is right that politicians have over-simplified a national rate shock into “blame AI,” and that years of grid costs, blocked lines, and a slow interconnection queue made supply tight before the hyperscale wave arrived. The monitor is right that, inside PJM, that load is what pushed capacity prices to the cap and left the region short of its reliability target. Both sides say the new load should bring its own generation. The consumer test is whether that rule is in force before December, or whether 67 million consumers are billed first. |
Appendix A | Linked source list (accessed Nov. 13, 2026 CST)
Selected excerpts in Appendix B are short evidence pointers, not full reproductions. An access gap is not proof a document does not exist. Official IMM figures were checked against the official PDFs of the Nov. 12, 2026, press release, the Members Committee letter, and the Oct. 30, 2026, 2028/2029 RPM BRA Part A, checked Nov. 13, 2026. The Washington Times access caveat is in Appendix D.
- Monitoring Analytics, official press release PDF, Nov. 12, 2026, 2026 Quarterly State of the Market Report for PJM: January through September, including the $111.61/$79.19 nine-month totals, the $101.66 and $9.95/MWh (9.8%) capacity counterfactual for the 2025/2026 and 2026/2027 Delivery Years only, excluding energy and transmission, the $29.4 billion irreversible figure, Bowring competitiveness quotes, and the separate $7.6 billion ARR/FTR under-return (official PDF, checked Nov. 13, 2026) — https://www.monitoringanalytics.com/reports/Market_Messages/Messages/2026q3-som-pjm-press-release.pdf
- Monitoring Analytics Members Committee letter, Joseph E. Bowring, Nov. 12, 2026 (official PDF, checked Nov. 13, 2026) — https://www.monitoringanalytics.com/reports/Market_Messages/Messages/2026q3-som-pjm-mc-letter.pdf
- Monitoring Analytics, Q3 2026 State of the Market, Section 1 Introduction, Nov. 12, 2026, including Table 1-9 dollar totals ($70.81 billion / $48.60 billion / +45.7%) and the December $5–10 billion forecast and postpone wording — https://www.monitoringanalytics.com/reports/PJM_State_of_the_Market/2026/2026q3-som-pjm-sec1.pdf
- Monitoring Analytics Q3 2026 State of the Market landing page, posted Nov. 12, 2026, January through September 2026 (opened Nov. 13, 2026) — https://www.monitoringanalytics.com/reports/PJM_State_of_the_Market/2026.shtml
- PR Newswire copy of the Nov. 12, 2026, 12:15 ET release, “MARKET MONITOR FINDS PJM WHOLESALE ELECTRICITY MARKETS COMPETITIVE” — https://www.prnewswire.com/news-releases/market-monitor-finds-pjm-wholesale-electricity-markets-competitive-302938048.html
- Monitoring Analytics, Analysis of the 2028/2029 RPM Base Residual Auction – Part A, Oct. 30, 2026, official Table 1 “All Data Center Load” column totaling $29,368,774,465, reliability shortfalls, and December 9–15, 2026, auction window (official PDF, checked Nov. 13, 2026) — https://www.monitoringanalytics.com/reports/Reports/2026/IMM_Analysis_of_the_20282029_RPM_Base_Residual_Auction_Part_A_20261030.pdf
- Monitoring Analytics, Analysis of the 2026/2027 RPM Base Residual Auction – Part A, Oct. 1, 2025 — https://www.monitoringanalytics.com/reports/Reports/2025/IMM_Analysis_of_the_20262027_RPM_Base_Residual_Auction_Part_A_20251001.pdf
- Monitoring Analytics, Analysis of the 2027/2028 RPM Base Residual Auction – Part A, Jan. 5, 2026 — https://www.monitoringanalytics.com/reports/Reports/2026/IMM_Analysis_of_the_20272028_RPM_Base_Residual_Auction_Part_A_20260105.pdf
- S&P Global Commodity Insights, Jared Anderson, Nov. 12, 2026, “PJM customer costs could increase by $10 billion after Dec. capacity auction” — cited for the same-day period error (“in the third quarter”), not as the official source of the $111.61 or $29.4 billion figures — https://www.spglobal.com/energy/en/news-research/latest-news/natural-gas/111226-pjm-customer-costs-could-increase-by-10-billion-after-dec-capacity-auction
- Pennsylvania Capital-Star, Peter Hall, Nov. 12, 2026, updated 6:30 p.m. with on-the-record comment from PJM spokesman Jeffrey Shields; also the about 67 million consumers figure — https://penncapital-star.com/energy-environment/electricity-grid-watchdog-warns-of-higher-prices-after-delayed-pjm-market-reforms/
- Drew Bond, The Washington Times, Nov. 11, 2026, “Politicians, not data centers, are causing an energy crisis.” Direct page access timed out / returned 403; author, date, thesis, and quoted lines recovered from search-indexed text of the canonical URL and checked against the underlying studies. No extra quotations were invented. — https://www.washingtontimes.com/news/2026/nov/11/politicians-not-data-centers-causing-energy-crisis/
- Institute for Energy Research press release, March 19, 2026, “The Numbers Don’t Lie: IER Analysis Shows Data Centers are Not Driving Up Electricity Prices,” including the 20.0% / 39.4% growth comparison, 14.46¢ vs. 14.39¢, and Tom Pyle quote — https://www.instituteforenergyresearch.org/the-grid/the-numbers-dont-lie-ier-analysis-shows-data-centers-are-not-driving-up-electricity-prices/
- Institute for Energy Research policy brief, April 17, 2026, “Have Data Centers Driven Up Electricity Prices?” IER is a free-market advocacy organization. The analysis uses state-average EIA retail prices through 2025. — https://www.instituteforenergyresearch.org/the-grid/policy-brief-have-data-centers-driven-up-electricity-prices/
- Lawrence Berkeley National Laboratory publication page, “Retail Electricity Price Trends and Drivers: Data Update—2026 Edition,” national retail decomposition, not a PJM capacity study — https://eta-publications.lbl.gov/publications/retail-electricity-price-trends-and
- Ascend Analytics / Latitude Media, Maeve Allsup, originally published Dec. 2, 2025, Brent Nelson quotes on capacity-market costs and load growth. This is a 2025 commentary, not a response to the Nov. 12, 2026, Q3 report. — https://www.ascendanalytics.com/blog/why-blocking-new-data-centers-may-not-fix-pjms-price-crisis
- White House Ratepayer Protection Pledge page: 300+ organizations, 80% of U.S. power delivered, 23 governors, 7 large hyperscalers; voluntary commitment to build, bring, or buy needed power, not a binding PJM tariff rule — https://www.whitehouse.gov/ratepayer-protection-pledge/
Appendix B | Key excerpts
Items below are short excerpts from official documents and contemporaneous reporting, or from recovered indexed text of the Bond column as disclosed in Appendix D, plus one labeled Capital-Star paraphrase that is not a direct quote. They are evidence pointers, not complete documents.
Bowring, energy vs. capacity competitiveness: “Our analysis concludes that the results of the PJM Energy Market were competitive in the first nine months of 2026. Our analysis concludes that the results of the capacity market auctions for the 2025/2026, 2026/2027, 2027/2028 and 2028/2029 Delivery Years were not competitive, primarily as a result of the inclusion of forecast demand for data centers.” (Monitoring Analytics press release, Nov. 12, 2026)
IMM, irreversible $29.4 billion: “The inclusion of existing and forecast data center demand in PJM’s Capacity Market has resulted in an irreversible increase of $29.4 billion in capacity market costs for all customers to date. That total impact will increase significantly when PJM runs its next capacity auction in December 2026.” (Monitoring Analytics press release, Nov. 12, 2026)
IMM, nine-month data-center capacity adder: “In the first nine months of 2026, the total cost of wholesale power would have been $101.66 per MWh if not for data center load and its impact on the cost of capacity for the 2025/2026 and 2026/2027 Delivery Years. In the first nine months of 2026, the total cost per MWh of wholesale power increased by $9.95 (9.8 percent) from $101.66 to $111.61 as a result of the inclusion of data center load in the PJM Capacity Market. This cost increase does not include the impact on energy or transmission costs.” (Monitoring Analytics press release, Nov. 12, 2026)
IMM, nine-month wholesale totals: “The total cost per MWh of wholesale power increased by $32.42 from $79.19 in the first nine months of 2025 to $111.61 in the first nine months of 2026, an increase of 40.9 percent.” (Monitoring Analytics press release, Nov. 12, 2026)
IMM, separate $7.6 billion congestion issue: “Customers have received $7.6 billion less in congestion revenues than customers should have received from the 2011/2012 planning period through the first four months of the 2026/2027 planning period as a result of flaws in the PJM ARR/FTR market design.” (Monitoring Analytics press release, Nov. 12, 2026)
Part A, official Table 1 total: “The total increase in costs to PJM customers as a result of data center load in the last four BRAs was $29,368,774,465.” (Monitoring Analytics, 2028/2029 RPM BRA Part A, Oct. 30, 2026)
Part A, Table 1 title: “Increase in capacity market revenues due to the inclusion of the data center load in the peak load forecast by delivery year” (Monitoring Analytics, 2028/2029 RPM BRA Part A, Oct. 30, 2026, Table 1)
Part A, no shortfall without forecast load: “There would have been no shortfall but for the forecast data center load.” (Monitoring Analytics, 2028/2029 RPM BRA Part A, Oct. 30, 2026)
Part A, 2026/2027 shortfall: “The capacity market cleared 208.7 MW (UCAP) short of PJM’s reliability requirement, or 0.2 percent less than the reliability requirement.” (Monitoring Analytics, 2028/2029 RPM BRA Part A, Oct. 30, 2026)
Part A, 2027/2028 and 2028/2029 shortfalls: “The 2027/2028 BRA in December 2025 cleared 6,516.6 MW (UCAP) short of PJM’s UCAP reliability requirement. The 2028/2029 BRA in July 2026 cleared 6,831.3 MW (UCAP) short of PJM’s UCAP reliability requirement.” (Monitoring Analytics, 2028/2029 RPM BRA Part A, Oct. 30, 2026, condensed from consecutive sentences)
Part A, December auction window: “The 2029/2030 BRA, now scheduled for December 9 to December 15, 2026” (Monitoring Analytics, 2028/2029 RPM BRA Part A, Oct. 30, 2026)
SOM Section 1, December $5 to $10 billion forecast: “PJM’s Reliability Backstop Procurement (RBP) filing, now delayed until after the December BRA, leaves most of the forecast data center load in the BRA capacity auction for 2029/2030 to be run in December 2026 and thereby effectively ensures that the auction will clear at the maximum price and add another $5 to $10 billion of data center related costs to all customers.” (Monitoring Analytics, Q3 2026 State of the Market, Section 1, Nov. 12, 2026)
IMM recommendation to postpone December auction: “PJM should postpone the December auction until it can remove all forecast data center load from the auction, and run a reliability backstop auction for all data center load that wants to interconnect and does not have a bilateral contract for generation.” (Monitoring Analytics, Q3 2026 State of the Market, Section 1, Nov. 12, 2026)
IMM, Pledge and governors’ principles not implemented: “PJM has failed to implement the broad public policy mandate reflected in the Principles agreed to by all the PJM governors and the White House, as well as the Ratepayer Protection Pledge, to ensure that data centers pay their own costs.” (Monitoring Analytics press release, Nov. 12, 2026)
Jeffrey Shields, PJM, on cost allocation (paraphrase, Capital-Star): PJM fundamentally disagrees with the monitor’s view that PJM can take control of how data center costs are shared. That’s up to state utility regulators which approve local utilities’ rate structures, he said. (Pennsylvania Capital-Star, Peter Hall, Nov. 12, 2026, updated 6:30 p.m., paraphrase — not a direct quote)
Jeffrey Shields, pathways for states: “PJM recognizes the impacts of rising wholesale costs on regular people and businesses, and we have established clear pathways in all of our proposals for states to allocate any and all of the cost impacts of data centers and other large load customers to those customers.” (Pennsylvania Capital-Star, Peter Hall, Nov. 12, 2026)
Drew Bond, thesis line (recovered indexed text): “Politicians, not data centers, are causing an energy crisis” (The Washington Times, Nov. 11, 2026, headline; live page not opened directly — see Appendix D)
Drew Bond, scapegoat line (recovered indexed text): “a convenient scapegoat for politicians who are eager to distract from the real cause of rising utility rates: government policy.” (The Washington Times, Nov. 11, 2026; recovered from search-indexed text)
Drew Bond, PJM concession (recovered indexed text): “although it is true that in the PJM market data center growth has accelerated price increases, that is not because data centers are inherently problematic. Any new power needs would have eventually caused issues.” (The Washington Times, Nov. 11, 2026; recovered from search-indexed text)
Drew Bond, closing line (recovered indexed text): “Yet Silicon Valley is not causing the energy crisis. If anything, it is helping solve the problem created by Washington’s red tape.” (The Washington Times, Nov. 11, 2026; recovered from search-indexed text)
Brent Nelson, Dec. 2, 2025, not a reaction to this week’s report: “Even without data centers, load growth from other causes would still eventually cause the same capacity market cost increases.” (Ascend Analytics / Latitude Media, Maeve Allsup, Dec. 2, 2025)
Brent Nelson, red-herring line, Dec. 2, 2025: “The IMM talking about capacity market costs as a data center problem appears to me to largely be a red herring.” (Ascend Analytics / Latitude Media, Maeve Allsup, Dec. 2, 2025)
Tom Pyle, IER: “While that may change in the future, the evidence does not support that claim today.” (Institute for Energy Research press release, March 19, 2026)
Appendix C | Key data table (as-of dates)
| Metric | Value | As-of / source |
| Period of the Q3 2026 SOM | January through September 2026 (first nine months), not the third quarter alone | Monitoring Analytics press release and report title, Nov. 12, 2026 |
| Total wholesale cost, Jan–Sep 2026 | $111.61/MWh; $70.81 billion | IMM press release ($/MWh); SOM Section 1, Table 1-9 ($ billions), Nov. 12, 2026 |
| Total wholesale cost, Jan–Sep 2025 | $79.19/MWh; $48.60 billion | IMM press release ($/MWh); SOM Section 1, Table 1-9 ($ billions), Nov. 12, 2026 |
| Change, 2025 to 2026 (nine months) | +$32.42/MWh (+40.9%); +45.7% in total dollars | IMM press release ($/MWh and +40.9%); SOM Section 1, Table 1-9 ($ billions and +45.7%), Nov. 12, 2026 |
| Energy, Jan–Sep 2026 vs. 2025 | $70.89/MWh vs. $48.47/MWh (+46.3%); 63.5% of 2026 total | IMM press release, Nov. 12, 2026 |
| Capacity, Jan–Sep 2026 vs. 2025 | $19.42/MWh vs. $10.72/MWh (+81.1%); 17.4% of 2026 total | IMM press release, Nov. 12, 2026 |
| Transmission, Jan–Sep 2026 vs. 2025 | $19.16/MWh vs. $18.32/MWh (+4.6%); 17.2% of 2026 total | IMM press release, Nov. 12, 2026 |
| Energy + capacity + transmission share | 98.1% of Jan–Sep 2026 wholesale cost | IMM press release, Nov. 12, 2026 |
| Nine-month counterfactual without data-center capacity impact | $101.66/MWh | IMM press release, Nov. 12, 2026 |
| Nine-month data-center capacity adder | +$9.95/MWh (+9.8%), from the 2025/2026 and 2026/2027 Delivery Years only; excludes energy and transmission | IMM press release, Nov. 12, 2026 |
| 2025/2026 All Data Center Load adder | $9,332,103,858 ($9.33 billion) | IMM 2028/2029 BRA Part A, Table 1, Oct. 30, 2026 |
| 2026/2027 All Data Center Load adder | $7,271,197,971 ($7.27 billion) | IMM 2028/2029 BRA Part A, Table 1, Oct. 30, 2026 |
| 2027/2028 All Data Center Load adder | $6,497,653,512 ($6.50 billion) | IMM 2028/2029 BRA Part A, Table 1, Oct. 30, 2026 |
| 2028/2029 All Data Center Load adder | $6,267,819,123 ($6.27 billion) | IMM 2028/2029 BRA Part A, Table 1, Oct. 30, 2026 |
| Four-auction official total | $29,368,774,465 (line items sum to $29,368,774,464); rounded by the IMM to $29.4 billion | IMM Part A Table 1 and Q3 2026 SOM, Nov. 12, 2026 |
| Printed “Above Embedded” Table 1 total | $21,258,681,955 printed; four line items actually sum to $26,991,147,292. Treated as a likely copy-forward typo. Not used. | IMM Part A Table 1, Oct. 30, 2026 |
| December 2029/2030 auction window | December 9–15, 2026 | IMM Part A, Oct. 30, 2026 |
| December $5–10 billion figure | Monitor’s forecast if forecast data-center load stays in and the auction clears at the cap; not an accomplished result | Q3 2026 SOM Section 1, Nov. 12, 2026 |
| Reliability shortfall, 2026/2027 BRA | 208.7 MW (UCAP) | IMM Part A, Oct. 30, 2026 |
| Reliability shortfall, 2027/2028 BRA | 6,516.6 MW (UCAP) | IMM Part A, Oct. 30, 2026 |
| Reliability shortfall, 2028/2029 BRA | 6,831.3 MW (UCAP) | IMM Part A, Oct. 30, 2026 |
| Additional reliability misses | June 1, 2025, and June 1, 2026, on an ICAP and UCAP basis after all auctions, replacement capacity, and deficiency MW | Q3 2026 SOM, Nov. 12, 2026 |
| Temporary auction cap and floor | Cap and floor, with the cap initially $325/MW-day, from the Shapiro-related settlement; FERC 191 ¶ 61,066 (April 21, 2025) and 195 ¶ 61,076 (April 28, 2026) | SOM Section 1 footnotes, Nov. 12, 2026 |
| Separate ARR/FTR under-return | $7.6 billion, 2011/2012 through the first four months of 2026/2027; not part of the $29.4 billion figure | IMM press release, Nov. 12, 2026 |
| Real-time load-weighted LMP, Jan–Sep | $50.51/MWh (2025) to $74.98/MWh (2026), +48.4% | IMM press release, Nov. 12, 2026 |
| Real-time hourly average load, Jan–Sep | 93,683 MWh to 96,845 MWh, +3.4% | IMM press release, Nov. 12, 2026 |
| IER, 2015–2025 high- vs. low-growth states | +20.0% vs. +39.4% average retail price increase | IER, March 19 / April 17, 2026 |
| IER, top 10 data-center states vs. others, 2025 | 14.46¢/kWh vs. 14.39¢/kWh | IER, March 19 / April 17, 2026 |
| Ratepayer Protection Pledge | 300+ organizations; 80% of U.S. power delivered; 23 governors; 7 hyperscalers; voluntary, not a PJM tariff rule | White House Pledge page |
| PJM footprint | 13 states plus D.C.; about 67 million consumers | Pennsylvania Capital-Star, Nov. 12, 2026 |
Appendix D | Background
Washington Times access. A direct request for the Nov. 11 Bond column timed out, and another request returned a Cloudflare 403. The author (Drew Bond), date (Wednesday, November 11, 2026), thesis, named studies, project examples, and quoted language used in this article were recovered from search-indexed text of that canonical URL and then checked against the underlying IER, LBNL, Ascend Analytics, and White House sources. No additional Washington Times quotations were invented. Quotations are limited to that indexed text.
S&P period error. S&P Global wrote on Nov. 12 that “in the third quarter” wholesale power would have been $101.66/MWh without data-center load and rose 9.8% to $111.61/MWh. That is wrong on the period. The official Q3 State of the Market report covers January through September 2026. This article uses the official nine-month figures and does not repeat S&P’s phrasing as fact.
What the $29.4 billion is — and is not. It is the IMM’s counterfactual of capacity-market revenues with data-center load in the forecast minus estimated revenues without that load, across four already-run Base Residual Auctions. It includes both actual historical and forecast data-center load. It is not a nine-month wholesale bill, not a household-bill total, and not comparable to the $70.81 billion January–September wholesale cost. The $9.95/MWh nine-month adder comes only from the 2025/2026 and 2026/2027 Delivery Years and excludes energy and transmission impacts.
Table 1 typo not used. The Oct. 30 Part A PDF prints an “Above Embedded” total of $21,258,681,955. That figure matches the three-year (2025/26–2027/28) subtotal from an earlier Part A and omits the 2028/29 line of $5,732,465,337. The four “Above Embedded” line items sum to $26,991,147,292. This article treats the printed $21.26 billion total as a likely copy-forward typo and does not use it. The $29,368,774,465 all-load total is the official figure (the four official line items sum to $29,368,774,464, one dollar off by rounding).
December forecast versus result. The $5–10 billion figure is the monitor’s forecast if forecast data-center load remains in the December 2026 auction for the 2029/2030 delivery year and the auction clears at the cap. FERC has not required a delay. PJM has not postponed the auction, which Part A dates as December 9–15, 2026. This article does not treat that range as an accomplished result.
Auction collar. Later-year impacts are compressed by a temporary cap and floor from a settlement involving Pennsylvania Gov. Josh Shapiro’s office, accepted by FERC, with the cap initially $325/MW-day. The IMM says the minimum price reduced the calculated data-center impact because, without that load, prices would have been lower than the floor.
Separate $7.6 billion congestion issue. The monitor’s $7.6 billion ARR/FTR under-return, covering 2011/2012 through the first four months of 2026/2027, is a congestion-rights design issue. It is not part of the $29.4 billion data-center capacity figure and is not blended with it.
BYONG and the Pledge. BYONG is the monitor’s term for “bring your own new generation.” The White House Ratepayer Protection Pledge is a voluntary public commitment, not a binding PJM tariff rule. Bond treats the Pledge as evidence the market is already solving the cost-shift. The monitor treats the same Pledge, and the February 2026 governors and White House principles, as a mandate PJM has failed to implement in the capacity market.
Bond’s queue wording. The recovered column says that from 2022 to 2026, “PJM Interconnection was forced to freeze new grid applications in the eastern U.S.” That wording is Bond’s characterization. PJM did pause and overhaul its interconnection queue under a reform FERC accepted on Nov. 29, 2022 (Docket ER22-2110), which moved PJM to a first-ready, first-served cluster process. This article does not upgrade that phrasing into a documented four-year freeze of all new applications.
Brent Nelson’s date. Brent Nelson’s comments were originally published Dec. 2, 2025, by Latitude Media and remain posted on Ascend Analytics’ site. They respond to an earlier IMM emergency complaint at FERC, not to the Nov. 12, 2026, Q3 State of the Market report.
Wholesale versus retail. PJM wholesale costs are not the same as a household bill. Hedging, rate cases, and state allocation rules delay and redistribute costs. Capacity was 17.4% of the January–September 2026 wholesale average; energy was 63.5%. PJM serves 13 states and Washington, D.C., about 67 million consumers per Capital-Star.
Appendix E | Methodology and limits
- Official IMM figures in the article body, Chart 1, Chart 2, and Appendix C were checked against the official PDFs of the Nov. 12, 2026, press release, the Nov. 12 Members Committee letter, and the Oct. 30, 2026, 2028/2029 RPM BRA Part A, including Table 1 and the shortfall passages, checked Nov. 13, 2026.
- The $5–10 billion December language and the wording that PJM should postpone the December auction are official State of the Market Section 1 (Introduction) language, Nov. 12, 2026, and are treated as the monitor’s forecast and recommendation, not as FERC or PJM decisions.
- The S&P Global Nov. 12 article is cited only to flag its incorrect “third quarter” period label. Wholesale $/MWh figures come from the official IMM press release; the $70.81 billion, $48.60 billion, and +45.7% dollar totals come from SOM Section 1, Table 1-9, not from S&P.
- Drew Bond’s Washington Times column could not be opened directly (timeout / HTTP 403). Quoted lines are limited to language recovered from search-indexed text of the canonical URL and then corroborated against IER, LBNL, Ascend, and White House pages. No additional Washington Times quotations were invented.
- IER is identified as a free-market advocacy organization. Its 2015–2025 findings use state-average EIA retail prices and end before the full retail pass-through of the 2026/27–2028/29 PJM capacity auctions.
- LBNL is cited as a national retail-rate decomposition, not as a PJM capacity-market study.
- Brent Nelson is dated to Dec. 2, 2025, and is not presented as a comment on this week’s Q3 report.
- The printed $21.26 billion “Above Embedded” Table 1 total is documented as a likely typo and is not used. The official $29,368,774,465 all-load total is used.