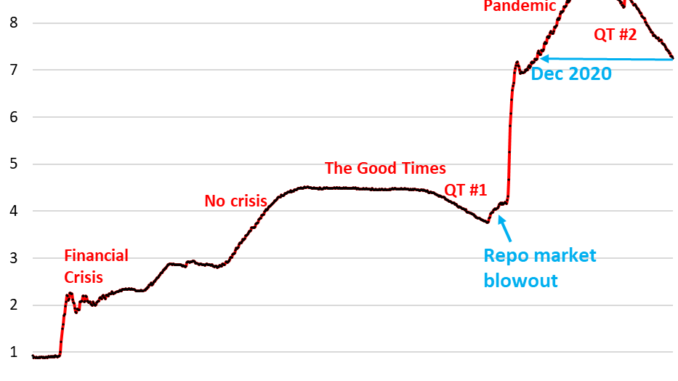
Quantitative Tightening has removed 40% of Treasury securities and 28% of MBS that pandemic QE added.
By Wolf Richter for WOLF STREET.
Total assets on the Fed’s balance sheet dropped by $107 billion in May, to $7.26 trillion, the lowest since December 2020, according to the Fed’s weekly balance sheet today. Since the end of QE in April 2022, the Fed has shed $1.71 trillion.
At its last FOMC meeting, the Fed outlined how it will slow QT in order to get the balance sheet down as far as possible without blowing anything up. The idea is to slowly approach the unknown level below which liquidity is too low, to avoid another debacle, such as the repo market blowout in September 2019 that caused the Fed to undo a big part of QT-1. That’s to be avoided this time.
May was the last month at the old pace of QT. Starting in June, the cap for the Treasury runoff will $25 billion, instead of $60 billion. But the cap for the MBS runoff has effectively been removed: whatever MBS come off, will just come off, and goodbye; any amount over $35 billion will be reinvested in Treasury securities, not in MBS, in line with the plan to get rid of MBS entirely over the “longer term.”
Why the Fed’s balance sheet rose even before 2008.
Sometimes folks say that the Fed should bring the balance sheet back down to $900 billion where it had been in 2008 before QE, and anything less is chickenshit.
But wait… currency in circulation. From the first day of its existence, the Fed’s assets have risen roughly in parallel with what was its largest liability: currency in circulation (paper dollars, AKA “Federal Reserve Notes”). The amount of currency in circulation is entirely demand based: When you try to withdraw $100 from the ATM, you expect the ATM to have the $100. Currency in circulation has quadrupled from $600 billion in 2003 to $2.35 trillion today. And assets must rise with that liability.
Between 2003 and August 2008 (just before QE started), the Fed’s total assets rose by 26%, from $720 billion at the beginning of 2003, to $910 billion in August 2008 (total assets in red, currency in circulation in blue).
Total assets are so jagged because the Fed used overnight repos on a daily basis to provide liquidity to, or drain liquidity from the banking system via its Standing Repo Facility. Those repos were on top of a more or less steadily growing base of Treasury securities. The red line also includes the Fed’s other assets such as gold and the Special Drawing Rights (SDRs).
In addition: During the Financial Crisis, the government moved its checking accounts from private banks (JPMorgan primarily) to the Federal Reserve Bank of New York, out of fear that the banking system would collapse and wipe out its checking account or whatever. This Treasury General Account (TGA) has a balance of $703 billion currently, which is a liability for the Fed (money that the Fed owes the government). So this was added to the balance sheet in 2009. With the $2.35 trillion in currency in circulation, that’s already over $3 trillion.
In addition, the Fed has other liabilities — primarily reserves and ON RRPs — which are now shrinking under QT (all in our most recent update of the Fed’s balance sheet liabilities).
QT by category.
Treasury securities: -$57 billion in May, -$1.31 trillion from peak in June 2022, to $4.46 trillion, the lowest since September 2020.
The Fed has now shed 40% of the $3.27 trillion in Treasury securities that it had added during pandemic QE.
Treasury notes (2- to 10-year) and Treasury bonds (20- & 30-year) “roll off” the balance sheet mid-month and at the end of the month when they mature and the Fed gets paid face value. The roll-off was capped at $60 billion per month through May, and about that much has been rolling off, minus the inflation protection the Fed earns on Treasury Inflation Protected Securities (TIPS) which is added to the principal of the TIPS.
Starting in June, the roll-off will be capped at $25 billion, minus inflation protection from the TIPS.
Mortgage-Backed Securities (MBS): -$17 billion in May, -$386 billion from the peak, to $2.35 trillion, the lowest since July 2021. The Fed has shed 28% of the MBS it had added during pandemic QE.
MBS come off the balance sheet primarily via pass-through principal payments that holders receive when mortgages are paid off (mortgaged homes are sold, mortgages are refinanced) and when mortgage payments are made. But sales of existing homes have plunged, and mortgage refinancing has collapsed, and so fewer mortgages got paid off, and passthrough principal payments to MBS holders, such as the Fed, have been reduced to a trickle. So the MBS have come off the balance sheet at a pace that’s far below the $35-billion cap.
Under the new version of QT, the cap for MBS has effectively been removed. If over $35 billion in MBS come off, they’ll just come off, and goodbye, but the amount over $35 billion will be replaced by Treasury securities.
Bank liquidity facilities.
Discount Window: -$600 million in May, to $6.2 billion. During the bank panic in March 2023, loans had spiked to $153 billion.
The Discount Window is the Fed’s classic liquidity supply to banks. The Fed currently charges banks 5.5% in interest on these loans – one of its five policy rates – and demands collateral at market value, which is expensive money for banks, and there’s a stigma attached to borrowing at the Discount Window, and so banks don’t use this facility unless they need to, though the Fed has been exhorting them to make more regular use of this facility.
Bank Term Funding Program (BTFP): -$16.2 billion in May, to $108 billion.
Cobbled together over a panicky weekend in March 2023 after SVB had failed, the BTFP had a fatal flaw: Its rate was based on a market rate. When Rate-Cut Mania kicked off in November 2023, market rates plunged even as the Fed held its policy rates steady, including the 5.4% it pays banks on reserves. Some smaller banks then used the BTFP for arbitrage profits, borrowing at the BTFP at a lower market rate and then leaving the cash in their reserve account at the Fed to earn 5.4%. This arbitrage caused the BTFP balances to spike to $168 billion. The Fed shut down the arbitrage in January by changing the rate. It also let the BTFP expire on March 11, 2024. Loans that were taken out before that date can still be carried for a year from when they were taken out. By March 11, 2025, the BTFP will be zero.
So over the next 10 months, the BTFP, on its way to zero, will remove another $108 billion, or about $11 billion per month on average, from the balance sheet, on top of regular QT.
All other bank-panic facilities from March 2023 have already been zeroed out.
Why assets dropped by $108 billion in May, though QT was capped at $95 billion:
Here are the biggies, accounting for $105 billion of the $108 billion decline in May:
Treasury securities: -$57 billion
MBS: -$17 billion
BTFP: -$16 billion
Unamortized Premiums and Discounts: -$4 billion
Other assets (accrued interest, etc.): -$10 billion
Discount Window plus remnants of 2020-era SPVs: -$1 billion.


