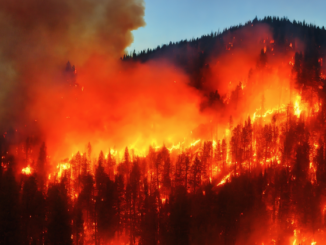


A new study claims that wildfires have become more frequent and destructive thanks to climate change. Empirical data say otherwise.
This week a new study was published in the Nature journal Ecology and Evolution titled “Increasing frequency and intensity of the most extreme wildfires on Earth.” The study claims that wildfires are on the increase due to climate change. [emphasis, links added]
Predictably, the mainstream media jumped all over this with headlines similar to what you see from CBS News.
However, the paper is untrue as it is self-falsifying because it doesn’t even use the minimum 30-year period required for a climatic data comparison.
Further, the claims are not supported by science in other sources of data and other publications.
First, the study itself says it only uses 21 years’ worth of satellite data, saying:
Climate change is exacerbating wildfire conditions, but evidence is lacking for global trends in extreme fire activity itself. Here we identify energetically extreme wildfire events by calculating daily clusters of summed fire radiative power using 21 years of satellite data…
A minimum of 30 years of data is needed before it can be called a climate comparison. This has been defined for decades.
The World Meteorological Organization (WMO) defines climate as “…the average weather conditions for a particular location and over a long period of time.”
To create a climate record, 30 years of weather data is averaged to create a “normal” climate expectation for a location or region.
Second, we can turn to the Intergovernmental Panel on Climate Change (IPCC), which has examined the issue of fire weather as it pertains to increasing wildfire risk.
They conclude that has not even emerged as a signal from climate change and it’s not likely to emerge in the 21st century.
The IPCC also identifies when it expects that the “emergence” of a signal of climate change will be detectable for various “climate impact drivers.”
Note the table below, with “fire weather” highlighted in yellow. Most people will likely be surprised by the amount of white cells in the table — indicating a lack of signal emergence, even out to 2100. For “fire weather”, a signal does not emerge through 2100. It isn’t even seen in the present.
Table 12.12 | on Page 90 – Chapter 12 of the UN IPCC Sixth Assessment Report. The emergence of Climate Impact Drivers (CIDs) in time periods, as assessed in this section. The color corresponds to the confidence of the region with the highest confidence: white colors indicate where evidence of a climate change signal is lacking or the signal is not present, leading to overall low confidence of an emerging signal.
Clearly, the IPCC does not see any connection whatsoever between climate and wildfires, nor does it expect a connection in the coming decades.
Next, we can examine other satellite data, such as the chart below that combines recent satellite data with historical data.
Figure 1. Historical and Satellite data on wildfire acreage burned. Blue curve, global wildfire area burned reconstruction. Orange curve, global wildfire area burned measured by satellites. Graph plotted by Bjorn Lomborg, Ph.D.
Clearly, the trend is sharply down for the area burned. However, the study cited by CBS News and others also claims that the intensity of fires is increasing. There is a simple explanation for this: increased fuel load makes bigger fires.
Increasing forest biomass, also known as “fuel load,” has been prevalent due to forest management issues. Fuel loads also figure greatly in wildfire potential, intensity, and spread.
For example, in the Western United States in 1990, the spotted owl was listed as endangered. As a result, the western logging industry and the associated forest management practices essentially evaporated.
As seen in Figure 2 below, data suggests the protected owl habitat has directly caused an increase in forest fuel load (and increased acreage burned) in the absence of effective forest management post-1990.
Fire science tells us increasing fuel load directly correlates with greater fire intensity and rate of spread, plus increasing the acreage burned.
Fuel loads can increase fire intensity, as more fuel available to burn means more energy is released as heat.
A 2013 study in the International Journal of Wildland Fire found that fire intensity increased with fuel loading. In Figure 2 below, fire-burned areas increased due to the protectionism of the spotted owl and other forest species in the Western United States.
Figure 2. Graph combining data for Federal lands showing acres harvested vs. acres burned, in millions of acres. Data from the U.S. Forest Service and the National Interagency Fire Center. Graph by Anthony Watts.
Unsurprisingly, the study lists the Western United States as the worst area for “most extreme wildfires” in Figure 3, seen below circled in red:
Figure 3. Distribution and trends of the most extreme wildfires on Earth.
So, while their data does support that some of the most extreme wildfires have occurred in the Western United States during the last 21 years, [it] is a clear case of correlation, not causation.
Attempting to blame climate change simply because fire intensity has increased instead of the problem with fuel loads getting bigger in that area is the fatal mistake the researchers made in addition to the 21 years of data falling short of the 30 years needed to make a climate comparison.
Of course, the mainstream media does not have reporters with the science education needed to even question this. But, as illustrated in this article, you don’t have to be a forest scientist to find this contrary data.
It simply appears that the mainstream media didn’t bother to look because they prefer to push a scary narrative about climate change rather than do the job they have been charged with.
So much for “journalistic integrity.”
Read more at Climate Realism
Take the Survey at https://survey.energynewsbeat.com/
Crude Oil, LNG, Jet Fuel price quote
ENB Top News
ENB
Energy Dashboard
ENB Podcast
ENB Substack