


Adios, “spring selling season.”
By Wolf Richter for WOLF STREET.
Pending home sales, a forward-looking indicator of “closed sales” of existing homes, plunged by 6.3% in April from March, seasonally adjusted, according to data from the National Association of Realtors today, driven by even bigger plunges in the South and the West, with the West carving out new lows in the data, just as inventories for sale are piling up.
Compared to the Aprils in prior years (historic data via YCharts):
- 2024: -2.5%
- 2023: -8.7%
- 2022: -28.0%%
- 2021: -34.8%
- 2020: -0.1% (lockdown April)
- 2019: -31.6%.
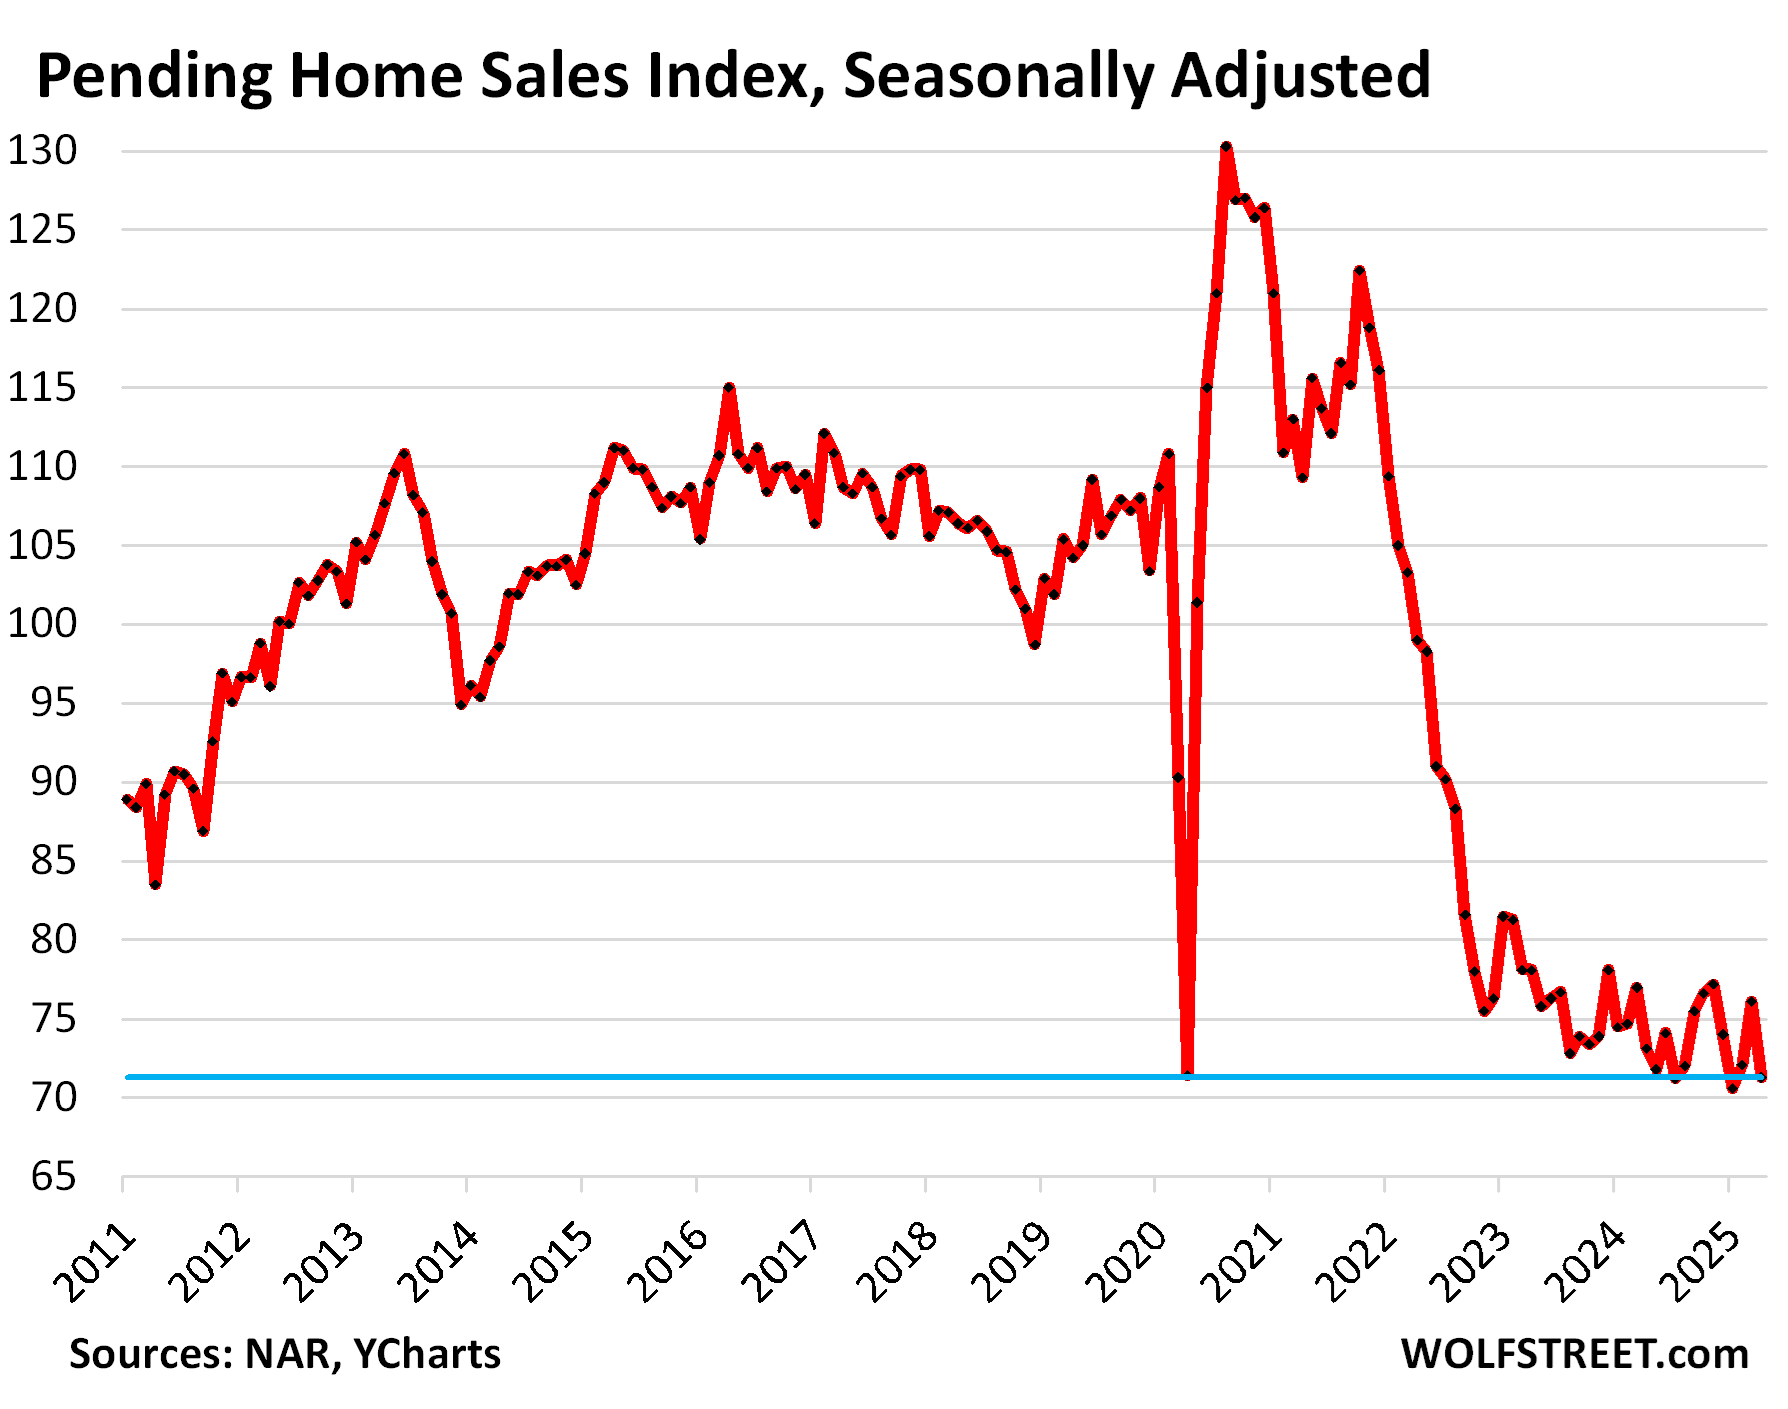
Pending sales reflect contract signings and track deals that haven’t closed yet and could still fall apart or get canceled, for all kinds of reasons, such as buyers being unable to afford or even get homeowner’s insurance, or financing falling through. While signed contracts that later fall apart are included in pending sales here, they’re not included in the data of closed sales reported later.
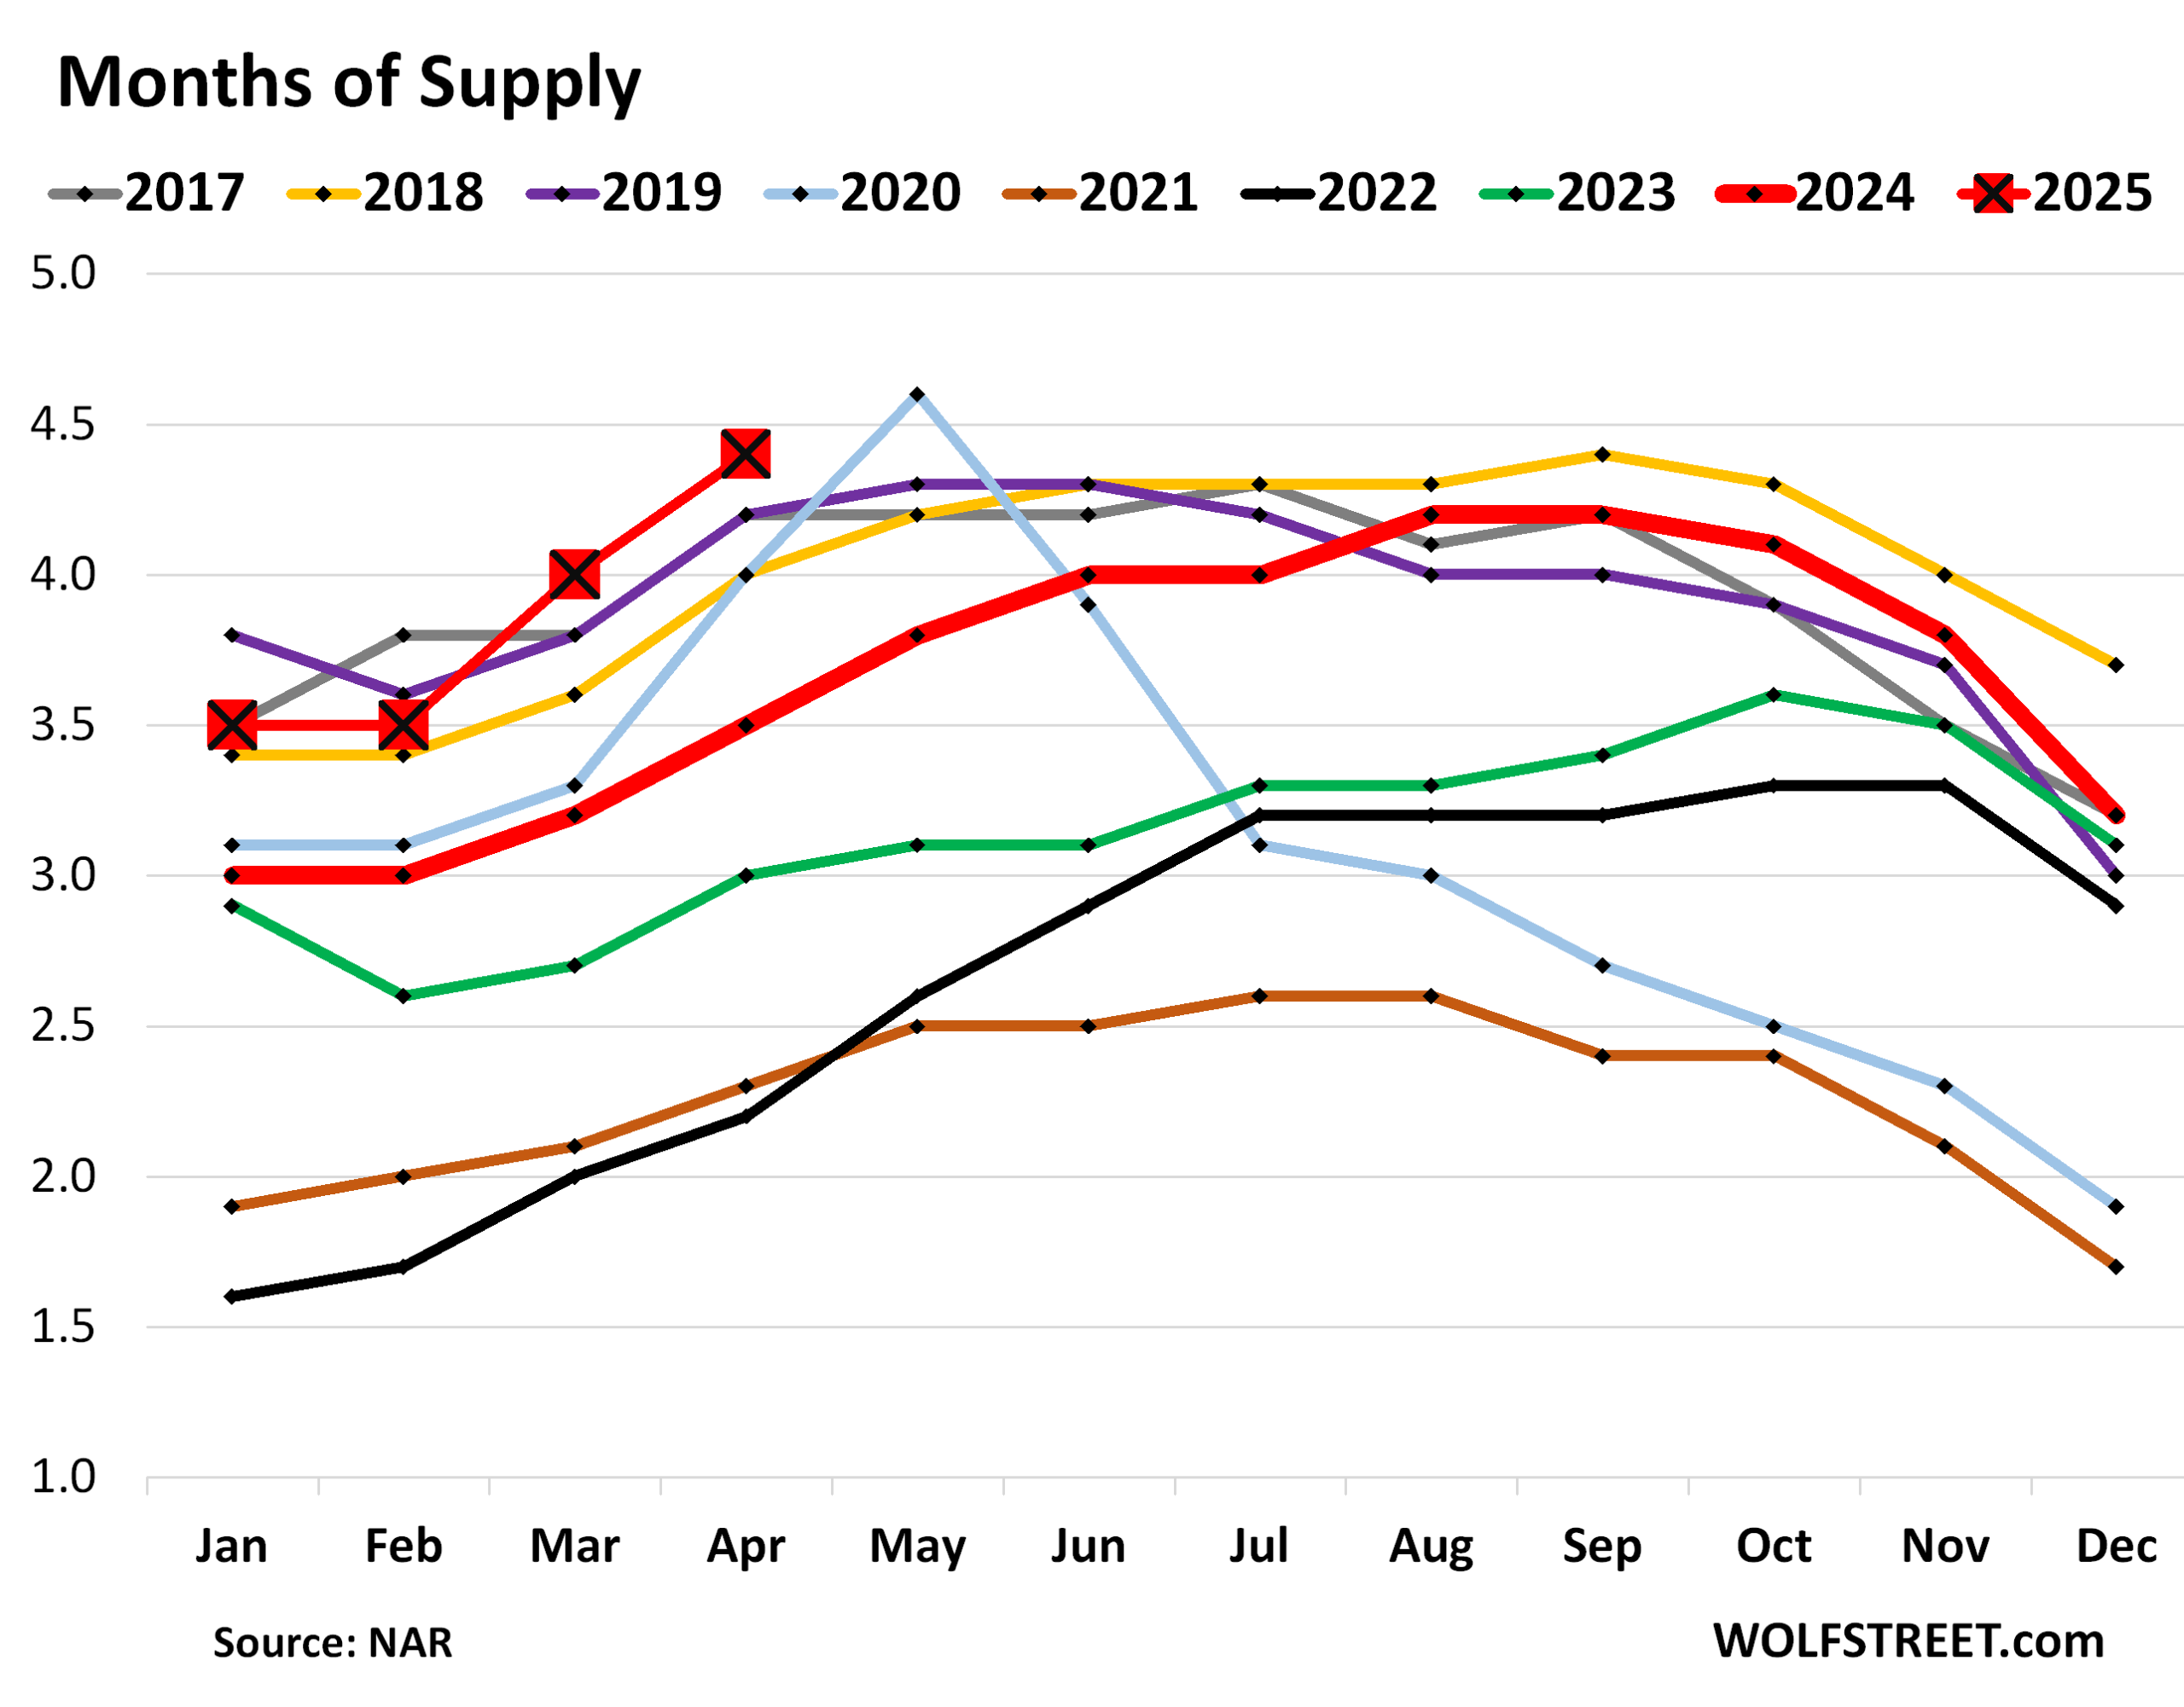
“Moreover, with housing inventory levels reaching five-year highs, home buyers in nearly every region of the country are in a better position to negotiate more favorable terms,” the report said.
Indeed. Home prices spiked by 50%-plus in just a couple of years during the pandemic, and these artificially inflated sky-high prices have triggered demand destruction on a massive scale, that’s what we’re seeing here – one of the most fundamental economic principles. When retailers or airlines are hit with demand destruction, now measured in real time online, they respond instantly by lowering prices, and demand comes back up. The housing market is still struggling to figure out that lower prices, after the artificially fueled spike, would revive demand.
Supply of homes for sale across the US has surged to 4.4 months in April, the highest for any April since 2016:
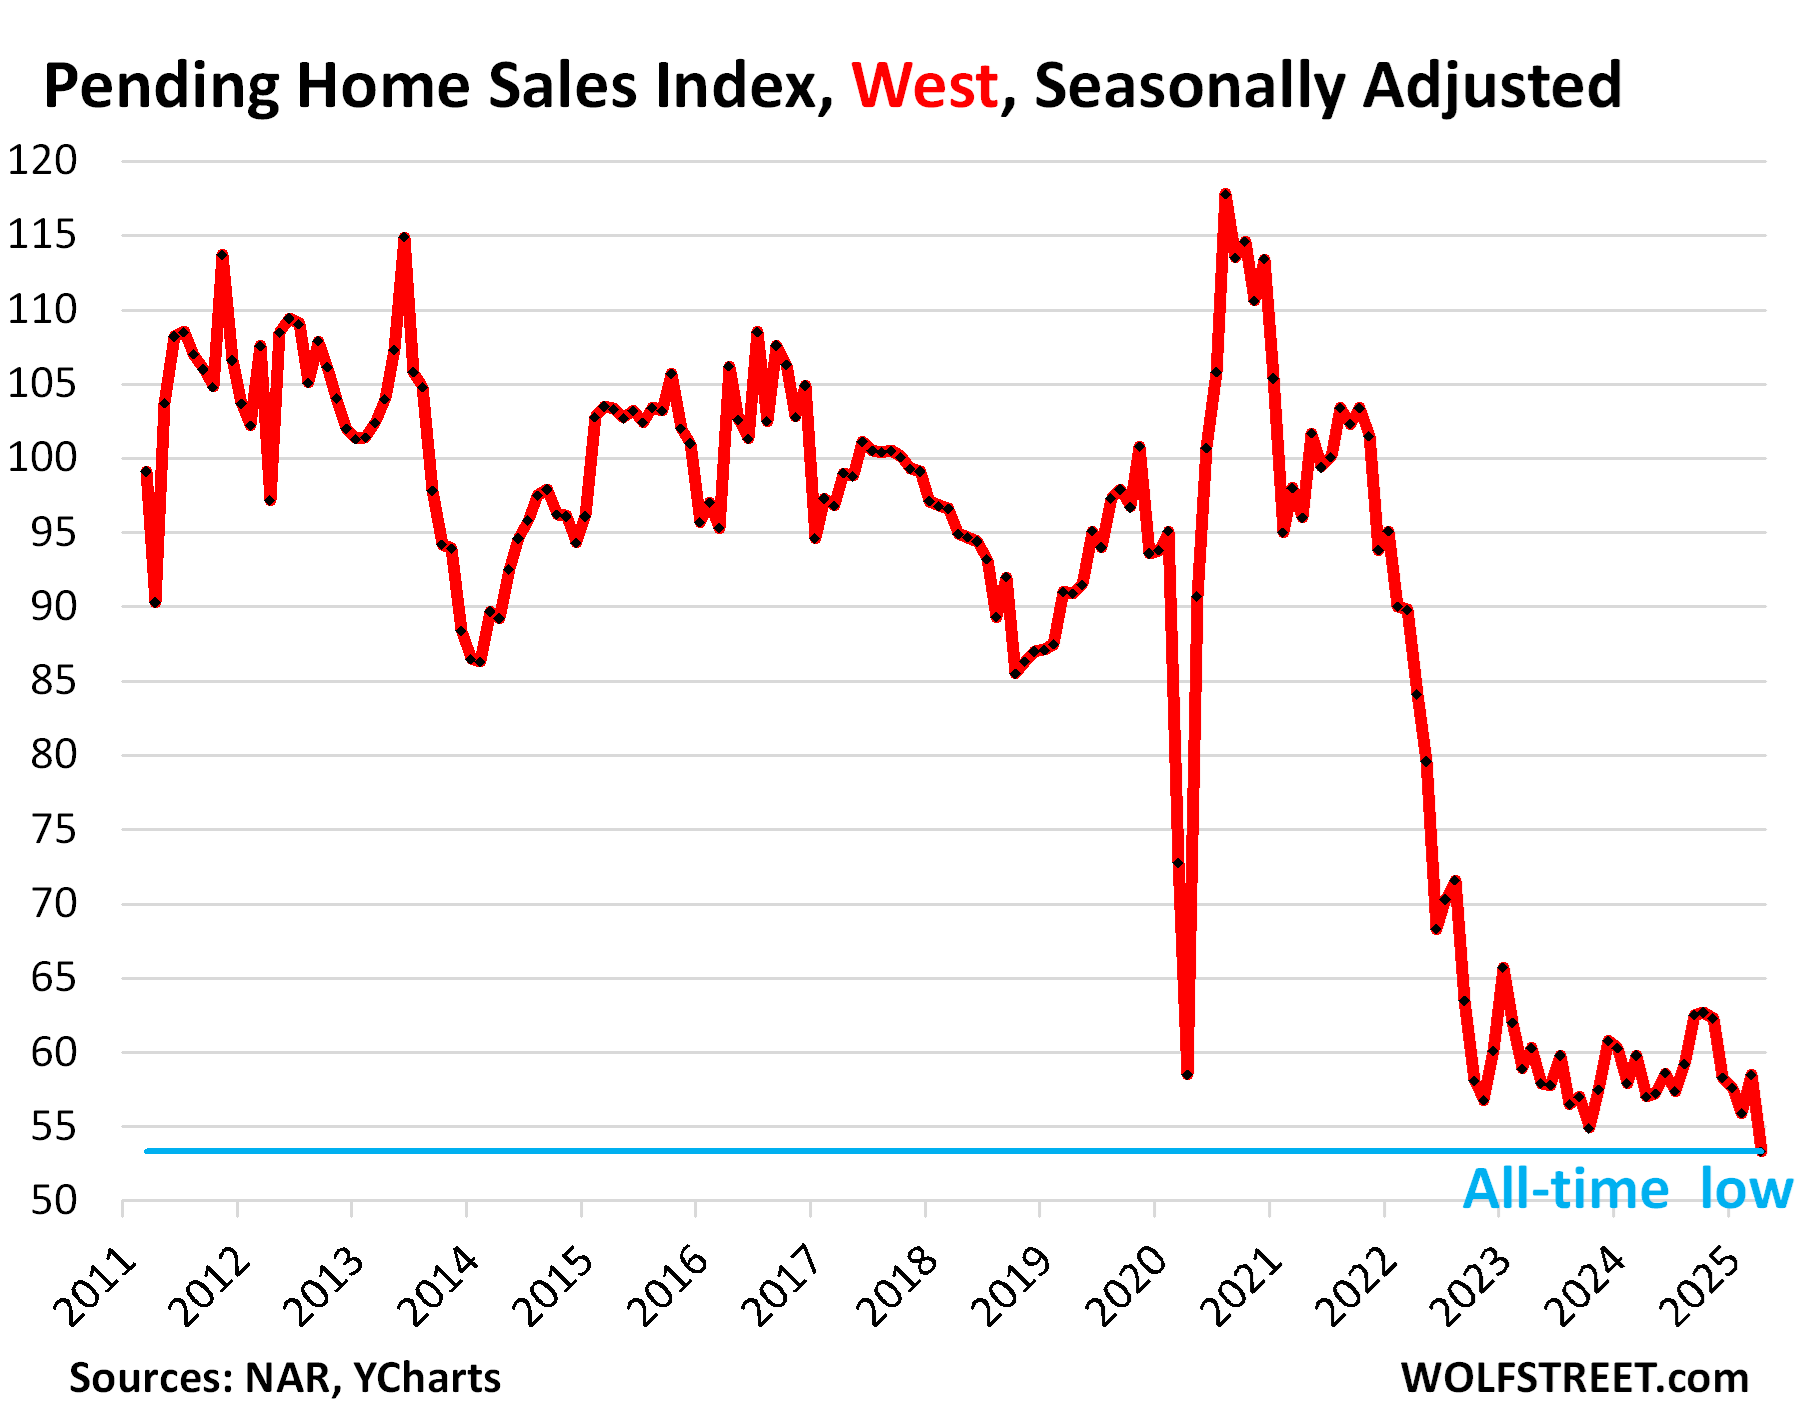
In the West: collapsed sales, ballooning inventories.
Pending sales of existing homes in the West (see map of the four Census Regions in the comments below) plunged by 8.9% in April from March, seasonally adjusted, to the lowest rate in the data going back to 2011.
Pending sales in April compared to Aprils in prior years:
- 2024: -6.5%
- 2023: -11.6%
- 2022: -36.6%
- 2021: -44.5%
- 2020: -8.9% (lockdown April)
- 2019: -41.4%.
Inventory of existing homes in the West are dominated by the huge market of California. Active listings of existing homes in California spiked by 51% year-over-year in April, to 64,963 homes (red squares in the chart below), the highest for any April in the data from realtor.com going back to 2016, except for 2019 (dotted purple line):
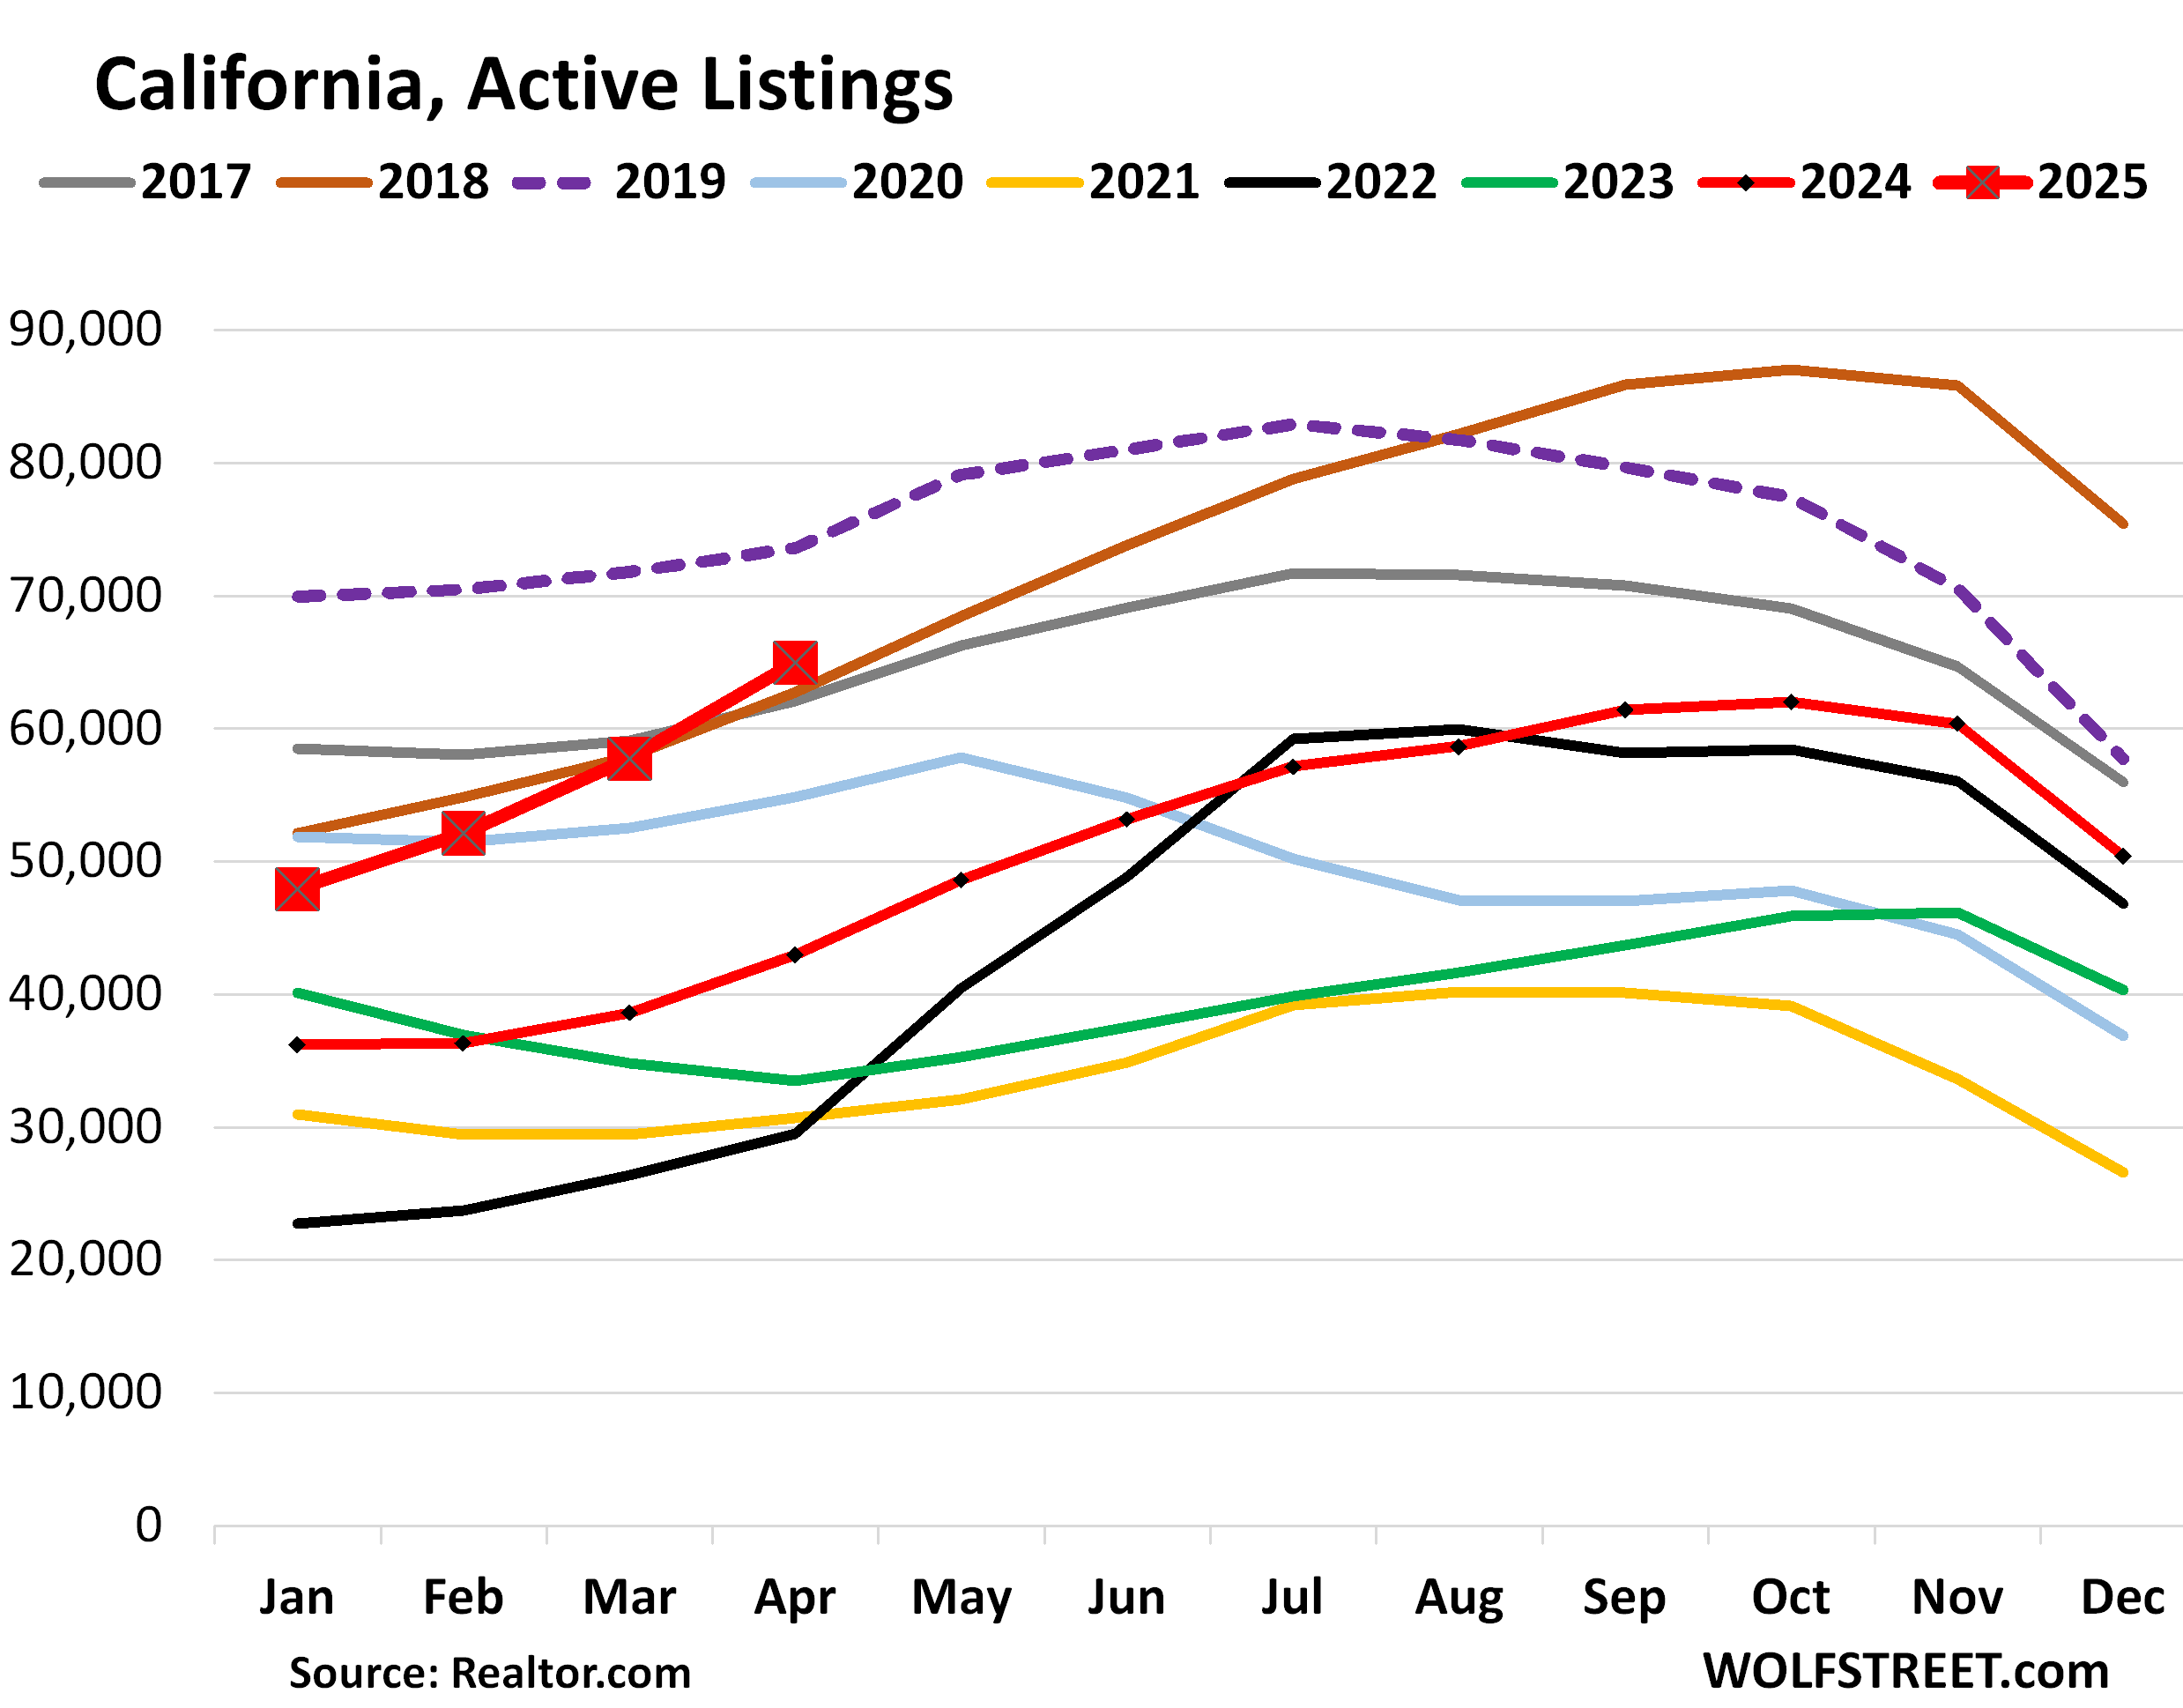
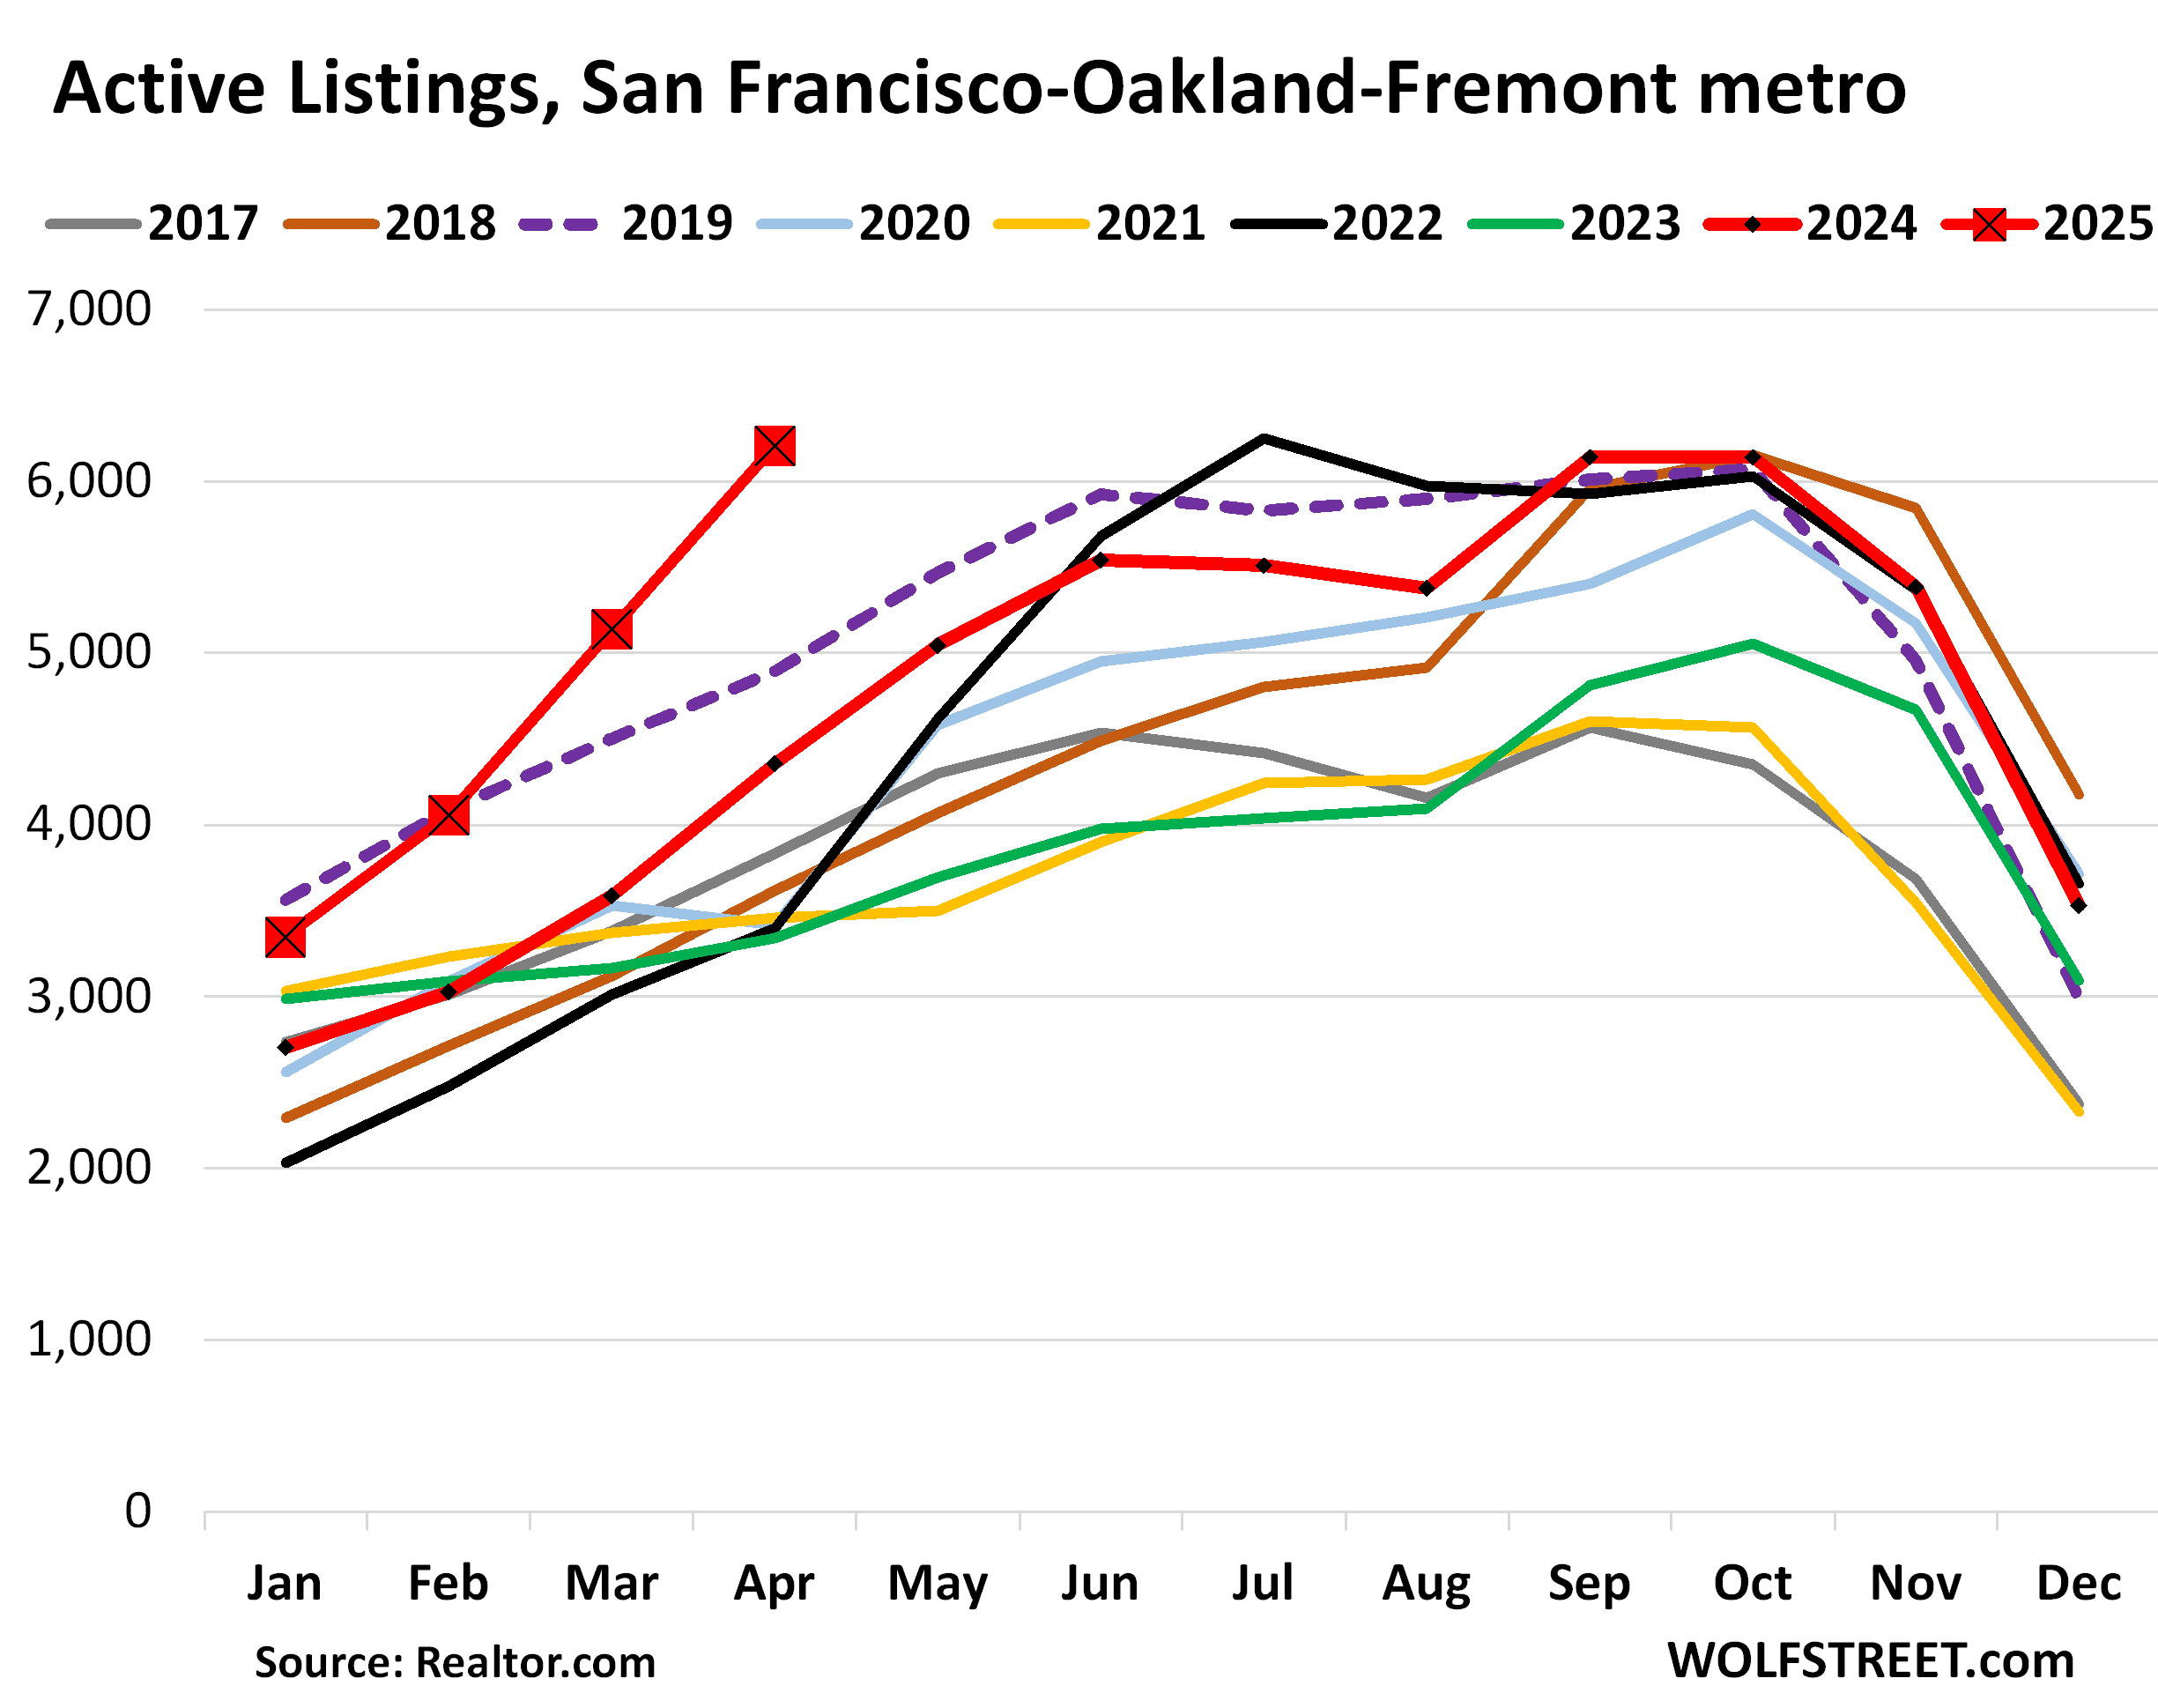
Ballooning inventory for sale is a good thing for the overpriced US housing markets. It’s what these markets need the most. So inventory is piling up in all major markets in California, such as by +70% year-over-year in San Diego County, +68% in the San Jose-Sunnyvale-Santa Clara metro, +50% in Los Angeles County, +43% in the Fresno metro (Central Valley), +75% in Orange County, or +43% in the San Francisco-Oakland-Fremont metro, where the inventory pile-up is a little more advanced than in some of the other California markets (we discussed major California markets here):
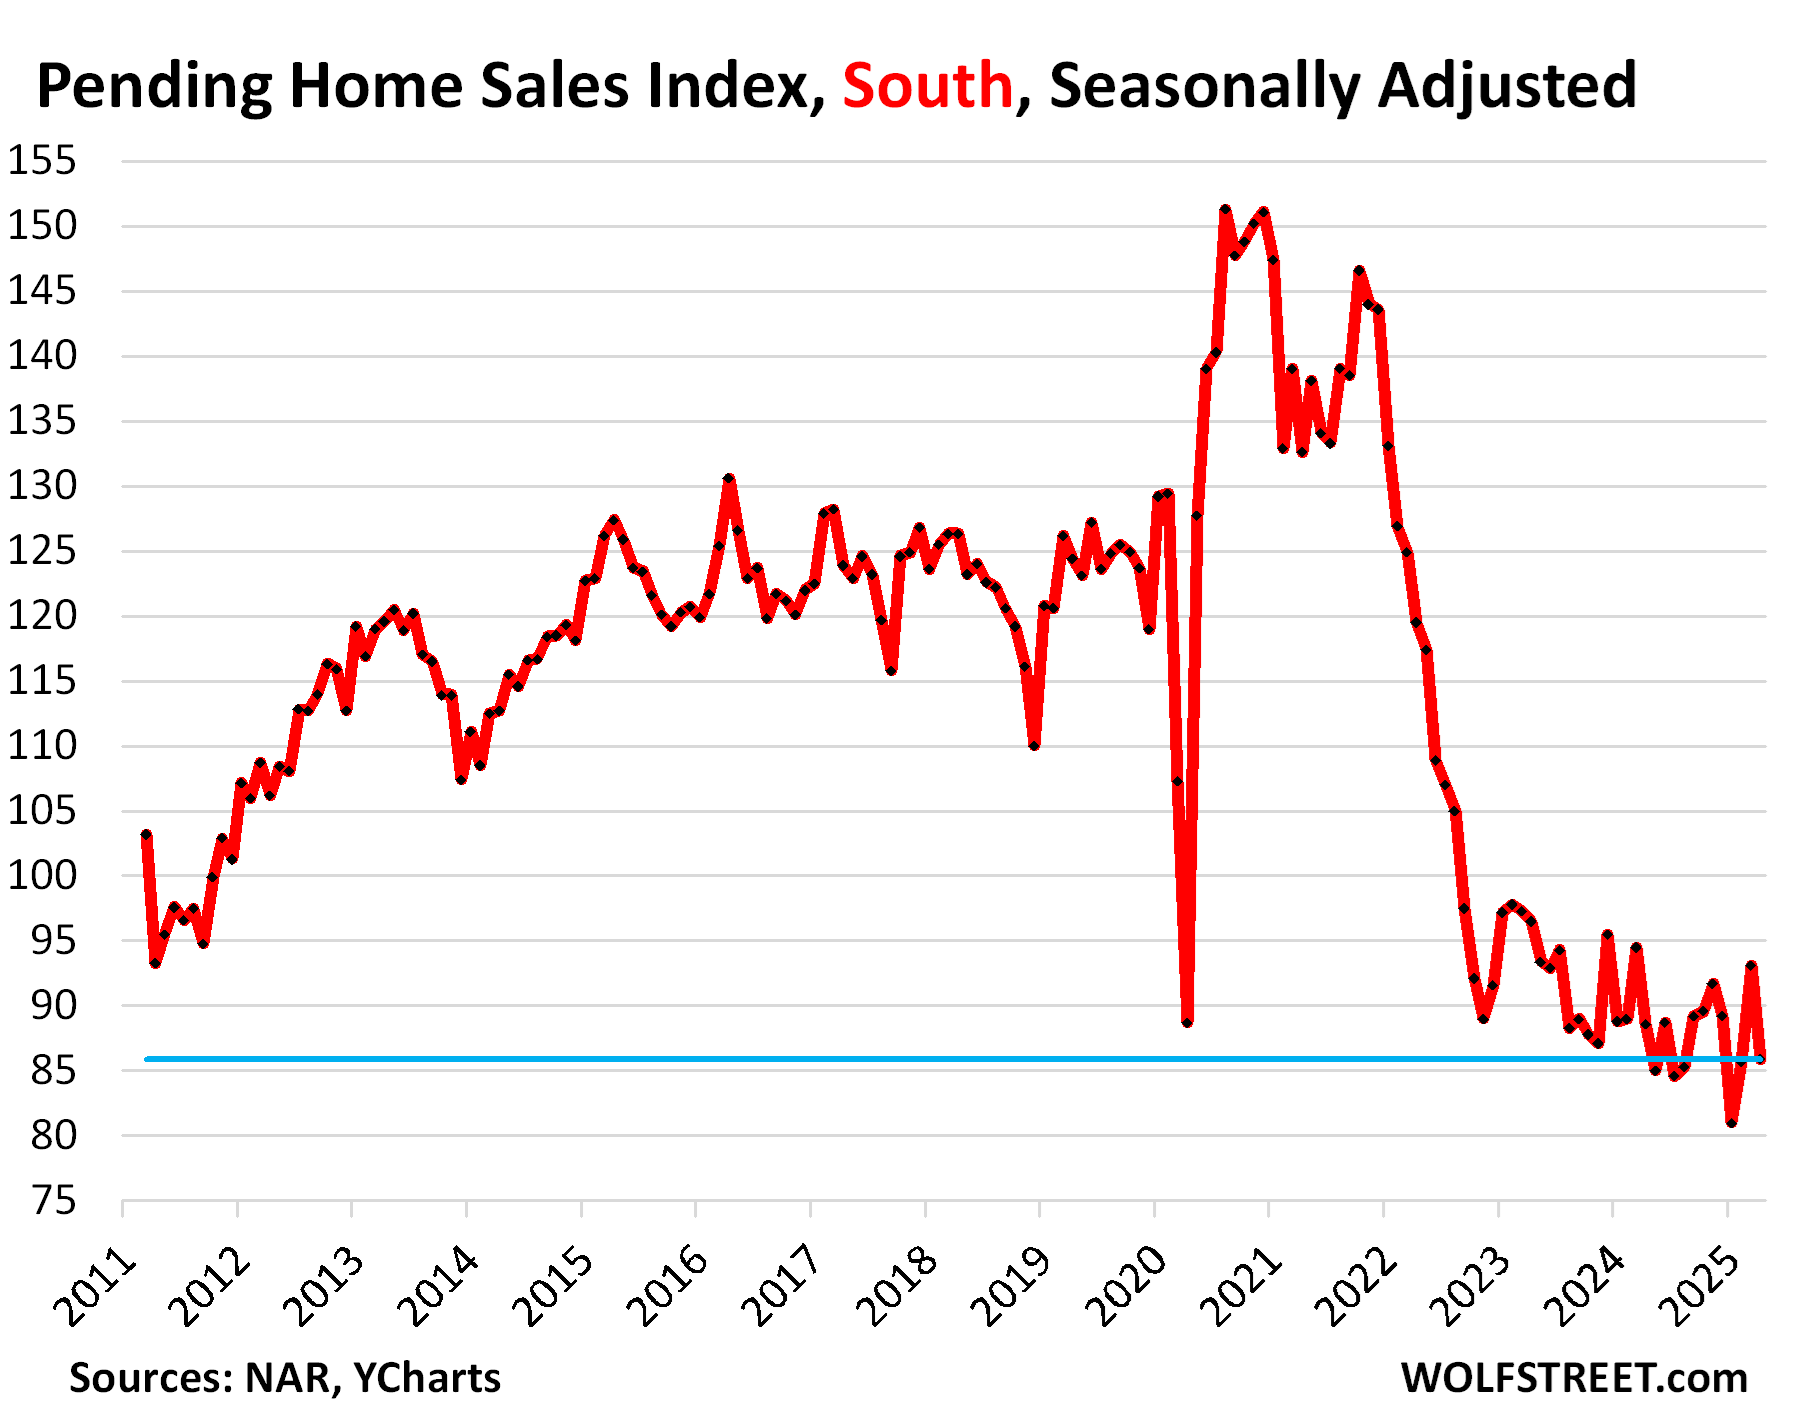
In the South: collapsed sales, ballooning inventories.
Pending sales plunged by 7.7% in April from March, seasonally adjusted, below lockdown April, and the worst April in the data.
Pending sales in April compared to Aprils in prior years (historic data via YCharts):
- 2024: -3.0%
- 2023: -11.0%
- 2022: -28.1%
- 2021: -35.2%
- 2020: -3.2% (lockdown April)
- 2019: -30.9%.
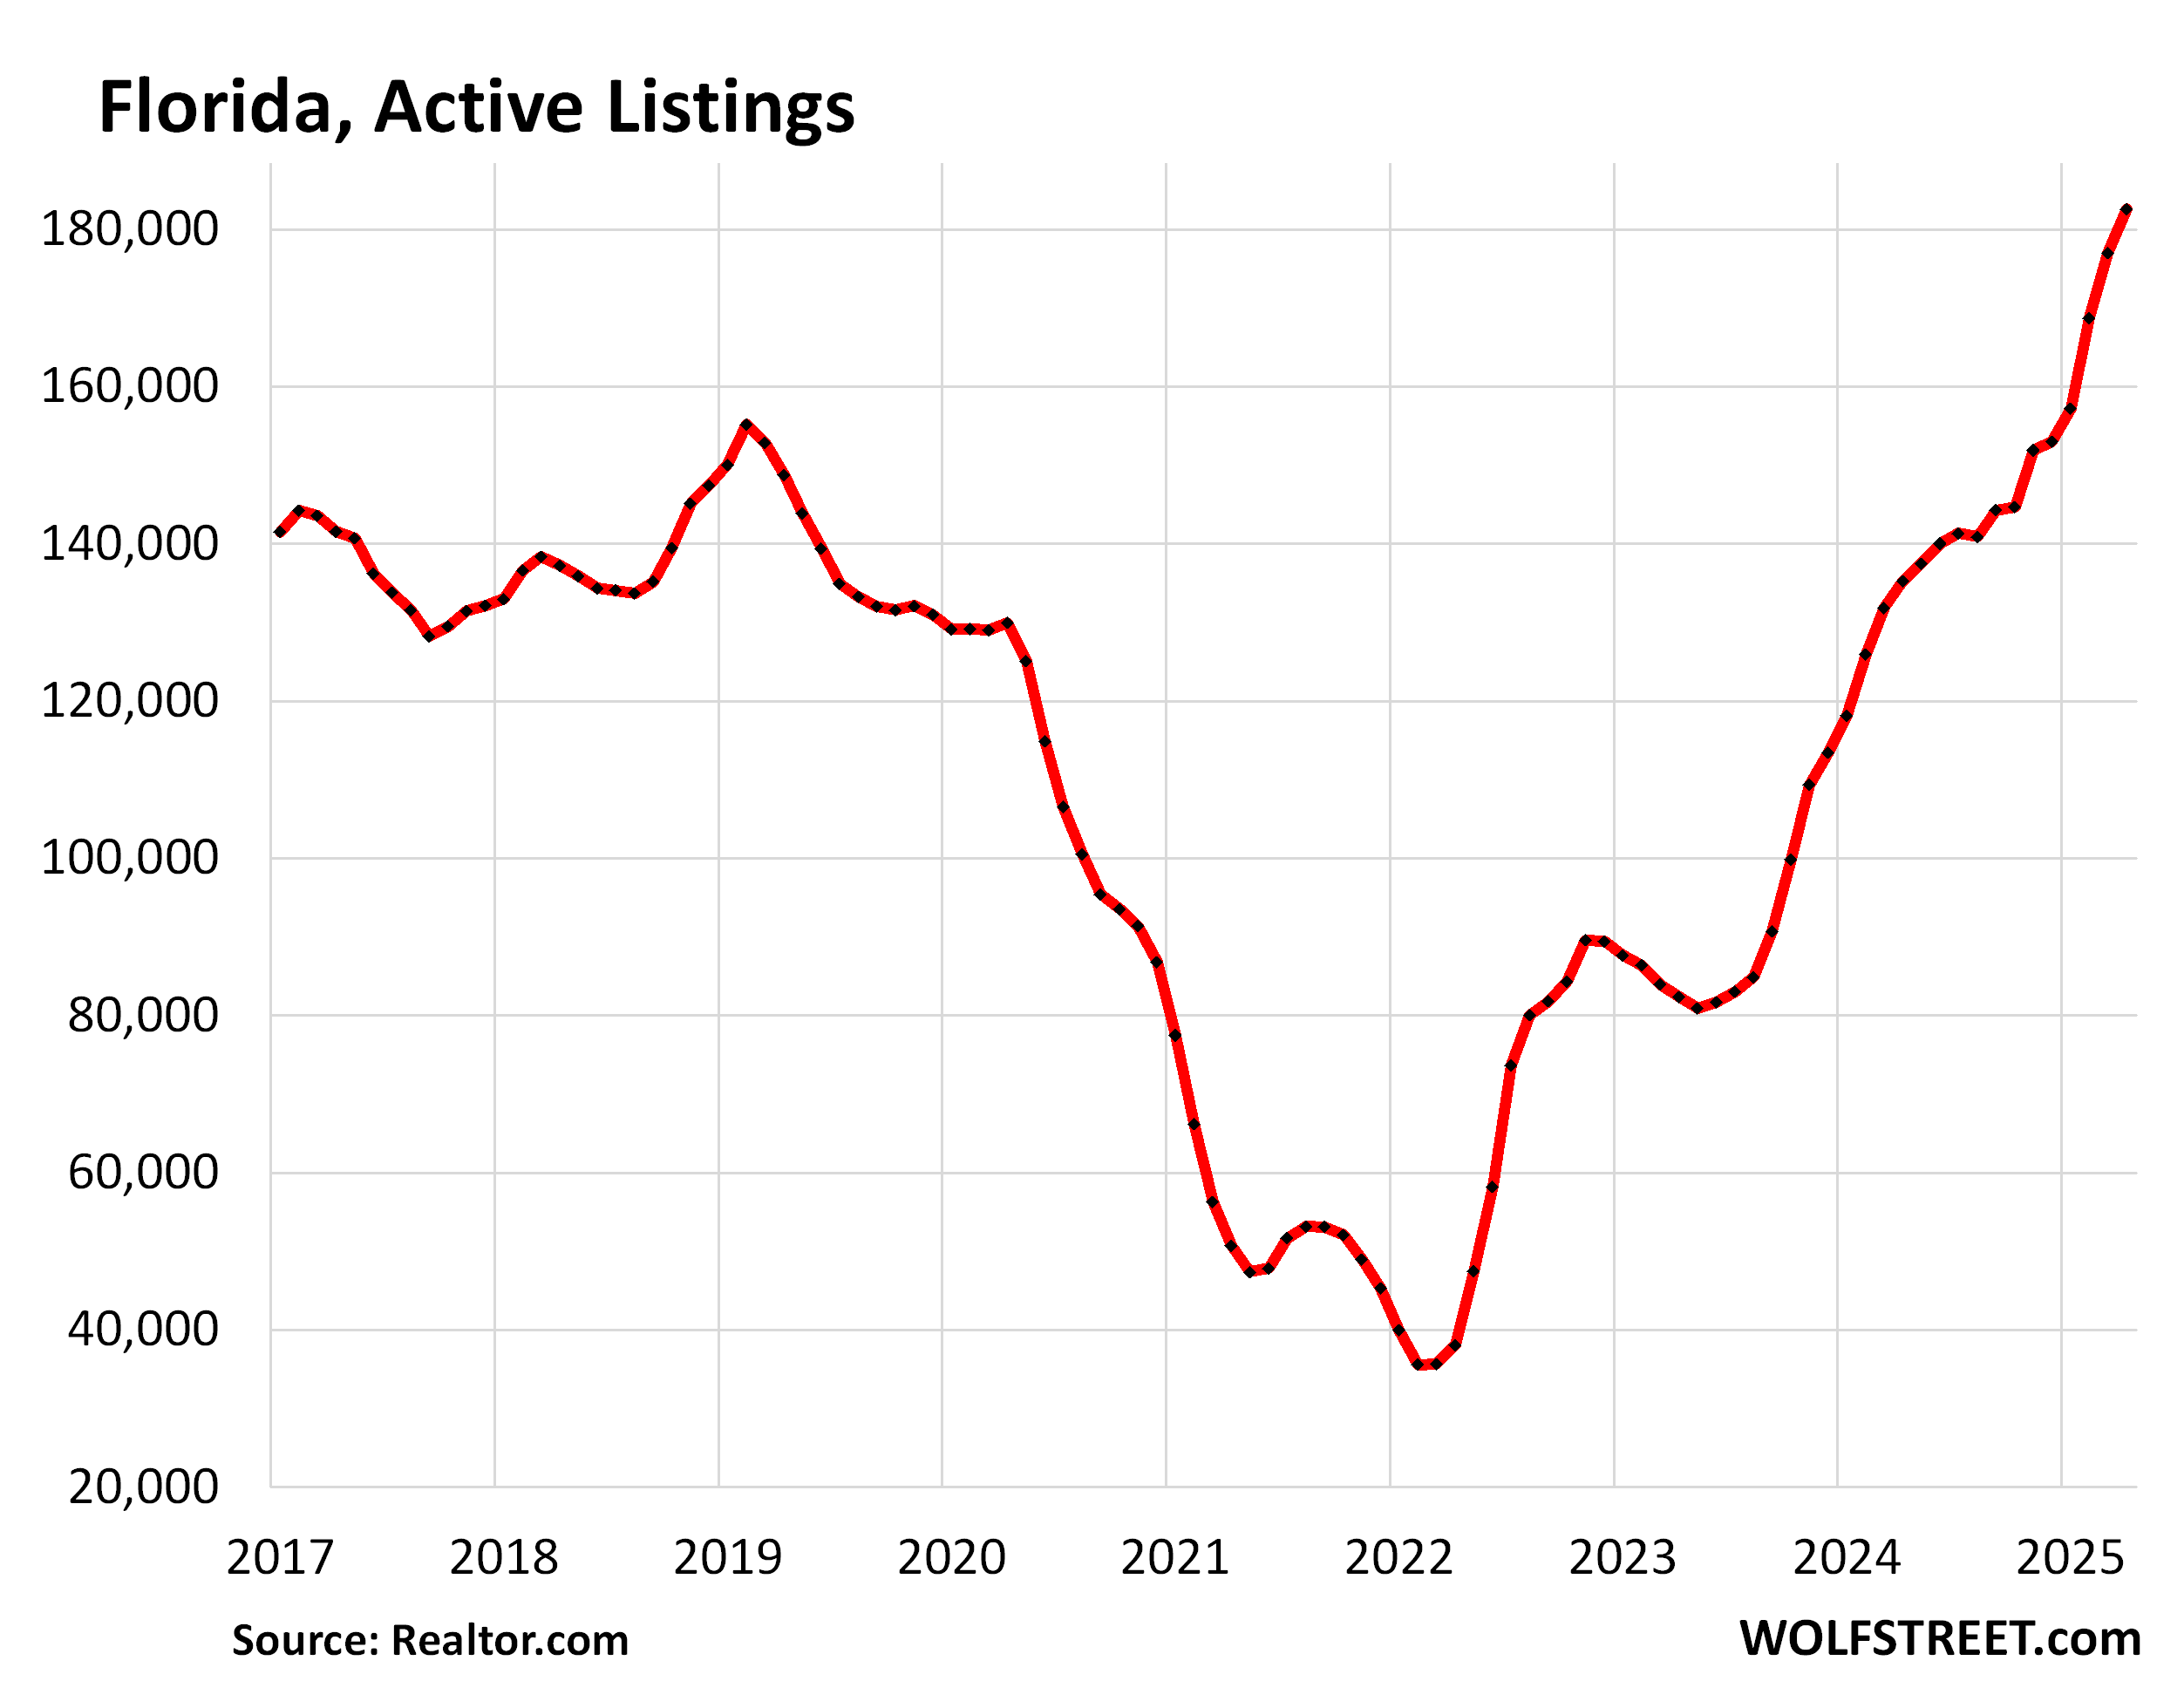
It’s precisely in the South where inventories pile up.
Florida and Texas dominate the vast South (map of regions in the comments below). And that’s where inventories of existing homes are ballooning, which is a good thing because the housing market needs these inventories.
In Florida, active listings of existing homes surged by 35% year-over-year in April, to 182,589 listings, the highest in the data by Realtor.com going back to 2016.
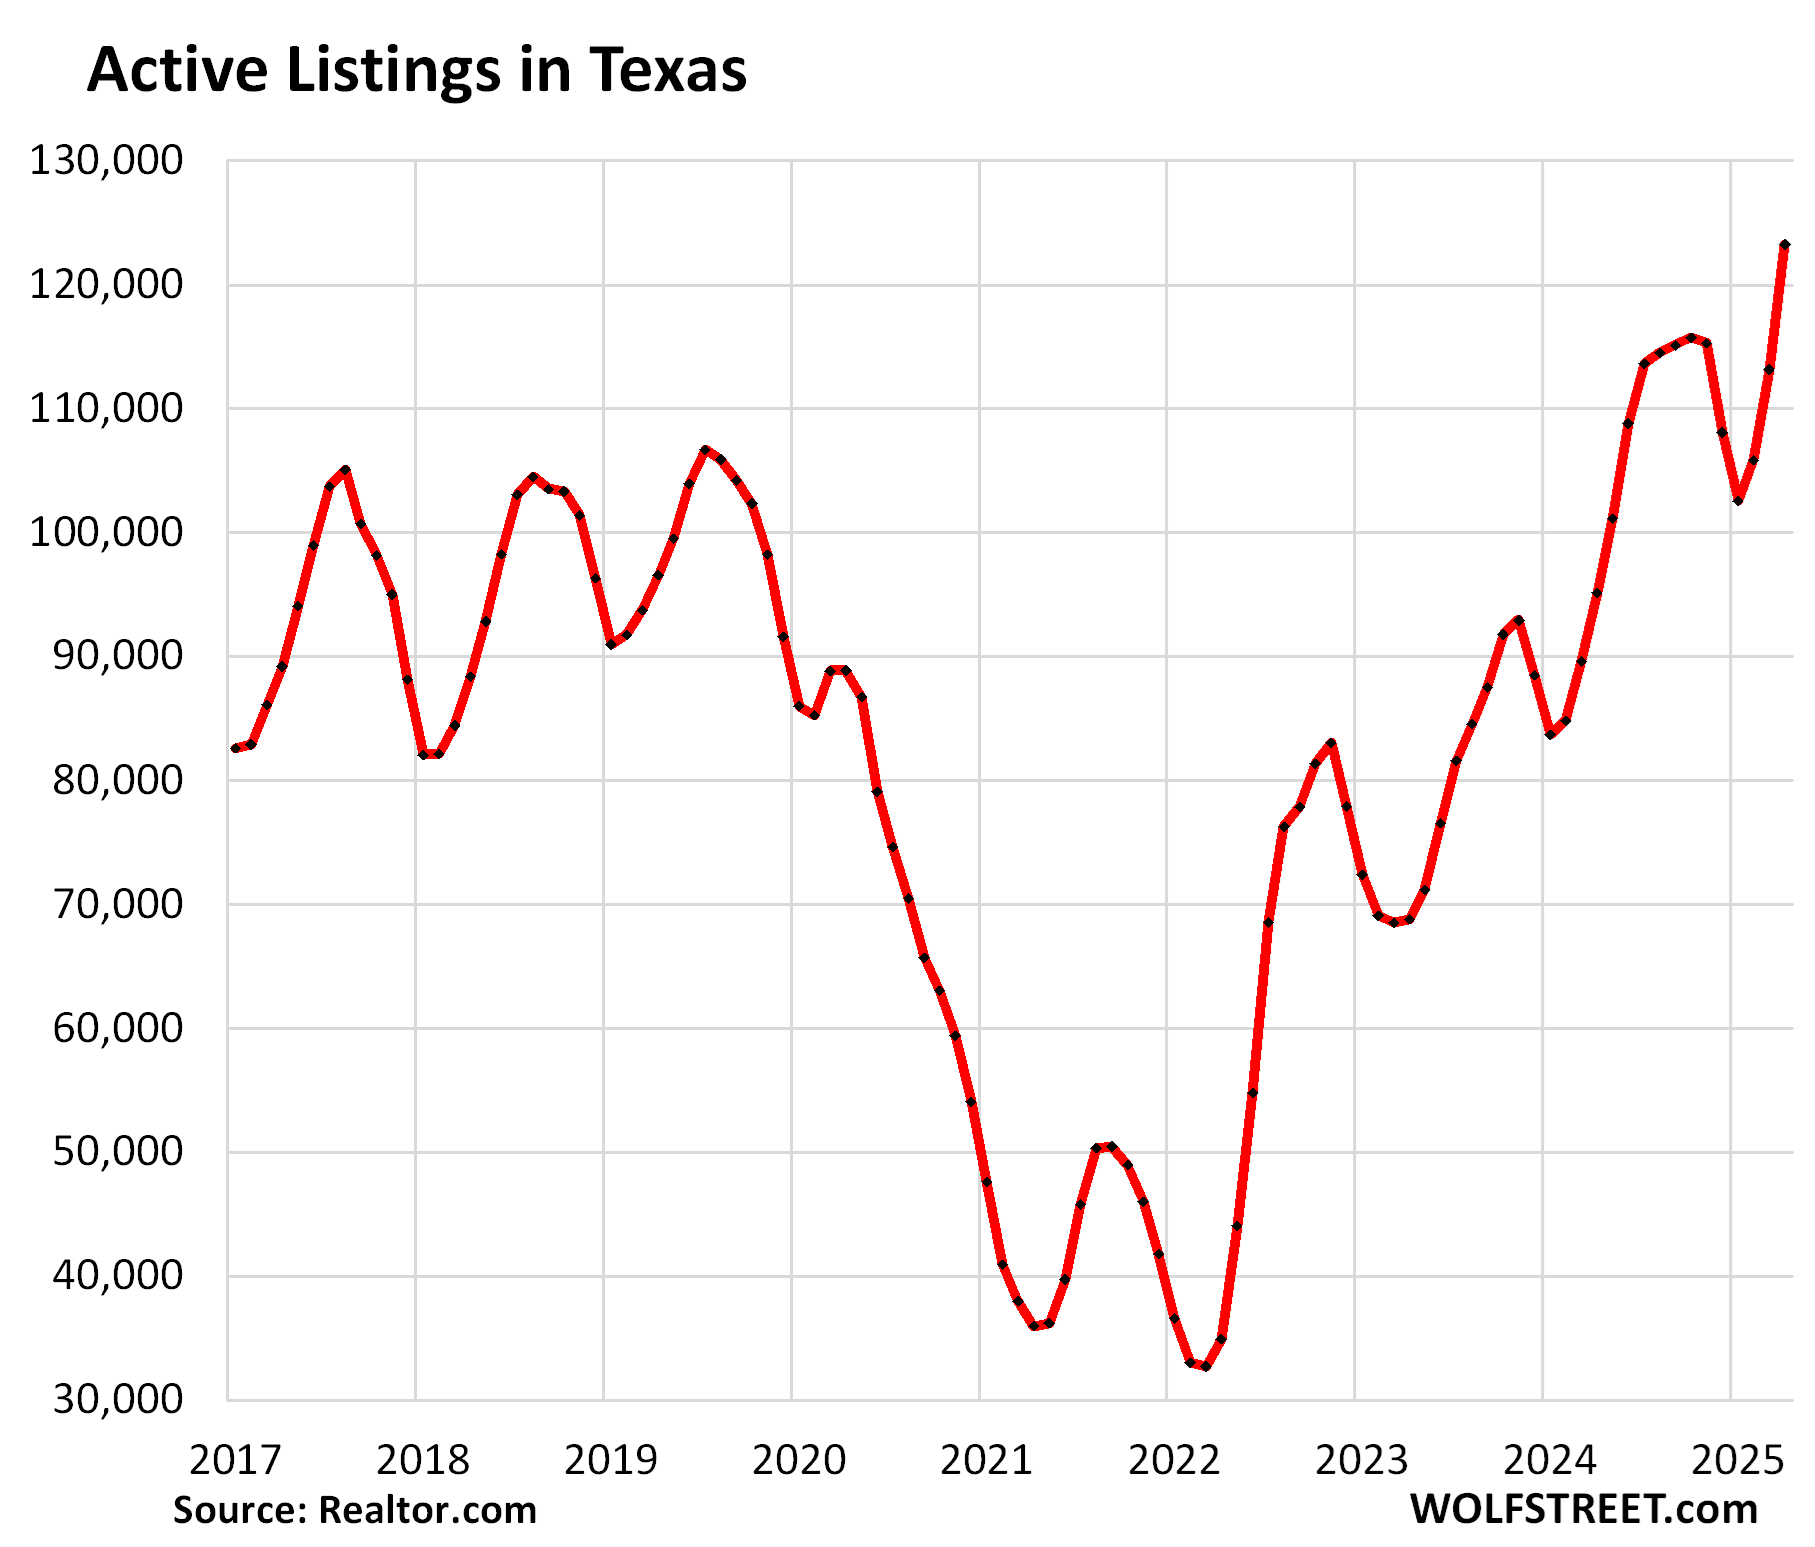
In Texas, active listings of existing homes jumped by 29% year-over-year in April, to 123,237 listings, the most inventory in the data by Realtor.com going back to 2016.
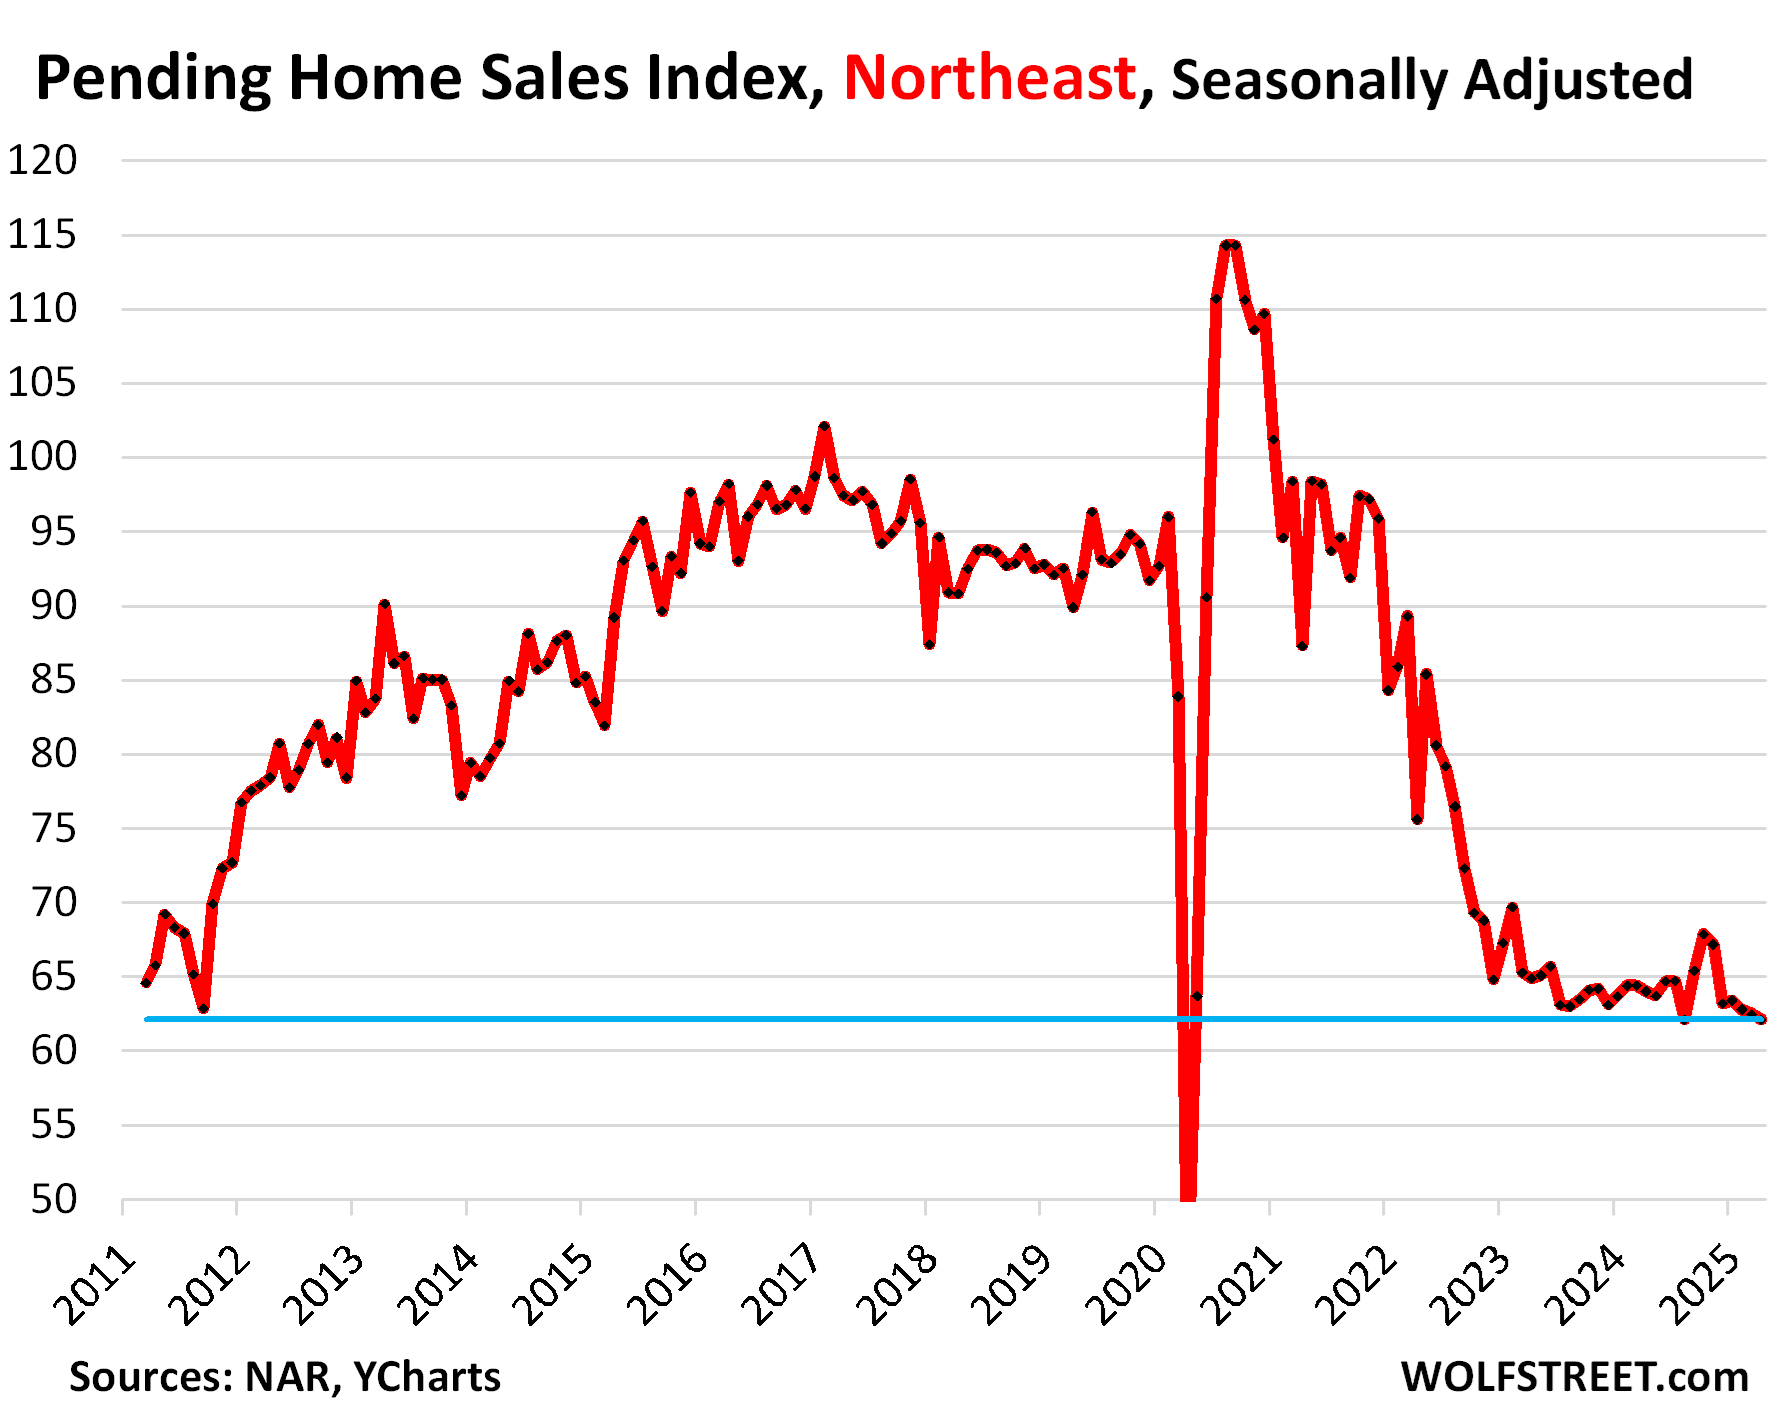
Pending sales in the Northeast and Midwest.
In the Northeast, pending sales of existing homes fell by 0.6% in April from March, seasonally adjusted, the worst April in the data, except lockdown April 2020, when sales essentially dried up.
Compared to the Aprils in prior years:
- 2024: -3.0%
- 2023: -4.3%
- 2022: -17.9%
- 2021: -28.9%
- 2020: +43.1% (lockdown April)
- 2019: -30.9%.
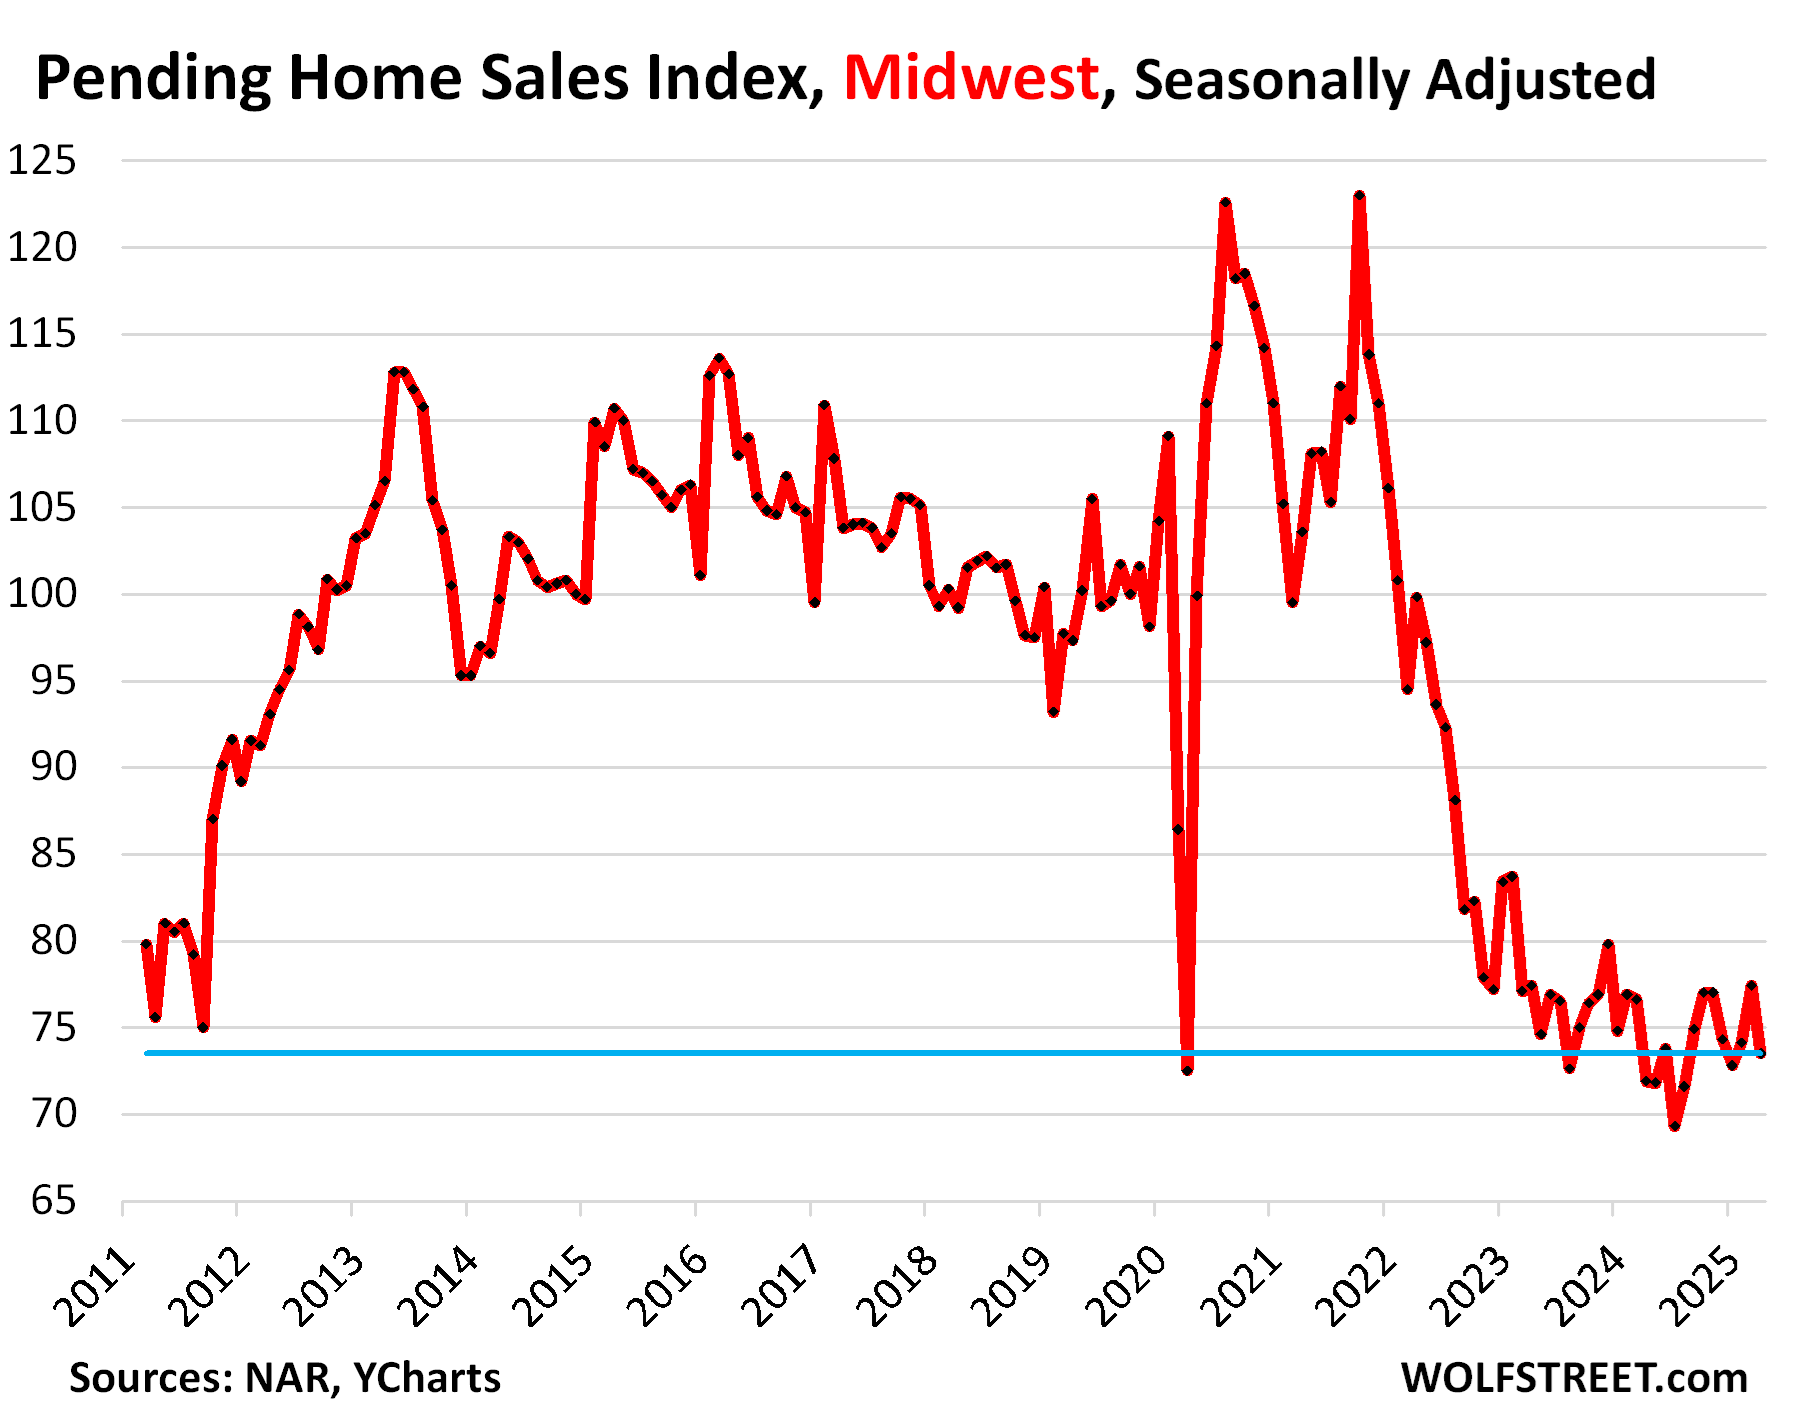
In the Midwest, pending sales plunged by 5.0% in April from March, seasonally adjusted, but were up by 2.2% from April 2024, and a hair above lockdown April 2020.
Compared to the Aprils in prior years:
- 2024: +2.2%
- 2023: -5.0%
- 2022: -26.4%
- 2021: -29.1%
- 2020: +1.4% (lockdown April)
- 2019: -24.5%.
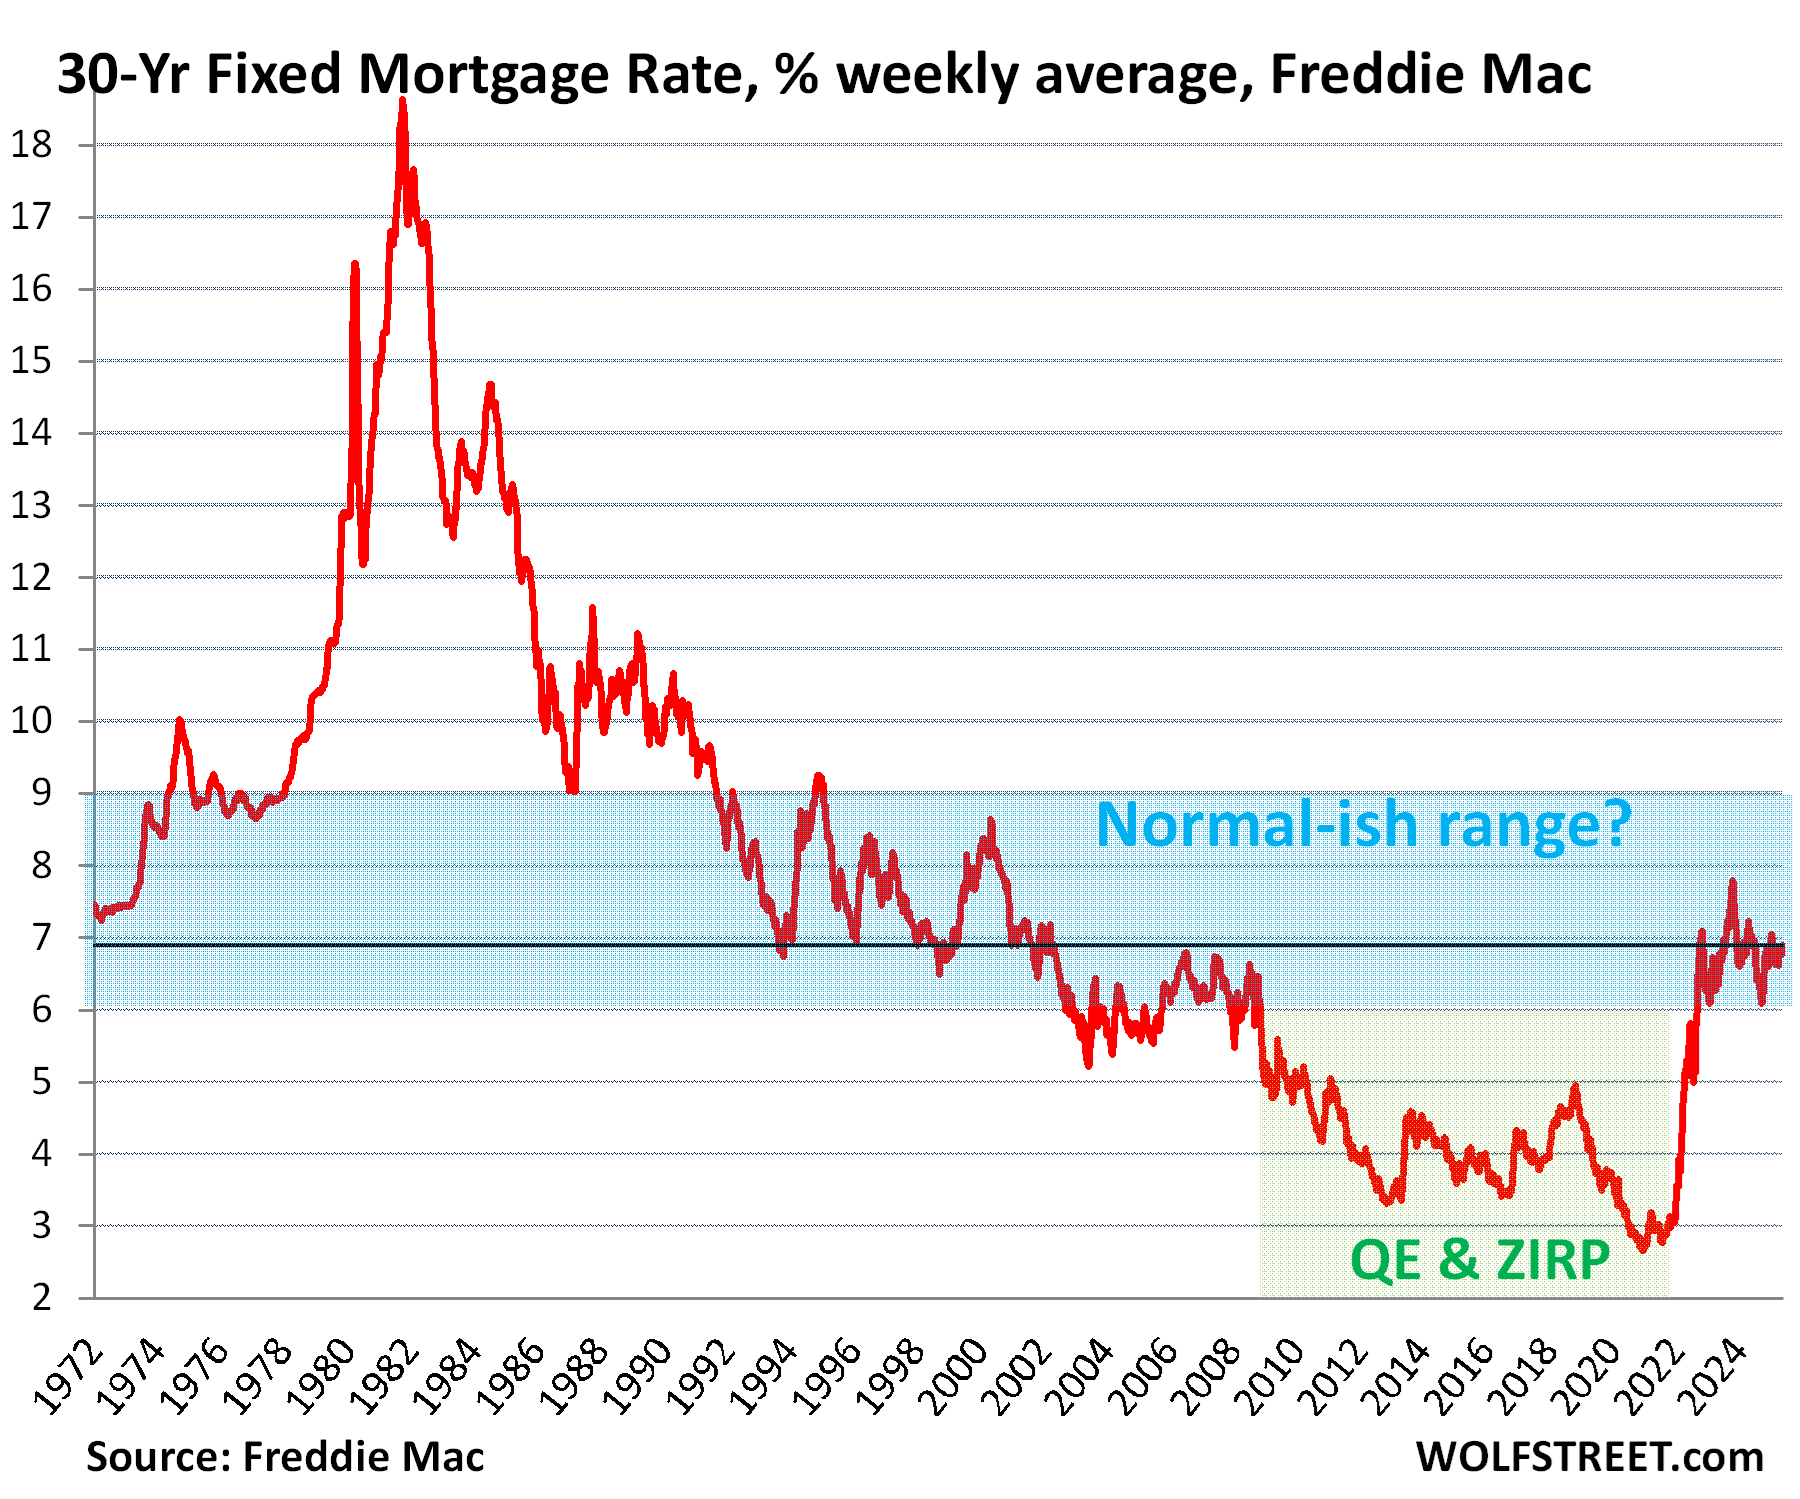
Mortgage rates are back in the normal-ish range.
The average 30-year fixed mortgage rate inched up to 6.89% in the latest reporting week, according to Freddie Mac today. It has been above 6% since September 2022.
Below-5% mortgage rates were brought about by the Fed’s QE, including the purchase of vast amounts of mortgage-backed securities, coupled with low inflation. But inflation returned aggressively in 2021 and has stuck around to form a new inflationary era, with higher interest rates to compensate lenders for higher inflation. And the huge national debt, and the ballooning national deficits that need to be financed with new debt sales, are putting upward pressure on long-term rates, including mortgage rates.
It’s not normal-ish mortgage rates that are the problem, but prices after the absolutely crazy price spikes that resulted from the Fed’s QE and interest-rate repression.
We give you energy news and help invest in energy projects too, click here to learn more
Crude Oil, LNG, Jet Fuel price quote
ENB Top News
ENB
Energy Dashboard
ENB Podcast
ENB Substack
