The Permian Basin remains the engine of U.S. oil growth, but it is steadily becoming gassier. Rising gas-to-oil ratios (GORs) mean every incremental barrel of crude now brings more associated natural gas. Without matching takeaway capacity, that gas depresses local prices, forces curtailments or flaring, and erodes the economics that keep oil drilling active.
New pipelines are the practical fix, linking Permian supply to Gulf Coast LNG, industrial demand, and power markets, supporting both near-term producer netbacks and longer-term U.S. system balance.
We are setting up interviews with CEOs and industry experts on pipelines, natural gas, and the path of growth. Is it too much too fast? Another real question is: can we rely too much on one power source for the U.S. grid? Looking forward to bringing Steve Reese, CEO of Reese Energy Consulting, back on the show to tackle some of these big questions.
Permian Production Is Growing and Getting Gassier
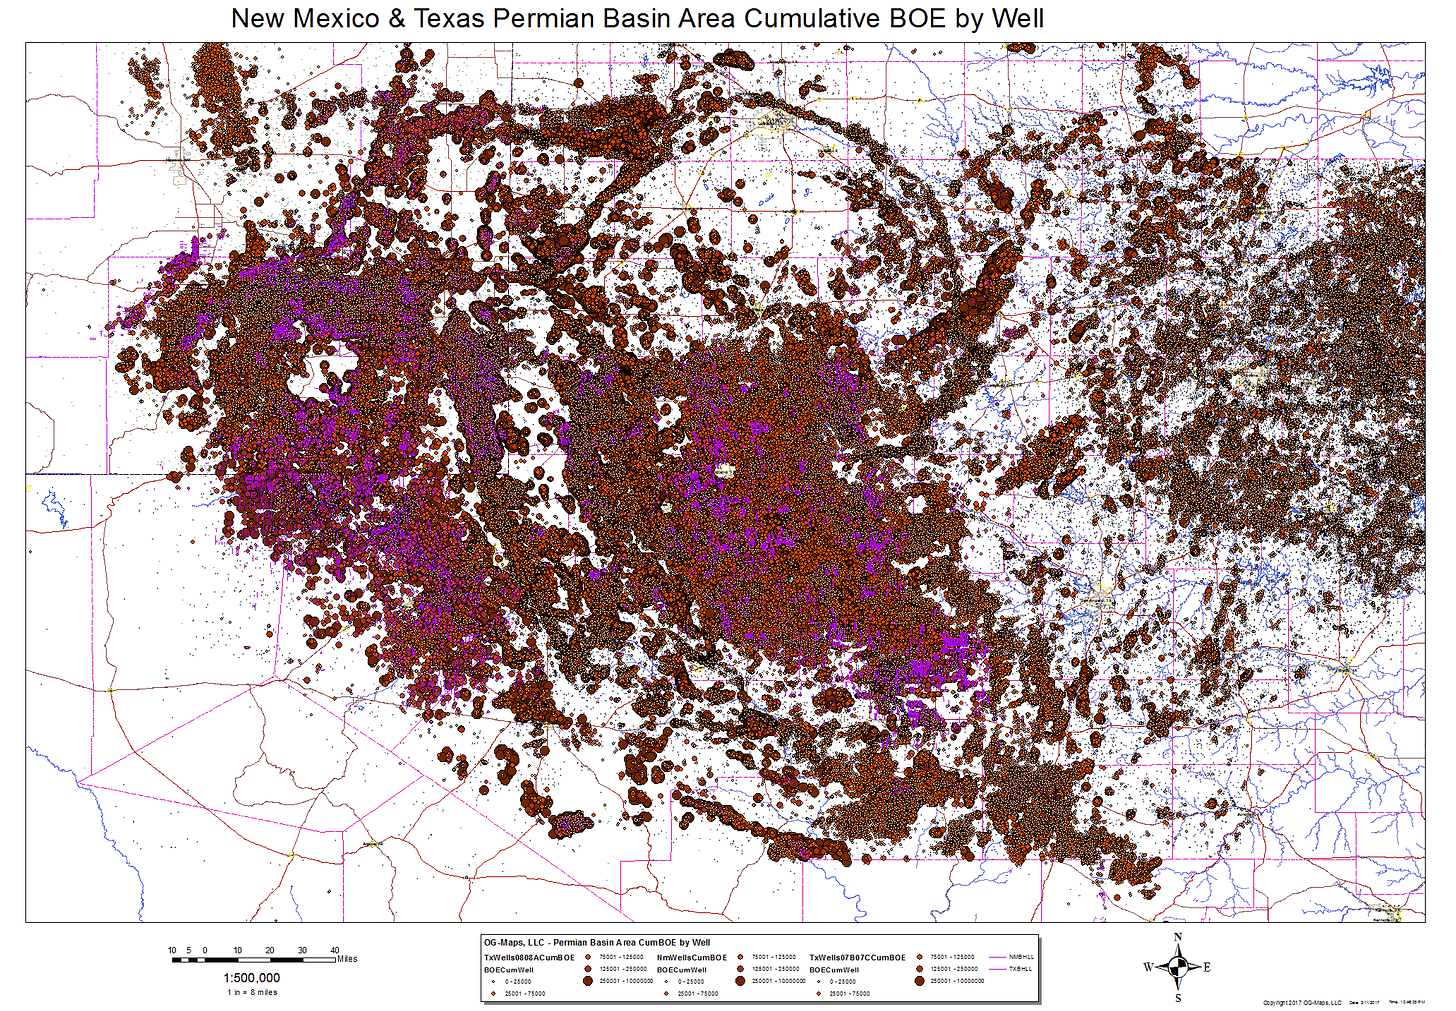
Associated gas (gas from primarily oil wells) drove most of the recent gains. In 2024 the Permian accounted for the bulk of U.S. associated-gas growth, reaching about 12.5 Bcf/d and 47 percent of the region’s total gas. Maturing wells, a shift toward gassier Delaware Basin targets, and continued oil-directed drilling all reinforce the trend. U.S. gross withdrawals hit a record 137 Bcf/d in July 2026, with Texas and New Mexico (the Permian core) providing the largest monthly gains. EIA’s Short-Term Energy Outlook projects further Permian gas growth of roughly 1.7 Bcf/d in 2026 and 2.2 Bcf/d in 2027, faster than oil, precisely because GORs keep rising.
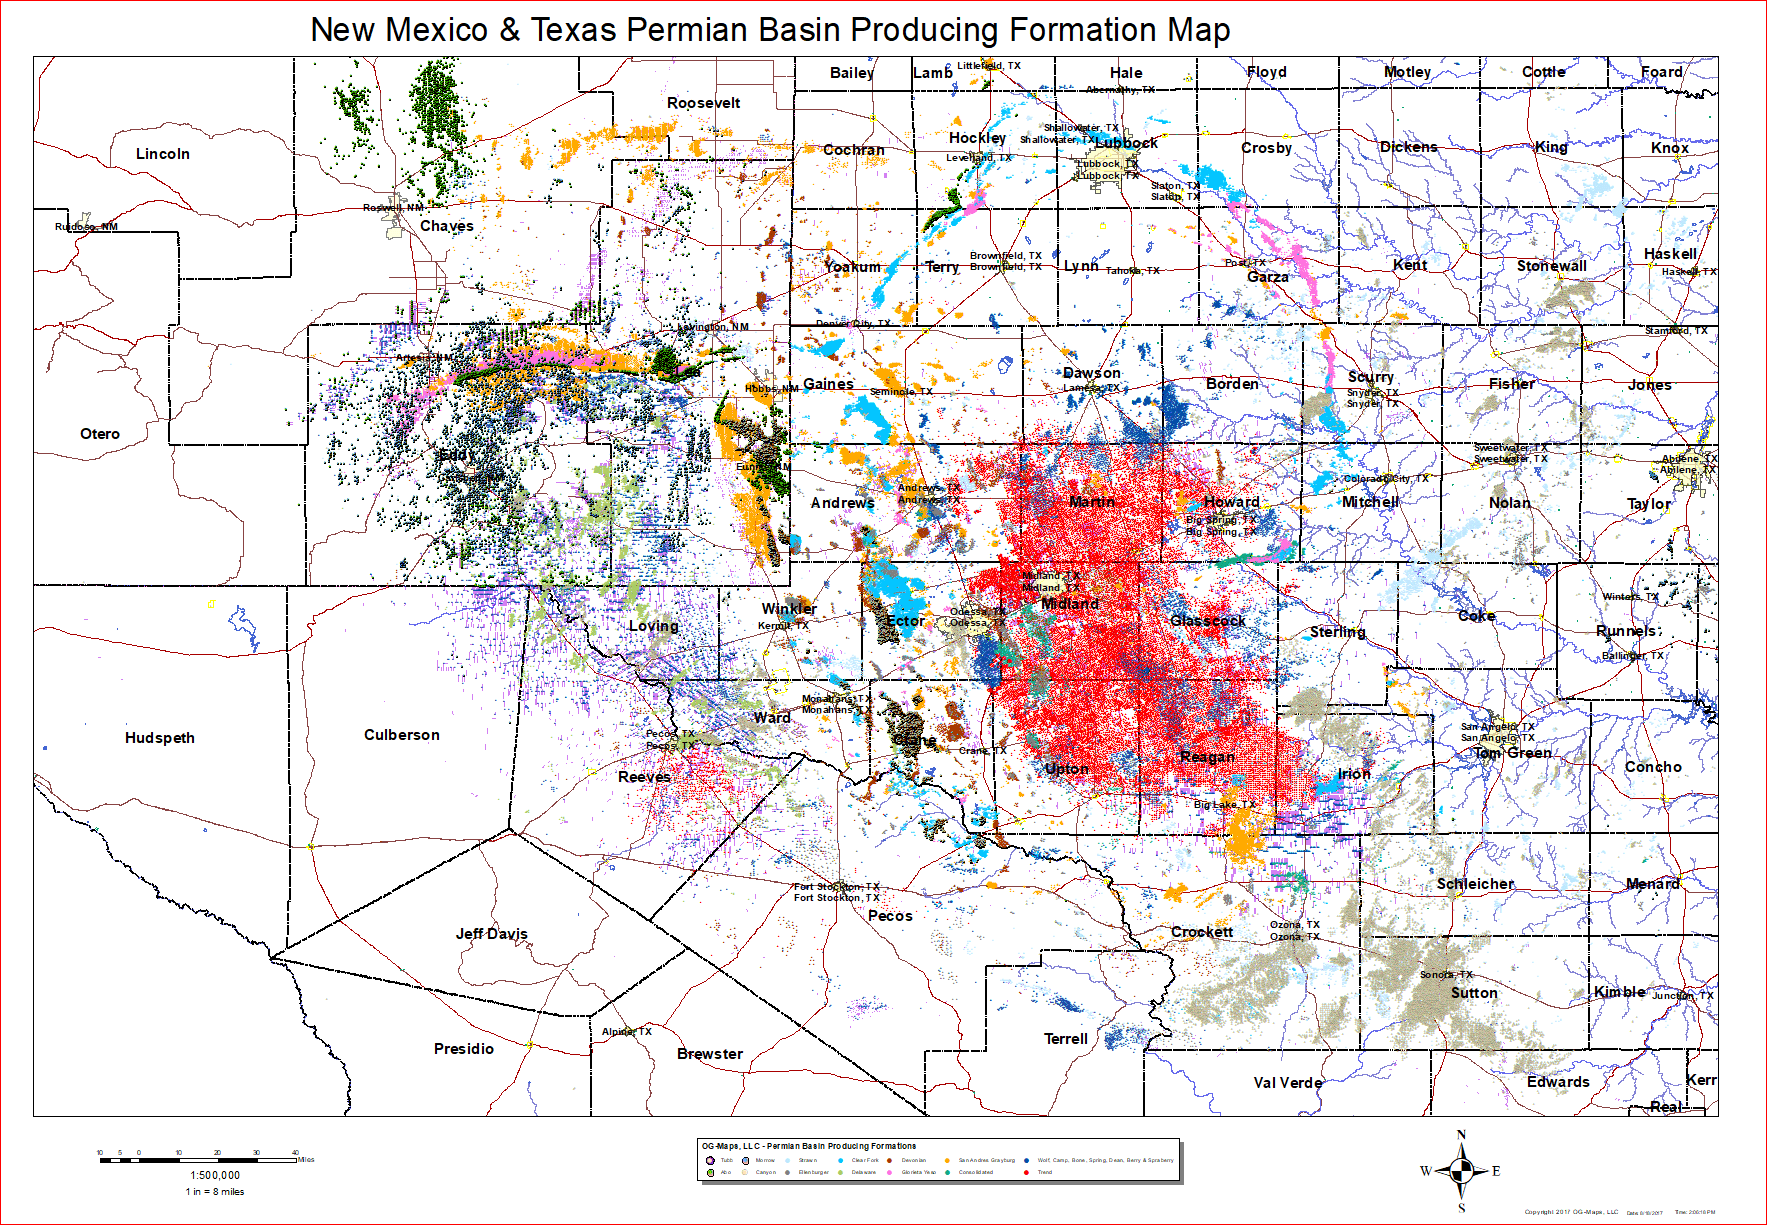
The map below shows the geographic footprint of producing formations across the Midland and Delaware sub-basins that generate this mixed stream.
Low Waha Prices Expose the Takeaway Bottleneck
When production outruns pipe, the Waha hub price collapses. In 2024, Waha averaged only about $0.17/MMBtu and traded negative on more than a third of days. Spring 2026 maintenance compounded the problem: prices stayed negative for extended stretches, bottoming near –$9 to –$10/MMBtu. Producers with firm transport could still realize better netbacks downstream; others shut in wells, curtailed volumes (estimates of 200–400 MMcf/d on some days), or flared. East Daley Analytics estimated basin-wide flaring near 1.7 Bcf/d in the first half of 2026. Those negative realizations directly raise the effective cost of oil production, because associated gas becomes a liability rather than a credit.
Kinder Morgan’s Gulf Coast Express expansion (about 0.6 Bcf/d) and the start of flows on Energy Transfer’s Hugh Brinson helped prices recover into positive territory later in 2026, but the structural need for more capacity remains.
The Pipeline Build-Out Under Way
- Matterhorn Express (WhiteWater-led, in service late 2024, expanded toward ~2 Bcf/d) already moves gas toward Katy.
- Hugh Brinson (Energy Transfer): ~400-mile, 42-inch line from the Waha area to Maypearl near Dallas-Fort Worth. Phase 1 capacity around 1.5 Bcf/d ramping in 2026, with potential to ~2.2–2.3 Bcf/d after additional compression.
- Blackcomb (WhiteWater, MPLX, Enbridge, Targa): ~366-mile, up to 2.5 Bcf/d from the Permian to Agua Dulce. Construction advanced through 2026 with expected late-2026 service, possibly phased.
- Eiger Express (WhiteWater 65 percent, ONEOK, MPLX, Enbridge): expanded to 3.7 Bcf/d, targeting mid-2028 in-service to the Katy area.
- Additional later projects include Energy Transfer’s Desert Southwest expansion (westbound, late 2020s) and the larger Solitude system (WhiteWater-led, up to 4.5 Bcf/d in the early 2030s).
Analysts at RBN Energy and East Daley note that FID projects could add on the order of 10 Bcf/d or more of Permian takeaway through the end of the decade. That volume is intended to absorb both ongoing oil-driven associated-gas growth and the higher GORs. Gulf Coast Express, Whistler, and earlier lines already form the backbone; the new pipes extend it.
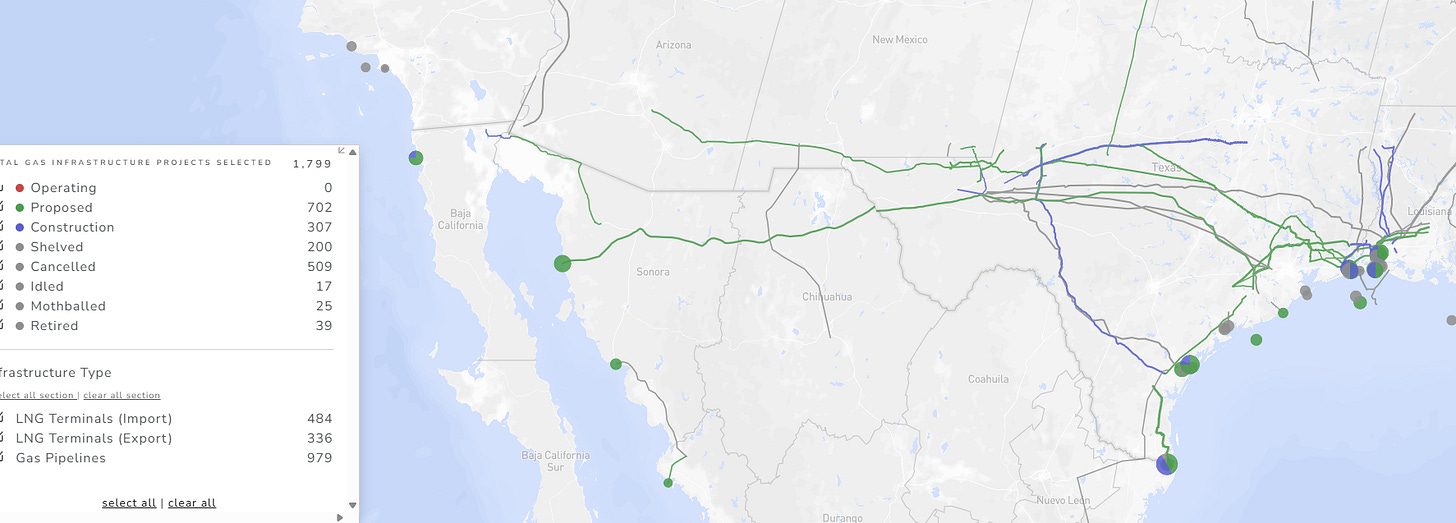
Global Energy Monitor proposed and under construction. Construction is in purple, and proposed is in purple.
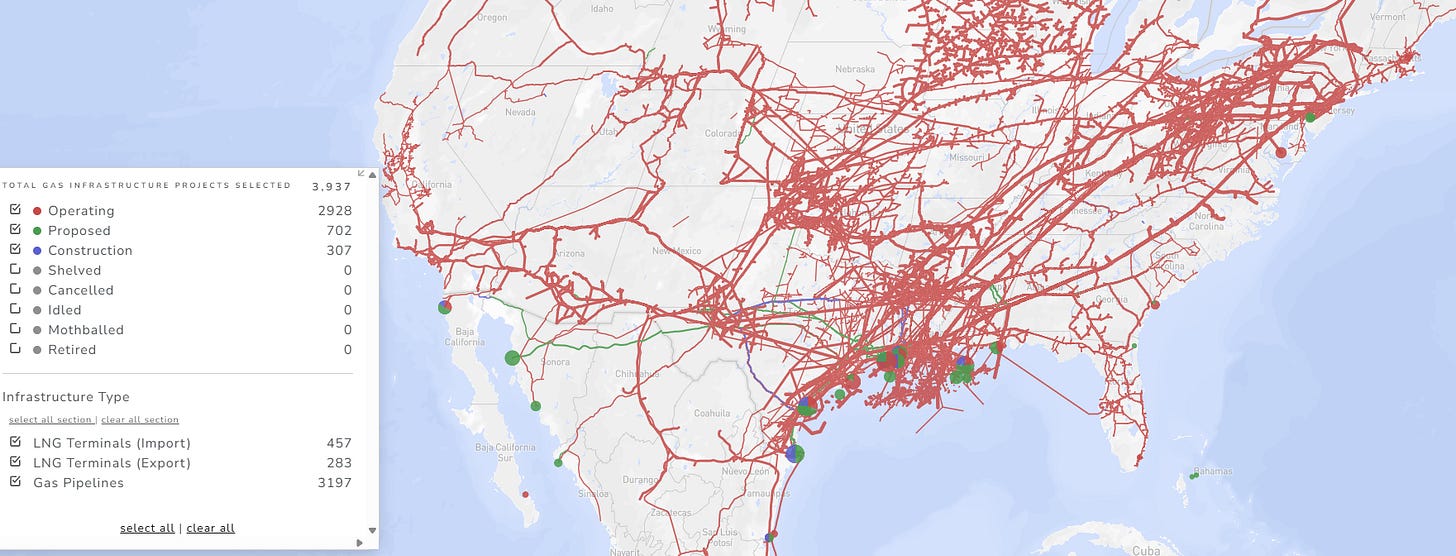
Add operating, and you start to see the scale of the US natural gas system. Also notice where the new and under-construction pipelines are, and where they are not.
Natural Gas Has Anchored the Grid for Two Decades
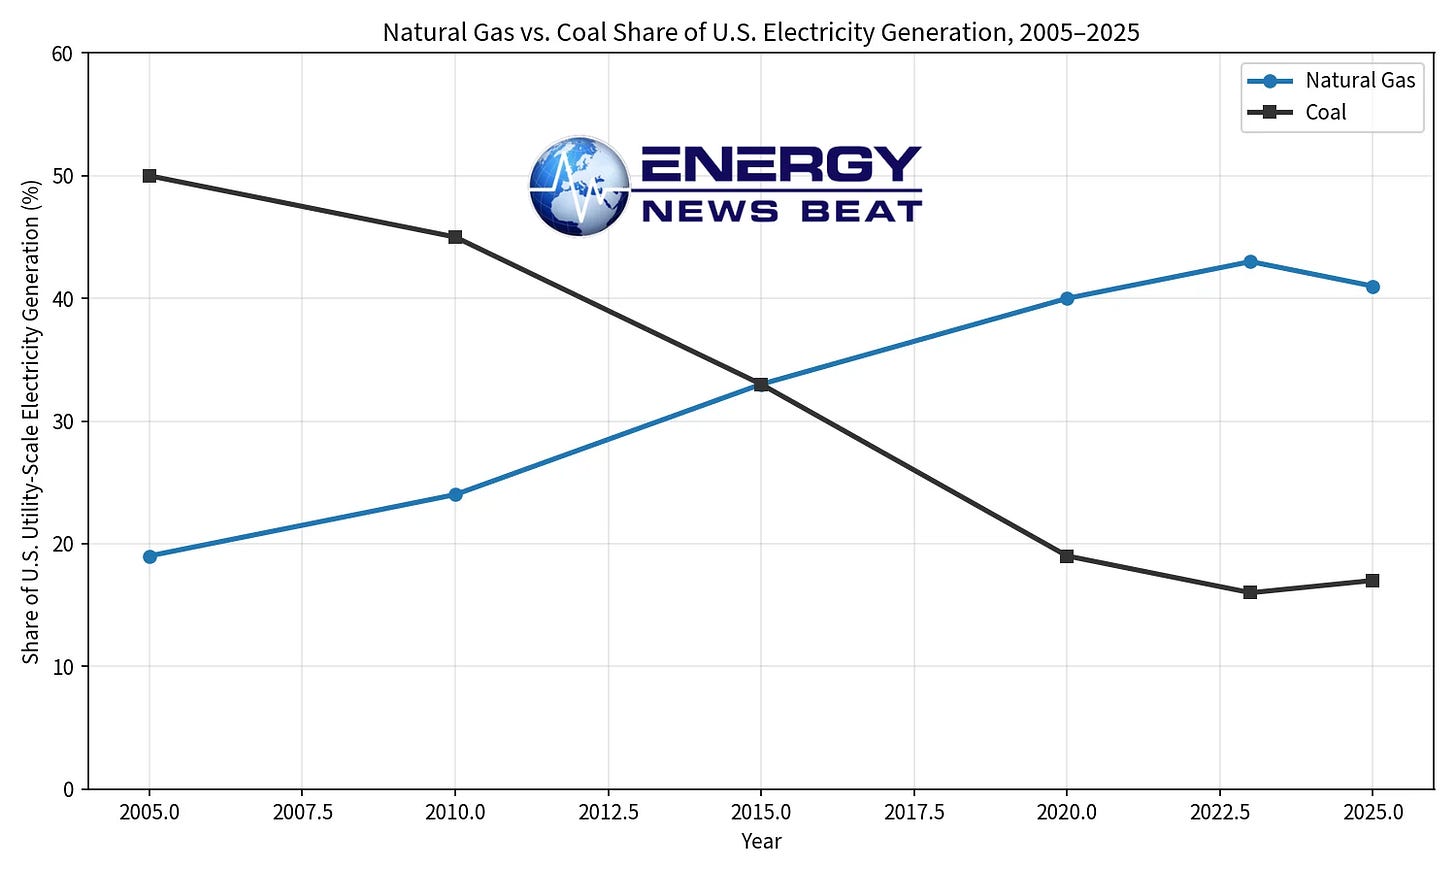
Gas plants provide the ramping and reliability that variable wind and solar cannot yet match at scale. Data-center and AI load growth, plus continued coal retirements, keep power-sector gas demand elevated even as efficiency improves. EIA and industry outlooks generally show LNG exports rising from roughly 15 Bcf/d recently toward 25–30+ Bcf/d by the early 2030s in most cases, with power-sector consumption remaining a large, relatively stable or growing domestic anchor until new nuclear capacity (both restarts and advanced reactors) arrives in material volumes later in the decade and into the 2030s. Gas is therefore the bridge fuel that keeps the lights on while longer-lead nuclear projects advance.
Is This the Natural Gas Boom Years?
That outcome is not automatic. Overbuild risk exists if oil activity slows sharply, but the base of existing wells and rising GORs provide a durable gas tail. The more immediate constraint has been infrastructure timing.
Benefits for Investors and Consumers
We will look at earnings reports from key natural gas providers, pipelines, and other key investing issues in the next few weeks. We are looking at earnings, dividends, and growth. Refineries and exploration and production companies will be an interesting comparison. A full-blown comparison of upstream, downstream, and midstream investments for consumers is a fun topic we have been working on for a while.
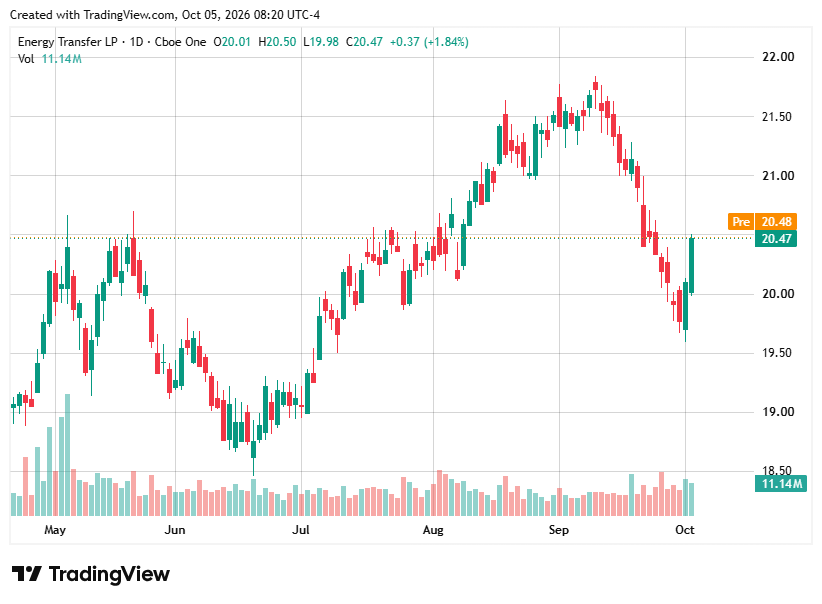
Energy Transfer: (LP)
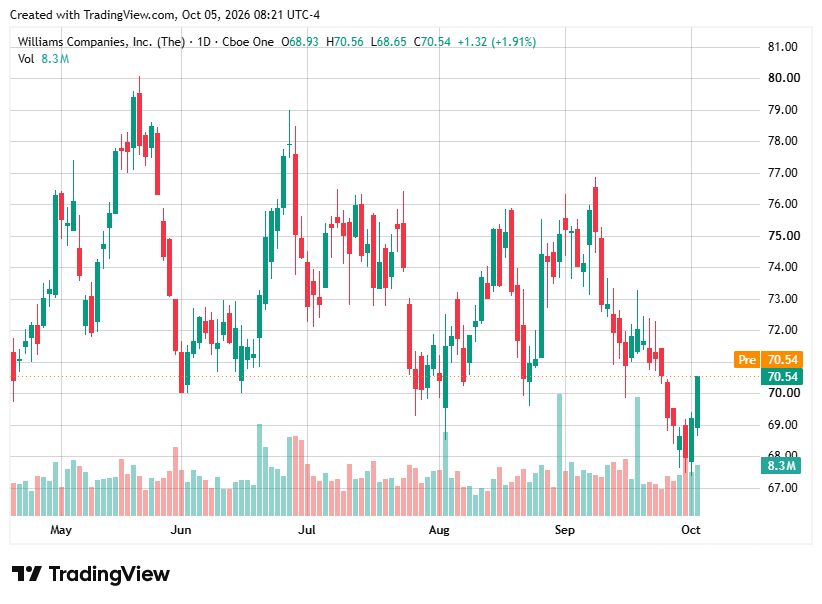
Williams Co.
Consumers benefit from more stable regional prices, reduced flaring (lower emissions intensity), reliable power-sector fuel, and the export revenues that improve the U.S. trade balance. Affordable associated gas also keeps industrial and power costs competitive relative to regions that must import LNG.
Permitting Reform Remains Essential
In 2026, FERC revised its NEPA procedures to shorten reviews, waived aspects of Order 871 that had delayed construction after certificate issuance, and raised blanket-certificate cost thresholds so operators can make smaller modifications without case-by-case approval. These steps respond to executive direction aimed at faster energy infrastructure decisions. Continued reform—predictable timelines, limits on late-stage litigation, and coordinated federal-state reviews—is required if the next wave of pipes, LNG terminals, and power plants is to match the pace of Permian supply and data-center demand. Delays simply recreate the Waha price collapses and flaring episodes of 2024–2026.
New Permian takeaway is therefore not optional infrastructure. It is the mechanism that converts a gassier oil basin into stable, marketable supply, supports oil drilling economics, balances the U.S. gas system, and keeps natural gas available as the grid’s primary flexible fuel until nuclear additions scale. The projects now under construction and sanctioned are the concrete expression of that requirement.
Coming up at 9:00 is the Energy Realities live with David Blackmon on his LinkedIn, The Energy News Beat YouTube, and Dr. Tammy Nemeth’s YouTube as well. Should be fun.

Thank you to all of our great subscribers, patrons, and sponsors. We are going to have a great week.
Check out the World’s Greatest Podcast Show Notes at EnergyNewsBeat.co or EnergyNewsBeat.com.
Appendix: Sources
- EIA, “U.S. natural gas production reached a record high in July 2026,” Today in Energy, October 2026: https://www.eia.gov/todayinenergy/detail.php?id=68225
- EIA Short-Term Energy Outlook, natural gas section (September 2026 release): https://www.eia.gov/outlooks/steo/report/natgas.php
- EIA, Electricity explained / generation by source: https://www.eia.gov/energyexplained/electricity/electricity-in-the-us.php
- EIA / Enverus data summarized in Industrial Info and Midland Reporter-Telegram on 2024 associated-gas growth (Permian 12.5 Bcf/d): https://www.industrialinfo.com/news/article/eia-notes-rise-in-us-associated-natural-gas-production–349755 and https://www.mrt.com/business/oil/article/permian-associated-gas-growth-21209409.php
- CompressorTECH² / EIA on rising GORs (17.2 to 27.6 Bcf/d marketed gas, 2021–2025): https://www.compressortech2.com/news/rising-gas-oil-ratios-drive-permian-natural-gas-production-growth/8124560.article
- RBN Energy, “Comeback Story? – New Pipelines Boost Permian Natural Gas Economics,” September 2026: https://rbnenergy.com/daily-posts/blog/new-pipelines-boost-permian-natural-gas-economics-oil-still-drives-activity
- East Daley Analytics notes on Eiger Express expansion to 3.7 Bcf/d and gassier wells: https://eastdaley.com/daley-note/eiger-express-expansion-raises-stakes-on-permian-overbuild
- RBAC Inc. on Hugh Brinson and Blackcomb timing: https://rbac.com/can-new-pipeline-capacity-keep-up-with-permian-production/
- ADI Analytics, “New takeaway capacity remains critical for Permian gas markets,” September 2026: https://adi-analytics.com/2026/09/22/new-takeaway-capacity-remains-critical-for-permian-gas-markets/
- Reporting on Waha negative prices and curtailments (Midland Reporter-Telegram, East Daley, VanEck): https://www.mrt.com/business/oil/article/permian-tx-waha-gas-prices-output-22347956.php
- FERC actions on NEPA revisions and natural-gas facility barriers (2026): https://www.ferc.gov/news-events/news/ferc-revises-nepa-procedures-make-permitting-more-efficient and https://www.ferc.gov/news-events/news/ferc-takes-action-remove-barriers-building-natural-gas-facilities
- OilPriceAPI / EIA Drilling Productivity Report basin summary (oil ~6.84 million b/d): https://www.oilpriceapi.com/basins/permian
- Deloitte Insights on U.S. gas demand growth drivers (LNG and power): https://www.deloitte.com/us/en/insights/industry/oil-and-gas/us-natural-gas-lng-demand-growth.html
Data are current as of early October 2026 and drawn primarily from EIA, company disclosures, and midstream analysts. Pipeline in-service dates remain subject to construction and commissioning progress.