By Wolf Richter for WOLF STREET.
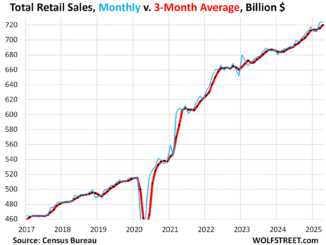
Our Drunken Sailors, as we lovingly and facetiously have been calling them for over a year, the pillars of the US economy, are still at it, splurging at retailers. Retail sales jumped by 1.0% in July from June, seasonally adjusted, the biggest month-to-month increase since January 2023. Year-over-year, not seasonally adjusted, retail sales rose 4.0%, to $724 billion.
To see the trend beyond the month-to-month squiggles, we look at the three-month average, which includes all revisions. It rose by 0.3% in July from June, and was up 2.4% year-over-year.
The big winner was ecommerce – the second largest category, behind auto dealers, with 17% of total retail sales: The three-month average jumped 1.0% in July from June and was up 7.4% year-over-year! That’s where much of the growth in retail sales is. Ecommerce sales are on track to surpass auto dealers in a year or two.
Big price drops in goods make these retail sales even stronger.
In the chart above, the steep increases in retail sales in 2021 and 2022 were caused by massive price increases in the goods that retailers sell, including new and used vehicles which account for 19% of total retail sales.
These price spikes started to unwind in late 2022, with prices spiraling lower in many categories. Food is one of the exceptions. Gasoline prices plunged. Prices of durable goods, including motor vehicles, are in a historic downward spiral from the crazy spike during the pandemic. The CPI for durable goods has dropped by 6% from the peak two years ago. Prices for used vehicles have plunged by 19%. New vehicle prices have dropped 2%. Consumer electronics, appliances, furniture, sporting goods, etc. have all seen price drops.
Adjusted for these price declines in goods – so, on an inflation-adjusted basis – retail sales look even better. Those price declines should have pushed down retail dollar-sales. But dollar sales rose despite the price declines, as retailers sold more merchandise at lower prices.
And this will show in the inflation-adjusted consumer spending and GDP data. This type of retail sales growth, despite declining prices, supports solid GDP growth.
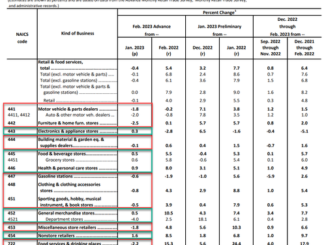
Sales at the largest categories of retailers.
Sales at new and used vehicle dealers and parts stores, the largest category with 19% of total retail sales, bounced back partially in July from the chaos in June following the CDK hack that had put thousands of dealers on ice. And so the three-month average in July rose 0.4% from the beaten-down June level.
But the three-month averages of July and June – both of which include the steep effects of the June CDK hack – were down from May. The relatively flat dollar-sales for the past 18 months, despite rising retail unit sales, are due to dropping prices. All figures based on three-month averages, seasonally adjusted:
Sales: $132 billion
From prior month: +0.4%
Year-over-year: -0.5%
The spike in dollar-sales in 2021 and 2022 was based on price gouging by dealers and automakers, even as unit sales volume plunged due to vehicle shortages. It’s these price gouges that have been getting unwound since mid-2023:
Ecommerce and other “nonstore retailers” (17% of total retail trade), includes ecommerce retailers, ecommerce operations of brick-and-mortar retailers, and stalls and markets, three-month averages:
Sales: $122 billion
From prior month: +1.0%
Year-over-year: +7.4%
Food services and drinking places (the third-largest category, 13% of total retail), includes everything from cafeterias to restaurants and bars.
Sales have been essentially flat all year. But if you hold your tongue just right, you can see the slow-down earlier this year, and then slow growth out of the trough over the past four months:
Sales: $95 billion
From prior month: +0.2%
Year-over-year: +4.1%
Food and Beverage Stores (12% of total retail). Generally, only price increases and population growth increase sales.
Prices have nearly flattened out at very high levels after spiking massively into early 2023. In July, the CPI for food at home was roughly flat with January and up just 1.1% from a year ago.
But the population has been surging: The Congressional Budget Office, using ICE and Census data, estimated that in 2022 and in 2023, the US population grew by 6 million people, nearly exclusively through the waves of migrants arriving. These people work (nonfarm employment rises), or are looking for work (pushing up the unemployment rate), and they’re buying stuff, including at food and beverage stores, thereby pushing up their retail sales, which is what we can see here (three-month averages):
Sales: $83 billion
From prior month: +0.4%
Year-over-year: +2.3%
General merchandise stores, without department stores (9% of total retail). These stores are also places where the 6 million additional US population buy their essentials, such as groceries at Walmart, which announced price rollbacks on many items.
Sales: $65 billion
From prior month: +0.3%
Year-over-year: +3.3%
Gas stations (8% of total retail sales). Dollar-sales at gas stations move in near-lockstep with the price of gasoline. The price of gasoline plunged from the top of the spike in June 2022, but over the past 12 months has roughly stabilized:
Sales: $53 billion
From prior month: -1.3%
Year-over-year: +0.9%
Sales in billions of dollars at gas stations, including other merchandise that gas stations sell (red, left axis); and the CPI for gasoline (blue, right axis):
Building materials, garden supply and equipment stores (6% of total retail). The prepandemic trendline in blue. Home Depot was singing the blues about this the other day. The mindboggling remodeling boom started fizzling in late 2022.
Sales: $41 billion
From prior month: +0.6%%
Year-over-year: -1.5%
Take the Survey at https://survey.energynewsbeat.com/