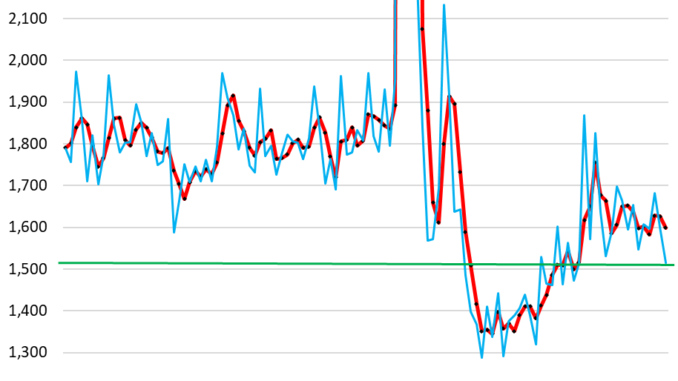
Layoffs & Discharges drop further, and are far lower than before the pandemic, as employers cling to their workers.
By Wolf Richter for WOLF STREET.
Layoffs and discharges fell for the second month in a row, to 1.51 million in April, seasonally adjusted, the lowest since December 2022 during the labor shortages, and down substantially from the pre-pandemic range (blue in the chart).
The tree-month moving average, which irons out the month-to-month squiggles, fell to 1.60 million, also substantially below the prepandemic range (red).
This is a sign that, despite all the layoff headlines, employers are hanging on to their workers. Some economists have mused that employers are “hoarding” workers, rather than letting them go proactively, and that they’re doing so because they got burned with the labor shortages after their mass-layoffs during the pandemic. If true, that would be a good thing.
During the Good Times in 2014-2019, layoffs and discharges averaged 1.8 million per month. That was part of the normal way of business. During the Great Recession, monthly layoffs and discharges blew past 2.5 million. In March and April 2020, they averaged over 10 million.
This data is based on surveys of about 21,000 work sites, released today by the Bureau of Labor Statistics as part of its Job Openings and Labor Turnover Survey (JOLTS).
Layoffs and discharges compared to employment. Employment has grown over the years, and when compared to the magnitude of employment, the trend in layoffs and discharges becomes even clearer.
Layoffs and discharges fell to 0.96% of total nonfarm employment in April, the lowest since November 2022.
The three-month average fell to 1.01%, far below the prepandemic range. Employers are clinging to their workers, and they’re clinging to them more tightly than they did a year ago, and much more tightly than they did before the pandemic:
And workers stick to their jobs again. Voluntary quits ticked up to 3.51 million in April, but have remained in essentially the same range since August 2023 (blue). The three-month moving average ticked up to 3.48 million (red).
Quits have now stabilized at this level where they’d been before the pandemic. So the great resignation is over; workers no longer quit their jobs in these massive numbers. And employers are hanging on to them, and so the crazy and costly churn in 2021 and 2022 has calmed down, and employers need to hire fewer new people to replace the departing people.
Job openings fell, as fewer openings were left behind by lower discharges and quits. In April, job openings fell to 8.06 million, the lowest since February 2021. The three-month average fell to 8.41 million, the lowest since March 2021. But both were still well above prepandemic levels:
The ratio of job openings to nonfarm employment takes into account the growth of employment over the years. On this basis, job openings fell to 5.3% of nonfarm employment, the lowest since March 2021. The long-term chart shows just how historically high this rate of job openings still is – and it’s still far from normalized:
Hires ticked up to 5.64 million in April, and has remained roughly in the same range since November, and in the range of 2018 and 2019.
The three-month average dipped to 5.68 million, also roughly in the same range for six months.
As fewer people quit their jobs, and as fewer people were discharged, the need to fill newly vacant jobs declines, and so fewer people need to be hired to replace departing workers, and the churn in the workforce declines.
Powell often cites the data from the JOLTS report, among other labor market data, for signs of labor market tightness, for signs that the labor market moves back into balance. We can see that the wild and wooly labor shortages and churn during the pandemic are gone, that the labor market is no longer crazy-tight, as it was in 2021 and 2022. But it remains fairly tight, confirming a slew of other data, including the low levels of claims for unemployment insurance. And today’s data too is supporting the Fed’s wait-and-see on rate cuts.


